Races in Marblehead, Massachusetts (MA) Detailed Stats
Ancestries, Foreign-born residents, place of birth
Settings
X


Recent posts about races in Marblehead, Massachusetts on our local forum with over 2,400,000 registered users:

Latest news about races in Marblehead, MA collected exclusively by city-data.com from local newspapers, TV, and radio stations
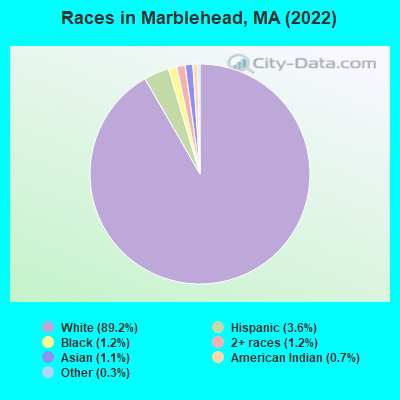
According to 2022 data, the most numerous races in Marblehead, MA are White alone (18,160 residents), Hispanic (741 residents), and Asian alone (221 residents). 88.0% of Marblehead residents speak English at home. 7.8% of Marblehead, MA residents are foreign-born (4.6% born in Europe, 1.3% born in Asia, 1.0% born in Latin America), which is 130.6% less than the foreign-born rate of 18.0% across the entire state of Massachusetts.
Race distribution in Marblehead
2000
2022

- 19,74796.9%White alone
- 2001.0%Asian alone
- 1790.9%Hispanic
- 1290.6%Two or more races
- 880.4%Black alone
- 160.08%American Indian alone
- 120.06%Other race alone
- 60.03%Native Hawaiian and Other
Pacific Islander alone

-
- 18,16089.2%White alone
- 7413.6%Hispanic
- 2521.2%Black alone
- 2501.2%Two or more races
- 2211.1%Asian alone
- 1410.7%American Indian alone
- 550.3%Other race alone
2000
2022
-
- 5,198,35981.9%White alone
- 428,7296.8%Hispanic
- 318,3295.0%Black alone
- 236,7863.7%Asian alone
- 110,3381.7%Two or more races
- 43,5860.7%Other race alone
- 11,2640.2%American Indian alone
- 1,7060.03%Native Hawaiian and Other
Pacific Islander alone

-
- 4,676,62767.0%White alone
- 911,03813.0%Hispanic
- 501,4637.2%Asian alone
- 459,7406.6%Black alone
- 341,8894.9%Two or more races
- 84,4031.2%Other race alone
- 5,8380.08%American Indian alone
- 9760.01%Native Hawaiian and Other
Pacific Islander alone

Income and house value in Marblehead
- Median household income in 2022
- $163,506White non-Hispanic householders
- over $200,000Asian householders
- $138,940Some other race householders
- $79,860Hispanic or Latino race householders
- Median 2022 house value
- $944,094White Non-Hispanic householders
- over $1,000,000Black or African American householders
- $738,820Asian householders
- $761,813Two or more races householders
- over $1,000,000Hispanic or Latino householders
Household income for White non-Hispanic householders

Household income for Black householders

Household income for American Indian and Alaska Native householders

Household income for Asian householders

Household income for Some other race householders

Household income for Two or more races householders

Household income for Hispanic or Latino race householders

Median age by race in Marblehead
- 52.0Median age for White residents
- 51.7Males
- 52.4Females
- 30.1Median age for Black or African American residents
- 16.5Males
- 32.1Females
- 44.8Median age for American Indian / Alaska Native residents
- -679,156,908.0Males
- -364,551,862.7Females
- 43.8Median age for Asian residents
- 51.4Males
- 42.8Females
- -514,227,641.8Median age for Native Hawaiian / Pacific Islander residents
- -666,666,666.0Males
- -508,717,948.2Females
- 65.7Median age for Other race residents
- -682,593,856.0Males
- 73.1Females
- 24.4Median age for Two or more races residents
- 38.3Males
- 20.2Females
- 51.8Median age for White alone residents
- 51.3Males
- 52.8Females
- 32.1Median age for Hispanic or Latino residents
- 40.4Males
- 28.4Females
Owner/renter occupied households by race in Marblehead
- House owners and renters - White residents
- 6,36883.5%Owner occupied
- 1,25716.5%Renter occupied
- House owners and renters - Black or African American residents
- 711.4%Owner occupied
- 5788.6%Renter occupied
- House owners and renters - American Indian / Alaska Native residents
- 85100.0%Owner occupied
- House owners and renters - Asian residents
- 6089.3%Owner occupied
- 710.7%Renter occupied
- House owners and renters - Other race residents
- 64100.0%Owner occupied
- House owners and renters - Two or more races residents
- 8786.9%Owner occupied
- 1313.1%Renter occupied
- House owners and renters - White alone residents
- 6,30083.0%Owner occupied
- 1,29017.0%Renter occupied
- House owners and renters - Hispanic or Latino residents
- 26476.3%Owner occupied
- 8223.7%Renter occupied
Language usage in Marblehead
- English speakers - Total
- 88.0% of residents of Marblehead speak English at home.
- 2.7% of residents speak Spanish at home
- 41477.8%Speak English very well
- 11822.2%Speak English less than very well
- 7.9% of residents speak other language at home
- 1,21277.0%Speak English very well
- 36223.0%Speak English less than very well
- English speakers - Born in the United States
- 97.7% of residents of Marblehead speak English at home.
- 1.0% of residents speak Spanish at home
- 56100.0%Speak English very well
- 1.7% of residents speak other language at home
- 95100.0%Speak English very well
- English speakers - Native, born elsewhere
- 87.1% of residents of Marblehead speak English at home.
- 16.4% of residents speak Spanish at home
- 60100.0%Speak English very well
- 10.1% of residents speak other language at home
- 37100.0%Speak English very well
- English speakers - Foreign-born
- 32.0% of residents of Marblehead speak English at home.
- 9.8% of residents speak Spanish at home
- 11872.8%Speak English very well
- 4427.2%Speak English less than very well
- 53.7% of residents speak other language at home
- 56764.1%Speak English very well
- 31835.9%Speak English less than very well
White (Caucasian) - Speak only English
| Native: | 96.2% (16,136) |
| Foreign-born: | 38.5% (324) |
White (Caucasian) - Speak another language
| Native: | 4.1% (682) |
| Foreign-born: | 62.9% (530) |
Black or African American - Speak only English
| Native: | 91.9% (148) |
| Foreign-born: | 100.0% (55) |
Asian - Speak only English
| Native: | 44.2% (39) |
| Foreign-born: | 25.2% (34) |
Asian - Speak another language
| Native: | 53.3% (47) |
| Foreign-born: | 72.1% (96) |
Other race - Speak another language
| Native: | 10.4% (9) |
| Foreign-born: | 99.8% (19) |
Two or more races - Speak only English
| Native: | 84.5% (250) |
| Foreign-born: | 33.0% (21) |
Two or more races - Speak another language
| Native: | 10.9% (32) |
| Foreign-born: | 74.6% (48) |
White alone - Speak only English
| Native: | 95.6% (16,126) |
| Foreign-born: | 34.4% (323) |
White alone - Speak another language
| Native: | 4.5% (751) |
| Foreign-born: | 65.4% (614) |
Hispanic or Latino - Speak only English
| Native: | 56.9% (236) |
| Foreign-born: | 24.4% (52) |
Hispanic or Latino - Speak another language
| Native: | 44.6% (185) |
| Foreign-born: | 77.0% (165) |
Foreign-born residents in Marblehead
1,590 residents are foreign born (4.6% Europe, 1.3% Asia, 1.0% Latin America).
| This city: | 7.8% |
| Massachusetts: | 17.6% |


Marital status for residents in Marblehead
Marital status - White (Caucasian) population 15 years and over
- Males
- 26.4%Never married
- 65.4%Now married
- 0.3%Separated
- 2.0%Widowed
- 5.9%Divorced
- Females
- 22.6%Never married
- 58.3%Now married
- 0.4%Separated
- 8.6%Widowed
- 10.1%Divorced
Women who gave birth in the past 12 months
| Now married: | 100.0% (85) |
| Unmarried: | 0.0% (0) |
Women who did not give birth in the past 12 months
| Now married: | 47.9% (1,435) |
| Unmarried: | 52.1% (1,564) |
Marital status - Black or African American population 15 years and over
- Males
- 100.0%Never married
- 0.0%Now married
- 0.0%Separated
- 0.0%Widowed
- 0.0%Divorced
- Females
- 68.5%Never married
- 25.0%Now married
- 0.0%Separated
- 0.0%Widowed
- 6.5%Divorced
Women who did not give birth in the past 12 months
| Now married: | 31.1% (22) |
| Unmarried: | 68.9% (48) |
Marital status - American Indian / Alaska Native population 15 years and over
- Males
- 0.0%Never married
- 100.0%Now married
- 0.0%Separated
- 0.0%Widowed
- 0.0%Divorced
- Females
- 21.3%Never married
- 78.7%Now married
- 0.0%Separated
- 0.0%Widowed
- 0.0%Divorced
Women who did not give birth in the past 12 months
| Now married: | 78.7% (57) |
| Unmarried: | 21.3% (15) |
Marital status - Asian population 15 years and over
- Males
- 10.5%Never married
- 78.9%Now married
- 0.0%Separated
- 0.0%Widowed
- 10.5%Divorced
- Females
- 18.9%Never married
- 81.1%Now married
- 0.0%Separated
- 0.0%Widowed
- 0.0%Divorced
Women who did not give birth in the past 12 months
| Now married: | 80.0% (84) |
| Unmarried: | 20.0% (21) |
Marital status - Other race population 15 years and over
- Males
- 0.0%Never married
- 100.0%Now married
- 0.0%Separated
- 0.0%Widowed
- 0.0%Divorced
- Females
- 44.6%Never married
- 43.1%Now married
- 0.0%Separated
- 0.0%Widowed
- 12.3%Divorced
Women who did not give birth in the past 12 months
| Now married: | 0.0% (0) |
| Unmarried: | 100.0% (37) |
Marital status - Two or more races population 15 years and over
- Males
- 41.2%Never married
- 24.7%Now married
- 0.0%Separated
- 0.0%Widowed
- 34.0%Divorced
- Females
- 46.4%Never married
- 24.8%Now married
- 0.0%Separated
- 13.6%Widowed
- 15.2%Divorced
Women who did not give birth in the past 12 months
| Now married: | 24.7% (29) |
| Unmarried: | 75.3% (89) |
Marital status - White alone, not Hispanic / Latino population 15 years and over
- Males
- 26.6%Never married
- 65.1%Now married
- 0.3%Separated
- 2.0%Widowed
- 5.9%Divorced
- Females
- 21.8%Never married
- 59.5%Now married
- 0.4%Separated
- 8.8%Widowed
- 9.4%Divorced
Women who gave birth in the past 12 months
| Now married: | 100.0% (90) |
| Unmarried: | 0.0% (0) |
Women who did not give birth in the past 12 months
| Now married: | 50.0% (1,514) |
| Unmarried: | 50.0% (1,515) |
Marital status - Hispanic or Latino population 15 years and over
- Males
- 7.3%Never married
- 74.0%Now married
- 0.0%Separated
- 0.0%Widowed
- 18.6%Divorced
- Females
- 58.9%Never married
- 8.6%Now married
- 0.0%Separated
- 6.1%Widowed
- 26.4%Divorced
Women who did not give birth in the past 12 months
| Now married: | 0.0% (0) |
| Unmarried: | 100.0% (211) |
Ancestries in Marblehead

- 1,93723.1%Irish
- 7689.2%English
- 7128.5%Italian
- 5796.9%American
- 3604.3%German
- 3464.1%Russian
- 3013.6%Greek
- 2412.9%European
- 1992.4%Eastern European
- 1351.6%Polish
- 1271.5%African
- 1201.4%Swedish
- 1141.4%Dutch
- 1051.3%Scottish
- 790.9%Norwegian
- 590.7%French Canadian
- 580.7%Ukrainian
- 520.6%British
- 520.6%French
- 520.6%Portuguese
- 500.6%Scotch-Irish
- 440.5%Swiss
- 400.5%Bulgarian
- 320.4%Lithuanian
- 290.3%Northern European
- 270.3%Canadian
- 260.3%Hungarian
- 210.3%Iranian
- 160.2%Danish
- 120.1%Serbian
- 90.1%Finnish
- 80.10%Austrian
- 50.06%Latvian
- 50.06%Scandinavian

Geographical mobility in Marblehead

- Same house 1 year ago
- 16,99195.1%White (Caucasian)
- 226100.0%Black or African American
- 154100.0%American Indian / Alaska Native
- 21495.9%Asian
- 115100.0%Other race
- 34186.4%Two or more races
- 17,09594.6%White alone, not Hispanic / Latino
- 735100.0%Hispanic or Latino

-
- Moved within same county
- 4682.6%White / Caucasian
- 4812.1%Two or more races
- 5082.8%White alone, not Hispanic / Latino
- 152.1%Hispanic or Latino

-
- Moved within same state
- 2191.2%White / Caucasian
- 2321.3%White alone, not Hispanic / Latino

-
- Moved from different state
- 1380.8%White / Caucasian
- 1400.8%White alone, not Hispanic / Latino

-
- Moved from abroad
- 750.4%White
- 1000.6%White alone, not Hispanic / Latino

Children Nativity (place of birth) in Marblehead
Place of birth for residents in Marblehead
![Place of birth for the foreign-born population - Regions]()
- 960Europe
- 426Eastern Europe
- 300Americas
- 263Asia
- 258Northern Europe
- 218Latin America
- 195Southern Europe
- 108South America
- 104Eastern Asia
- 94South Central Asia
- 92China
- 82Northern America
- 80Caribbean
- 79Western Europe
- 65Africa
- 53South Eastern Asia
- 29Central America
- 13Northern Africa
- 11Western Asia

![Place of birth for the foreign-born population - Countries]()
- 274Russia
- 98United Kingdom
- 92China
- 84Italy
- 84India
- 82Canada
- 80Dominican Republic
- 77Greece
- 75England
- 74Ukraine
- 43Argentina
- 41Ireland
- 40Bulgaria
- 35Netherlands
- 33Sweden
- 33Spain
- 33Brazil
- 29Costa Rica
- 22Germany
- 20Switzerland
- 18Indonesia
- 16Peru
- 15Philippines
- 15Colombia
- 13Vietnam
- 12Japan
- 11Turkey
- 10Iran
- 9Norway
- 9Poland
- 6Thailand

Zip codes: 01945.