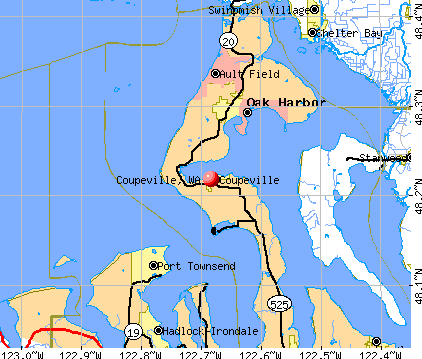
Coupeville, Washington
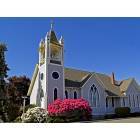
Coupeville: United Methodist Church in Coupeville
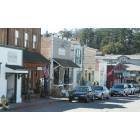
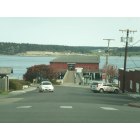
Coupeville: Front Street
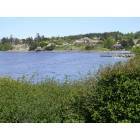
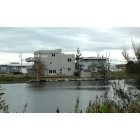
Coupeville: Coupeville View
Coupeville: Coupeville, WA
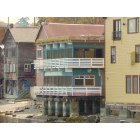
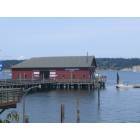
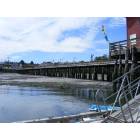
Coupeville: The Rich Colors of Coupeville Waterfrount
Coupeville: Coupeville Dock
Coupeville: Admiral's Cove
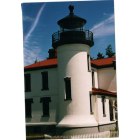
Coupeville: admiralty Head Lighthouse
Coupeville: Looking inland from the boat dock on the wharf
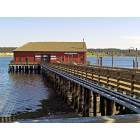
Coupeville: Coupeville Wharf
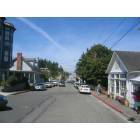
Coupeville: Downtown Coupeville, WA
- see
13
more - add
your
Submit your own pictures of this town and show them to the world
- OSM Map
- General Map
- Google Map
- MSN Map
Population change since 2000: +12.3%
 |
| Males: 931 | |
| Females: 1,004 |
| Median resident age: | 66.2 years |
| Washington median age: | 38.4 years |
Zip codes: 98239.
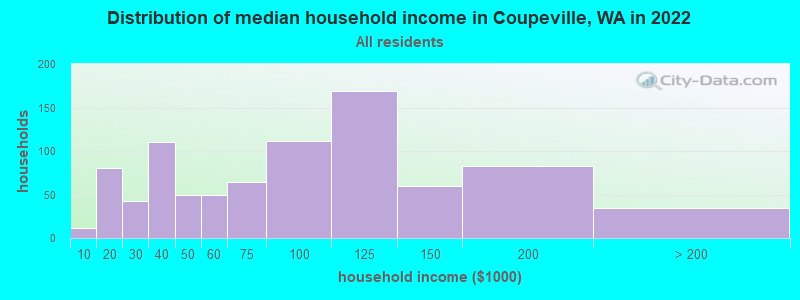
| Coupeville: | $77,428 |
| WA: | $91,306 |
Estimated per capita income in 2022: $38,619 (it was $18,720 in 2000)
Coupeville town income, earnings, and wages data
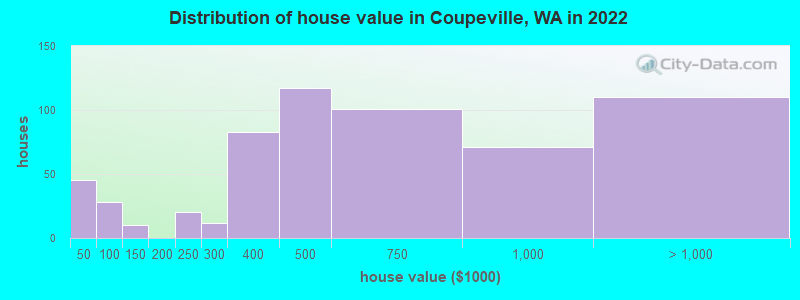
Estimated median house or condo value in 2022: $557,234 (it was $141,800 in 2000)
| Coupeville: | $557,234 |
| WA: | $569,500 |
Mean prices in 2022: all housing units: $587,627; detached houses: $611,004; townhouses or other attached units: over $1,000,000; in 2-unit structures: $357,982; in 3-to-4-unit structures: $240,781; in 5-or-more-unit structures: $303,485; mobile homes: $246,296; occupied boats, rvs, vans, etc.: $145,896
Median gross rent in 2022: $1,089.
(9.5% for White Non-Hispanic residents, 53.9% for Hispanic or Latino residents, 100.0% for American Indian residents, 78.9% for other race residents, 7.4% for two or more races residents)
Detailed information about poverty and poor residents in Coupeville, WA


Compare current foreclosures near Coupeville, WA:
| Photo | Address | Area | Beds / Baths | Price | Details |
|---|---|---|---|---|---|

|
#1
Seaview Ave
Coupeville, WA 98239
|
1,746 sq. feet
|
2 baths 3 beds |
show details | |

|
#2
Seaside Dr
Coupeville, WA 98239
|
1,983 sq. feet
|
3 baths 4 beds |
show details | |

|
#3
Leahy Dr
Coupeville, WA 98239
|
- sq. feet
|
- baths - beds |
show details | |

|
#4
El Toro St
Coupeville, WA 98239
|
- sq. feet
|
- baths - beds |
show details | |

|
#5
SW Roeder Dr
Oak Harbor, WA 98277
|
1,802 sq. feet
|
2 baths 3 beds |
$560,000
|
show details |

|
#6
Olympic View Dr
Coupeville, WA 98239
|
- sq. feet
|
- baths - beds |
show details | |

|
#7
Olympic View Dr
Coupeville, WA 98239
|
- sq. feet
|
- baths - beds |
show details | |

|
#8
Carl Ave
Oak Harbor, WA 98277
|
1,297 sq. feet
|
2 baths 3 beds |
show details | |

|
#9
Shoreline Dr
Camano Island, WA 98282
|
1,963 sq. feet
|
3 baths 2 beds |
show details | |

|
#10
Donald Ave
Oak Harbor, WA 98277
|
1,006 sq. feet
|
1 baths 1 beds |
show details |
| Photo | Address | Area | Beds / Baths | Price | Details |
|---|---|---|---|---|---|

|
#11
Arrowhead Rd
Camano Island, WA 98282
|
1,364 sq. feet
|
1 baths 2 beds |
show details | |

|
#12
Banta Rd
Oak Harbor, WA 98277
|
3,129 sq. feet
|
2 baths 3 beds |
show details | |

|
#13
Rainbow Ln
Camano Island, WA 98282
|
2,738 sq. feet
|
2 baths 3 beds |
show details | |

|
#14
Cape George Rd
Port Townsend, WA 98368
|
1,080 sq. feet
|
2 baths 3 beds |
show details | |

|
#15
96th Ct NW
Stanwood, WA 98292
|
- sq. feet
|
2 baths 3 beds |
show details | |

|
#16
NE Midway Blvd
Oak Harbor, WA 98277
|
2,102 sq. feet
|
2 baths 3 beds |
show details | |

|
#17
NE 3rd Ave
Oak Harbor, WA 98277
|
1,138 sq. feet
|
1 baths 3 beds |
show details | |

|
#18
285th Pl NW
Stanwood, WA 98292
|
2,268 sq. feet
|
3 baths 3 beds |
show details | |

|
#19
W Lake Ketchum Rd
Stanwood, WA 98292
|
2,613 sq. feet
|
2 baths 3 beds |
show details | |

|
#20
Lola Ln
Langley, WA 98260
|
1,311 sq. feet
|
2 baths 2 beds |
show details |
| Photo | Address | Area | Beds / Baths | Price | Details |
|---|---|---|---|---|---|

|
#21
Orchard Loop
Oak Harbor, WA 98277
|
2,238 sq. feet
|
2 baths 5 beds |
show details | |

|
#22
SE Camano Dr
Camano Island, WA 98282
|
1,816 sq. feet
|
1 baths 2 beds |
show details | |

|
#23
Mashie St
Anacortes, WA 98221
|
1,152 sq. feet
|
1 baths 2 beds |
show details | |

|
#24
74th Dr NW
Stanwood, WA 98292
|
1,461 sq. feet
|
3 baths 3 beds |
show details | |

|
#25
SE 8th Ave
Oak Harbor, WA 98277
|
3,464 sq. feet
|
4 baths 6 beds |
show details | |

|
#26
74th Dr NW
Stanwood, WA 98292
|
1,653 sq. feet
|
2 baths 4 beds |
show details | |

|
#27
78th Dr NW
Stanwood, WA 98292
|
1,072 sq. feet
|
1 baths 3 beds |
show details | |

|
#28
S Sapphire Dr
Camano Island, WA 98282
|
1,476 sq. feet
|
2 baths 2 beds |
show details | |

|
#29
Mallard Ln
Camano Island, WA 98282
|
3,158 sq. feet
|
2 baths 3 beds |
show details | |

|
#30
284th St NW
Stanwood, WA 98292
|
1,597 sq. feet
|
1 baths 3 beds |
show details |
| Photo | Address | Area | Beds / Baths | Price | Details |
|---|---|---|---|---|---|

|
#31
287th Pl NW
Stanwood, WA 98292
|
2,949 sq. feet
|
2 baths 4 beds |
show details | |

|
#32
289th Pl NW
Stanwood, WA 98292
|
1,628 sq. feet
|
2 baths 3 beds |
show details | |

|
#33
Thompson Dr
Camano Island, WA 98282
|
1,475 sq. feet
|
3 baths 3 beds |
show details | |

|
#34
Flagler Rd
Nordland, WA 98358
|
864 sq. feet
|
1 baths 1 beds |
show details | |

|
#35
Dogwood Ln
Camano Island, WA 98282
|
2,652 sq. feet
|
3 baths 4 beds |
show details | |

|
#36
Frayne St
Port Hadlock, WA 98339
|
1,404 sq. feet
|
2 baths 3 beds |
show details | |

|
#37
S Lake Ketchum Rd
Stanwood, WA 98292
|
1,028 sq. feet
|
2 baths 3 beds |
show details | |

|
#38
72nd Ave NW
Stanwood, WA 98292
|
1,101 sq. feet
|
1 baths 3 beds |
show details | |

|
#39
Church Creek Loop NW
Stanwood, WA 98292
|
1,220 sq. feet
|
2 baths 3 beds |
show details | |

|
#40
281st Pl NW
Stanwood, WA 98292
|
1,954 sq. feet
|
2 baths 4 beds |
show details |
| Photo | Address | Area | Beds / Baths | Price | Details |
|---|---|---|---|---|---|

|
#41
W Lake Ketchum Rd
Stanwood, WA 98292
|
2,613 sq. feet
|
2 baths 3 beds |
show details | |

|
#42
Florence Rd
Stanwood, WA 98292
|
1,584 sq. feet
|
1 baths 4 beds |
show details | |

|
#43
Happy Hollow Rd
Stanwood, WA 98292
|
1,460 sq. feet
|
1 baths 2 beds |
show details | |

|
#44
183rd St NW
Stanwood, WA 98292
|
1,824 sq. feet
|
1 baths 3 beds |
show details | |

|
#45
Lochwood Dr
Camano Island, WA 98282
|
1,368 sq. feet
|
2 baths 2 beds |
show details | |

|
#46
Mountain View Ln
Freeland, WA 98249
|
1,414 sq. feet
|
2 baths 3 beds |
show details | |

|
#47
Summit St
Camano Island, WA 98282
|
1,439 sq. feet
|
2 baths 2 beds |
show details | |

|
#48
NE 8th Ave
Oak Harbor, WA 98277
|
1,680 sq. feet
|
2 baths 3 beds |
show details | |

|
#49
Dolphin St
Camano Island, WA 98282
|
1,432 sq. feet
|
2 baths 2 beds |
show details | |

|
Check over 1 million property listings on Foreclosure.com!
|
browse all offers | |||


- 1,60278.5%White alone
- 2019.8%Two or more races
- 1517.4%Hispanic
- 452.2%Asian alone
- 371.8%American Indian alone
- 190.9%Black alone
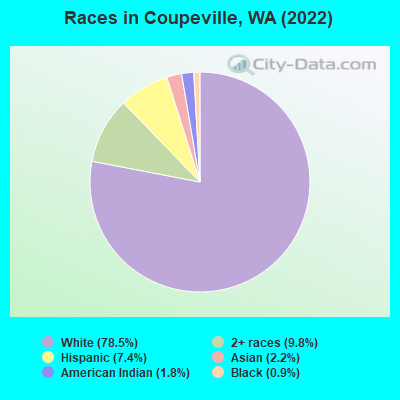
Races in Coupeville detailed stats: ancestries, foreign born residents, place of birth
According to our research of Washington and other state lists, there were 3 registered sex offenders living in Coupeville, Washington as of June 10, 2024.
The ratio of all residents to sex offenders in Coupeville is 722 to 1.
 Recent articles from our blog. Our writers, many of them Ph.D. graduates or candidates, create easy-to-read articles on a wide variety of topics.

 | Coupeville and Langley Area Information (26 replies) |
| PNW Trip this Summer (113 replies) |
| Visiting the Emerald City. (16 replies) |
| Quietest Places in WA...Least Man-Made Noise? (48 replies) |
| A Seattle Thread to Post Theater, Music, Art and Cultural Happenings Around the Area (308 replies) |
| Renton Vs Seattle for a visit? (15 replies) |
Latest news from Coupeville, WA collected exclusively by city-data.com from local newspapers, TV, and radio stations
Ancestries: German (22.5%), Irish (10.3%), Danish (8.9%), Norwegian (8.3%), American (7.7%), English (5.2%).
Current Local Time: PST time zone
Incorporated in 1910
Elevation: 80 feet
Land area: 1.28 square miles.
Population density: 1,512 people per square mile (low).
285 residents are foreign born (7.4% Europe, 4.2% Asia, 1.7% Latin America).
| This town: | 14.0% |
| Washington: | 14.9% |
Median real estate property taxes paid for housing units with mortgages in 2022: $3,657 (0.6%)
Median real estate property taxes paid for housing units with no mortgage in 2022: $3,810 (0.8%)
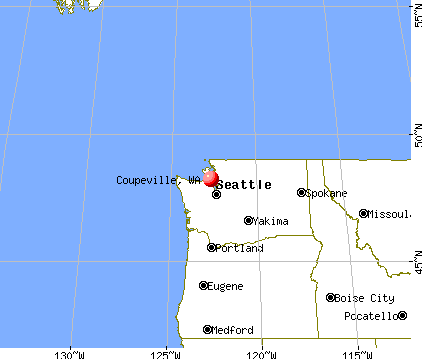
Nearest city with pop. 50,000+: Everett, WA  (28.4 miles , pop. 91,488).
Nearest city with pop. 200,000+: Seattle, WA (44.0 miles , pop. 563,374).
Nearest city with pop. 1,000,000+: Los Angeles, CA (1002.5 miles , pop. 3,694,820).
Nearest cities:
), ), ), ), )Latitude: 48.22 N, Longitude: 122.68 W
Area code commonly used in this area: 360

Coupeville tourist attractions:
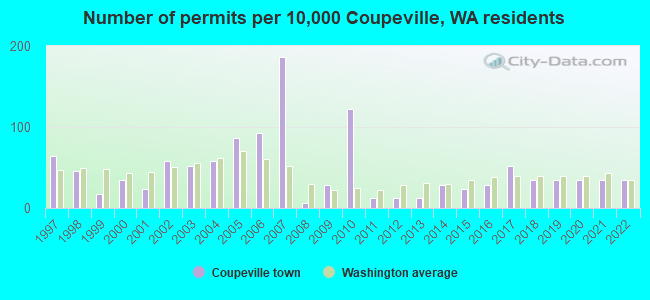
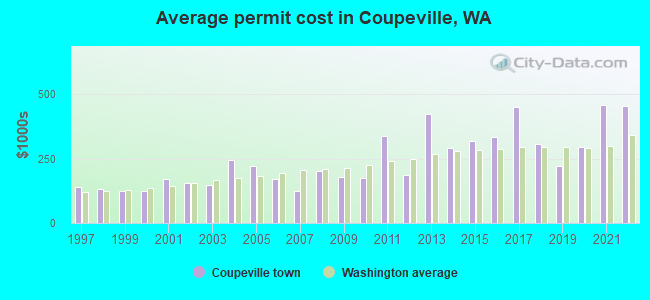
Single-family new house construction building permits:
- 2022: 6 buildings, average cost: $457,000
- 2021: 6 buildings, average cost: $459,600
- 2020: 6 buildings, average cost: $296,800
- 2019: 6 buildings, average cost: $222,500
- 2018: 6 buildings, average cost: $306,400
- 2017: 9 buildings, average cost: $452,800
- 2016: 5 buildings, average cost: $335,900
- 2015: 4 buildings, average cost: $318,500
- 2014: 5 buildings, average cost: $290,200
- 2013: 2 buildings, average cost: $423,000
- 2012: 2 buildings, average cost: $188,400
- 2011: 2 buildings, average cost: $340,100
- 2010: 21 buildings, average cost: $175,000
- 2009: 5 buildings, average cost: $177,900
- 2008: 1 building, cost: $204,000
- 2007: 32 buildings, average cost: $125,000
- 2006: 16 buildings, average cost: $171,600
- 2005: 15 buildings, average cost: $223,200
- 2004: 10 buildings, average cost: $244,100
- 2003: 9 buildings, average cost: $149,000
- 2002: 10 buildings, average cost: $155,300
- 2001: 4 buildings, average cost: $172,500
- 2000: 6 buildings, average cost: $124,900
- 1999: 3 buildings, average cost: $126,200
- 1998: 8 buildings, average cost: $131,600
- 1997: 11 buildings, average cost: $140,900
| Here: | 5.0% |
| Washington: | 4.6% |
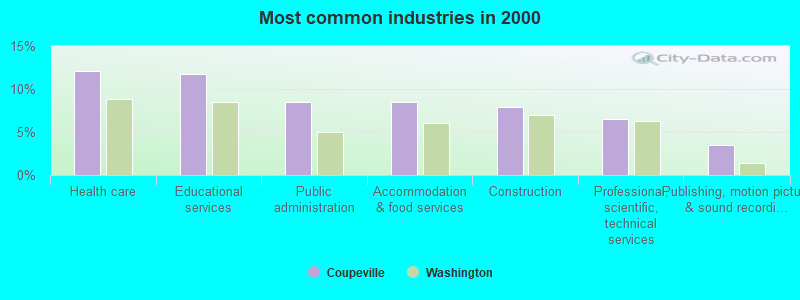
- Health care (12.1%)
- Educational services (11.8%)
- Public administration (8.4%)
- Accommodation & food services (8.4%)
- Construction (8.0%)
- Professional, scientific, technical services (6.5%)
- Publishing, motion picture & sound recording industries (3.5%)
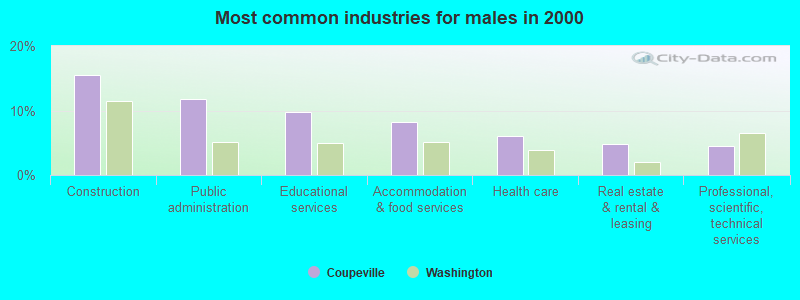
- Construction (15.6%)
- Public administration (11.7%)
- Educational services (9.8%)
- Accommodation & food services (8.3%)
- Health care (6.0%)
- Real estate & rental & leasing (4.8%)
- Professional, scientific, technical services (4.4%)
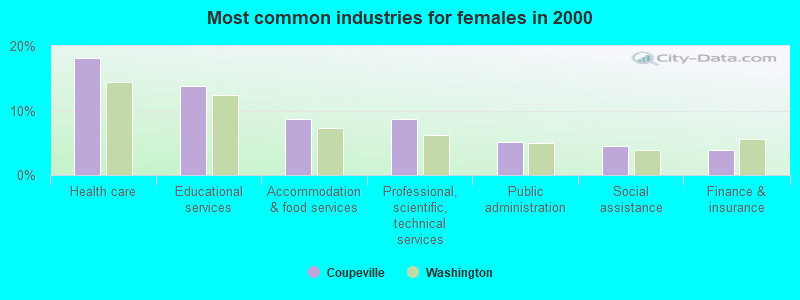
- Health care (18.2%)
- Educational services (13.7%)
- Accommodation & food services (8.6%)
- Professional, scientific, technical services (8.6%)
- Public administration (5.1%)
- Social assistance (4.5%)
- Finance & insurance (3.8%)
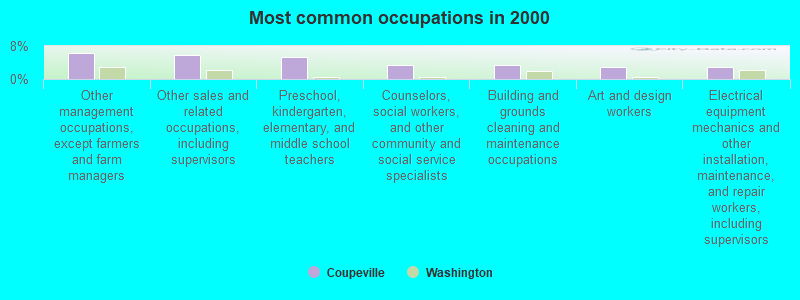
- Other management occupations, except farmers and farm managers (6.4%)
- Other sales and related occupations, including supervisors (5.7%)
- Preschool, kindergarten, elementary, and middle school teachers (5.3%)
- Counselors, social workers, and other community and social service specialists (3.5%)
- Building and grounds cleaning and maintenance occupations (3.3%)
- Art and design workers (3.0%)
- Electrical equipment mechanics and other installation, maintenance, and repair workers, including supervisors (3.0%)
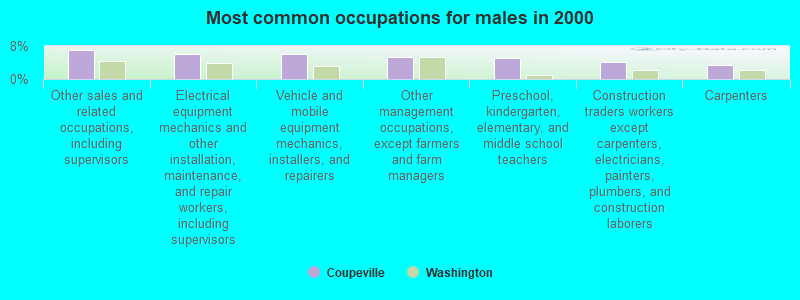
- Other sales and related occupations, including supervisors (7.0%)
- Electrical equipment mechanics and other installation, maintenance, and repair workers, including supervisors (6.0%)
- Vehicle and mobile equipment mechanics, installers, and repairers (6.0%)
- Other management occupations, except farmers and farm managers (5.4%)
- Preschool, kindergarten, elementary, and middle school teachers (5.1%)
- Construction traders workers except carpenters, electricians, painters, plumbers, and construction laborers (4.1%)
- Carpenters (3.5%)
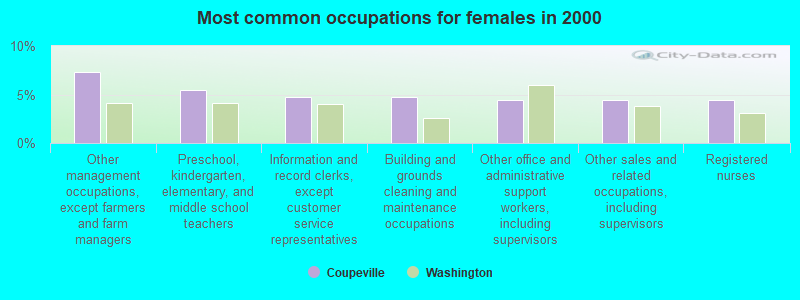
- Other management occupations, except farmers and farm managers (7.3%)
- Preschool, kindergarten, elementary, and middle school teachers (5.4%)
- Information and record clerks, except customer service representatives (4.8%)
- Building and grounds cleaning and maintenance occupations (4.8%)
- Other office and administrative support workers, including supervisors (4.5%)
- Other sales and related occupations, including supervisors (4.5%)
- Registered nurses (4.5%)
Average climate in Coupeville, Washington
Based on data reported by over 4,000 weather stations


|
|


(lower is better)
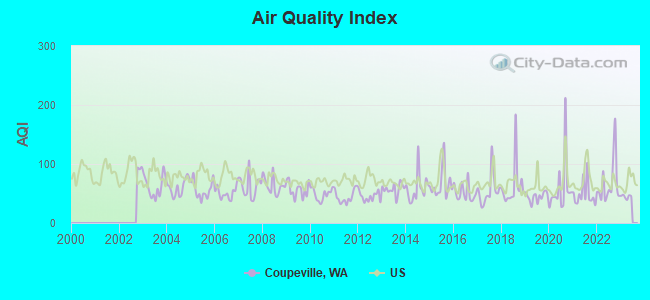
Air Quality Index (AQI) level in 2022 was 67.7. This is about average.
| City: | 67.7 |
| U.S.: | 72.6 |
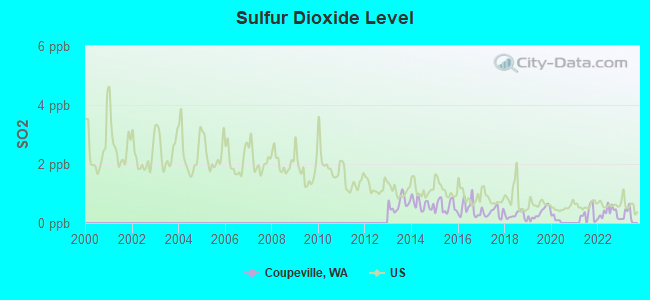
Sulfur Dioxide (SO2) [ppb] level in 2022 was 0.347. This is significantly better than average. Closest monitor was 17.7 miles away from the city center.
| City: | 0.347 |
| U.S.: | 1.515 |
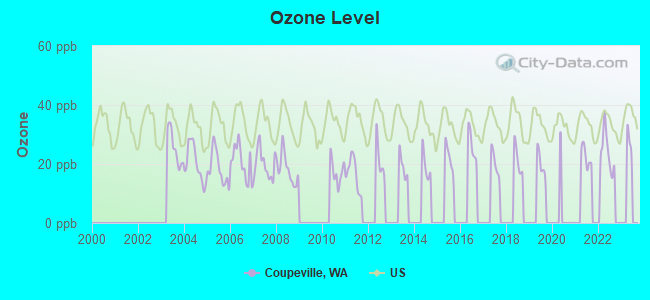
Ozone [ppb] level in 2022 was 24.1. This is better than average. Closest monitor was 18.3 miles away from the city center.
| City: | 24.1 |
| U.S.: | 33.3 |
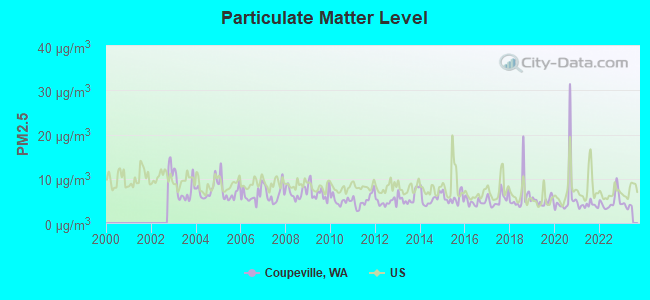
Particulate Matter (PM2.5) [µg/m3] level in 2022 was 4.92. This is significantly better than average. Closest monitor was 7.6 miles away from the city center.
| City: | 4.92 |
| U.S.: | 8.11 |
Earthquake activity:
Coupeville-area historical earthquake activity is significantly above Washington state average. It is 1121% greater than the overall U.S. average.On 4/13/1949 at 19:55:42, a magnitude 7.0 (7.0 UK, Class: Major, Intensity: VIII - XII) earthquake occurred 67.5 miles away from the city center, causing $80,000,000 total damage
On 2/28/2001 at 18:54:32, a magnitude 6.8 (6.8 MD, Depth: 32.2 mi, Class: Strong, Intensity: VII - IX) earthquake occurred 74.0 miles away from the city center
On 2/28/2001 at 18:54:32, a magnitude 6.8 (6.5 MB, 6.6 MS, 6.8 MW) earthquake occurred 78.2 miles away from Coupeville center, causing $2,000,000,000 total damage and $305,000,000 insured losses
On 4/29/1965 at 15:28:43, a magnitude 6.6 (6.6 UK) earthquake occurred 64.4 miles away from the city center, causing $28,000,000 total damage
On 7/3/1999 at 01:43:54, a magnitude 5.8 (5.4 MB, 5.5 MS, 5.8 MW, 5.3 ME, Depth: 25.2 mi, Class: Moderate, Intensity: VI - VII) earthquake occurred 84.1 miles away from the city center
On 5/3/1996 at 04:04:22, a magnitude 5.5 (5.2 MB, 5.3 MD, 5.5 ML, Depth: 2.5 mi) earthquake occurred 50.9 miles away from the city center
Magnitude types: body-wave magnitude (MB), duration magnitude (MD), energy magnitude (ME), local magnitude (ML), surface-wave magnitude (MS), moment magnitude (MW)
Natural disasters:
The number of natural disasters in Island County (16) is near the US average (15).Major Disasters (Presidential) Declared: 13
Emergencies Declared: 1
Causes of natural disasters: Floods: 8, Storms: 8, Landslides: 5, Mudslides: 5, Winds: 4, Winter Storms: 4, Earthquake: 1, Hurricane: 1, Snow: 1, Tornado: 1, Volcanic Eruption: 1, Other: 1 (Note: some incidents may be assigned to more than one category).
Hospitals and medical centers in Coupeville:
Airports and heliports located in Coupeville:
- Coupeville Airpark Airport (WN40) (Runways: 1)
- Coupeville Nolf Airport (NRA) (Runways: 1)
- Whidbey General Hospital Heliport (01WN)
Colleges/universities with over 2000 students nearest to Coupeville:
- Skagit Valley College (about 23 miles; Mount Vernon, WA; Full-time enrollment: 3,803)
- Everett Community College (about 27 miles; Everett, WA; FT enrollment: 5,818)
- Edmonds Community College (about 33 miles; Lynnwood, WA; FT enrollment: 7,271)
- Peninsula College (about 35 miles; Port Angeles, WA; FT enrollment: 2,012)
- Shoreline Community College (about 36 miles; Shoreline, WA; FT enrollment: 5,026)
- Western Washington University (about 38 miles; Bellingham, WA; FT enrollment: 13,875)
- University of Washington-Bothell Campus (about 39 miles; Bothell, WA; FT enrollment: 3,902)
Public high schools in Coupeville:
- COUPEVILLE HIGH SCHOOL (Location: 501 SOUTH MAIN STREET, Grades: 9-12)
- ISLAND JUVENILE DETENTION EDUCATION PROGRAM (Location: 2 S MAIN ST, Grades: 7-12)
- ICCF ED PROGRAM (Location: 501 N MAIN ST, Grades: 9-12)
Public elementary/middle schools in Coupeville:
- COUPEVILLE ELEMENTARY SCHOOL (Location: 6 SOUTH MAIN STREET, Grades: PK-5)
- COUPEVILLE MIDDLE SCHOOL (Location: 501 SOUTH MAIN STREET, Grades: 6-8)
Points of interest:
Notable locations in Coupeville: Coupeville Sewage Treatment Plant (A), Coupeville Wastewater Treatment Plant (B), Island County Fire District 5 Central Whidbey Fire and Rescue Station 51 (C), Zylstra House (D), Joseph Clapp House (E), Alexander Blockhouse (F), Careage of Whidbey (G), Island County Jail (H), Coupeville Town Hall (I), Island County Christensen Building (J), Island County Nursing Services Building (K), Island County Kaul Building (L), Island County Facility Maintenance Building (M), Island County Dutton Building (N), Island County Administration Building (O), Island County Law and Justice Center (P), Island County Annex (Q), Island County Historical Society (R), Coupeville Library (S). Display/hide their locations on the map
Churches in Coupeville include: Living Hope Foursquare Church (A), Coupeville Community Bible Church (B), Coupeville Methodist Church (C), Saint Mary's Catholic Church (D). Display/hide their locations on the map
Park in Coupeville: Ebeys Landing National Historical Reserve (1). Display/hide its location on the map
Tourist attractions: Island County Historic Society (Museums; 908 Northwest Alexander Street), Museums USA - Worldwide Educational Expeditions (Cultural Attractions- Events- & Facilities; Broadway), Sno-Isle Libraries (Cultural Attractions- Events- & Facilities; 788 Northwest Alexander).
Hotels: Countryside Inn (19777 State Route 20), Coupeville Inn On Penn Cove (200 Northwest Coveland St).
Drinking water stations with addresses in Coupeville and their reported violations in the past:
COUPEVILLE, TOWN OF (Population served: 3,684, Groundwater):Past monitoring violations:
- 18 regular monitoring violations
Drinking water stations with addresses in Coupeville that have no violations reported:
- ISLAND COUNTY MAXWELTON PARK (Population served: 68, Primary Water Source Type: Groundwater)
| This town: | 2.1 people |
| Washington: | 2.5 people |
| This town: | 53.1% |
| Whole state: | 64.4% |
| This town: | 7.1% |
| Whole state: | 7.7% |
Likely homosexual households (counted as self-reported same-sex unmarried-partner households)
- Lesbian couples: 0.9% of all households
- Gay men: 0.2% of all households
People in group quarters in Coupeville in 2010:
- 108 people in nursing facilities/skilled-nursing facilities
- 49 people in local jails and other municipal confinement facilities
- 8 people in workers' group living quarters and job corps centers
- 6 people in in-patient hospice facilities
People in group quarters in Coupeville in 2000:
- 90 people in nursing homes
- 33 people in local jails and other confinement facilities (including police lockups)
- 5 people in other noninstitutional group quarters
Banks with branches in Coupeville (2011 data):
- Peoples Bank: Coupeville Office at 107 S. Main Street, branch established on 2004/07/14. Info updated 2006/11/03: Bank assets: $1,224.9 mil, Deposits: $1,084.6 mil, headquarters in Lynden, WA, positive income, Commercial Lending Specialization, 26 total offices, Holding Company: Peoples Bancorp
- Whidbey Island Bank: at 401 N. Main, branch established on 1961/07/01. Info updated 2010/09/27: Bank assets: $1,668.6 mil, Deposits: $1,471.8 mil, local headquarters, positive income, Commercial Lending Specialization, 32 total offices, Holding Company: Washington Banking Company
- Wells Fargo Bank, National Association: Coupeville Branch at 7 Northwest Birch Street, branch established on 1956/04/05. Info updated 2011/04/05: Bank assets: $1,161,490.0 mil, Deposits: $905,653.0 mil, headquarters in Sioux Falls, SD, positive income, 6395 total offices, Holding Company: Wells Fargo & Company
For population 15 years and over in Coupeville:
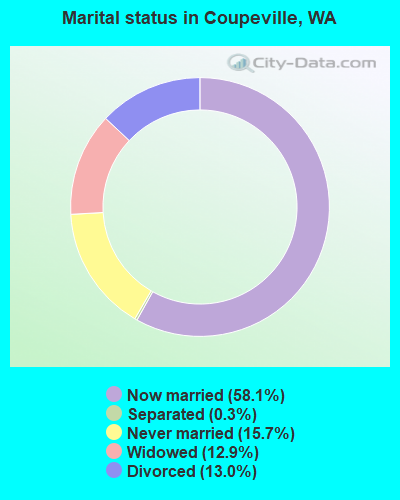
- Never married: 15.7%
- Now married: 58.1%
- Separated: 0.3%
- Widowed: 12.9%
- Divorced: 13.0%
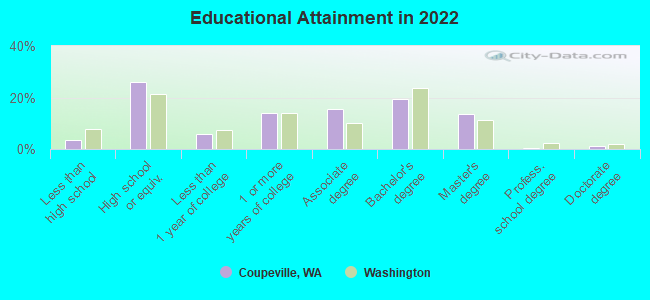
For population 25 years and over in Coupeville:
- High school or higher: 95.8%
- Bachelor's degree or higher: 33.5%
- Graduate or professional degree: 14.0%
- Unemployed: 7.9%
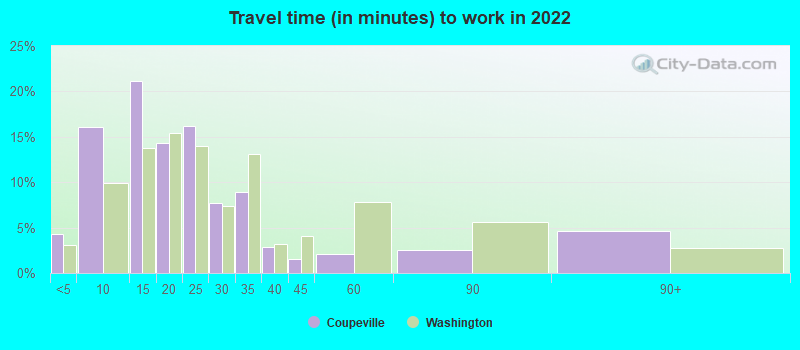
- Mean travel time to work (commute): 20.0 minutes
| Here: | 9.7 |
| Washington average: | 11.6 |
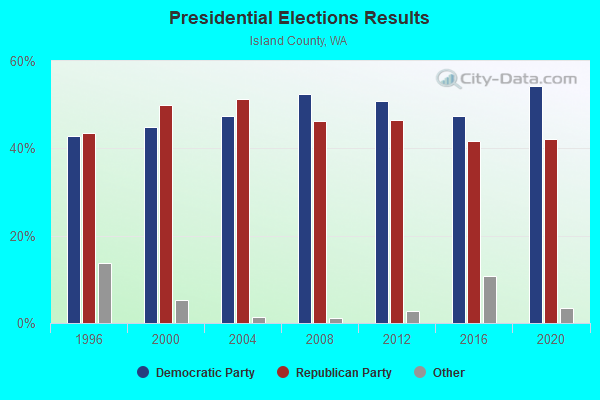
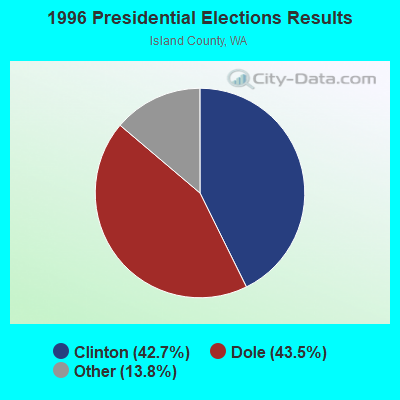
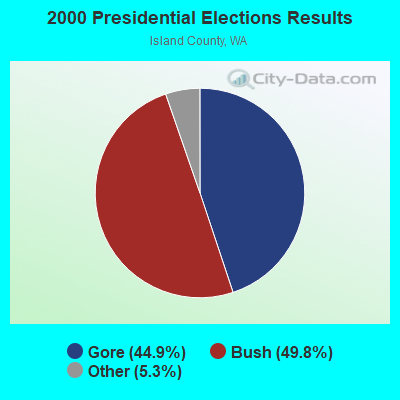
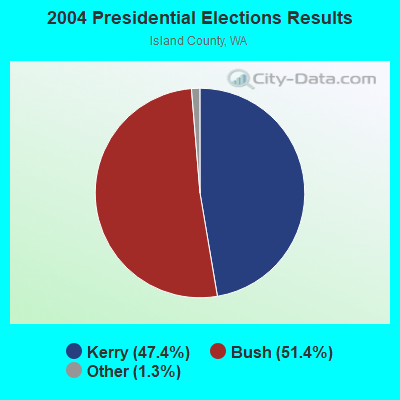
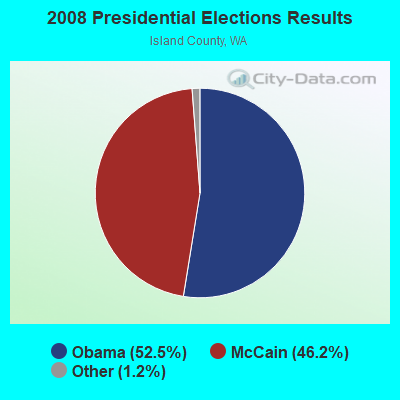
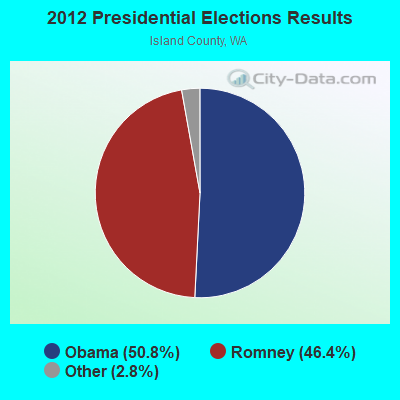
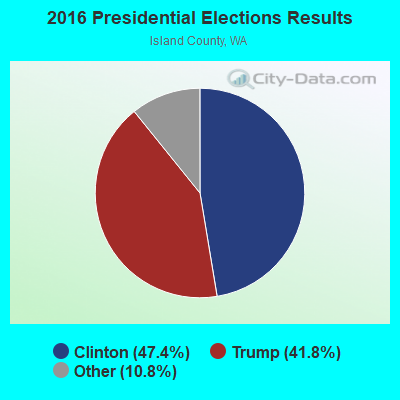
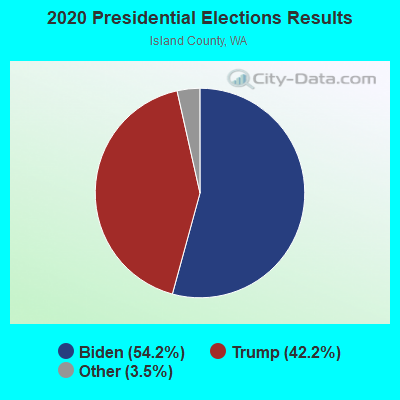
Graphs represent county-level data. Detailed 2008 Election Results
Religion statistics for Coupeville, WA (based on Island County data)
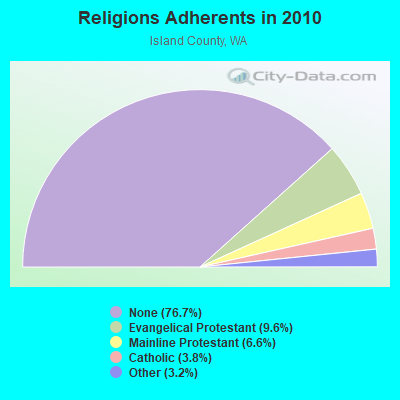
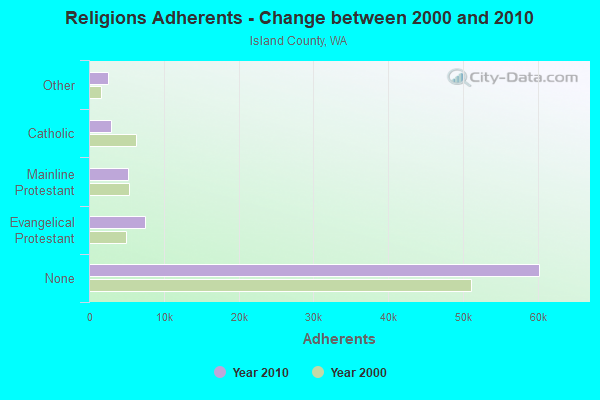
| Religion | Adherents | Congregations |
|---|---|---|
| Evangelical Protestant | 7,546 | 39 |
| Mainline Protestant | 5,207 | 14 |
| Catholic | 2,962 | 3 |
| Other | 2,546 | 14 |
| None | 60,245 | - |
Food Environment Statistics:
| Island County: | 1.73 / 10,000 pop. |
| Washington: | 2.06 / 10,000 pop. |
| Here: | 0.25 / 10,000 pop. |
| Washington: | 1.18 / 10,000 pop. |
| Island County: | 2.22 / 10,000 pop. |
| Washington: | 2.67 / 10,000 pop. |
| Island County: | 7.29 / 10,000 pop. |
| Washington: | 8.26 / 10,000 pop. |
| Island County: | 7.9% |
| State: | 7.7% |
| Island County: | 24.1% |
| Washington: | 25.7% |
| Island County: | 9.9% |
| Washington: | 13.9% |
Health and Nutrition:
| Coupeville: | 54.3% |
| State: | 49.9% |
| Here: | 51.8% |
| Washington: | 47.2% |
| This city: | 28.1 |
| State: | 28.4 |
| Coupeville: | 19.8% |
| Washington: | 20.9% |
| Here: | 10.6% |
| State: | 10.5% |
| This city: | 7.0 |
| State: | 6.8 |
| Here: | 34.1% |
| Washington: | 32.8% |
| This city: | 58.8% |
| State: | 56.8% |
| Coupeville: | 77.4% |
| Washington: | 79.4% |
More about Health and Nutrition of Coupeville, WA Residents
| Local government employment and payroll (March 2022) | |||||
| Function | Full-time employees | Monthly full-time payroll | Average yearly full-time wage | Part-time employees | Monthly part-time payroll |
|---|---|---|---|---|---|
| Other Government Administration | 4 | $21,486 | $64,458 | 0 | $0 |
| Financial Administration | 3 | $15,865 | $63,460 | 0 | $0 |
| Water Supply | 3 | $17,076 | $68,304 | 0 | $0 |
| Streets and Highways | 2 | $12,721 | $76,326 | 0 | $0 |
| Parks and Recreation | 2 | $9,089 | $54,534 | 0 | $0 |
| Sewerage | 2 | $8,579 | $51,474 | 0 | $0 |
| Totals for Government | 16 | $84,816 | $63,612 | 0 | $0 |
Coupeville government finances - Expenditure in 2017 (per resident):
- Construction - Regular Highways: $221,000 ($114.21)
- Current Operations - Police Protection: $566,000 ($292.51)
Sewerage: $370,000 ($191.21)
Water Utilities: $364,000 ($188.11)
Central Staff Services: $189,000 ($97.67)
Regular Highways: $172,000 ($88.89)
General - Other: $145,000 ($74.94)
Parks and Recreation: $129,000 ($66.67)
Financial Administration: $114,000 ($58.91)
Housing and Community Development: $112,000 ($57.88)
Judicial and Legal Services: $43,000 ($22.22)
Natural Resources - Other: $30,000 ($15.50)
- General - Interest on Debt: $51,000 ($26.36)
- Intergovernmental to Local - Other - Water Utilities: $61,000 ($31.52)
Other - Police Protection: $55,000 ($28.42)
Other - Sewerage: $35,000 ($18.09)
Other - Judicial and Legal Services: $23,000 ($11.89)
Other - Local Fire Protection: $6,000 ($3.10)
Other - Central Staff Services: $2,000 ($1.03)
Other - Solid Waste Management: $1,000 ($0.52)
- Other Capital Outlay - Sewerage: $132,000 ($68.22)
Water Utilities: $20,000 ($10.34)
Health - Other: $13,000 ($6.72)
- Total Salaries and Wages: $653,000 ($337.47)
- Water Utilities - Interest on Debt: $40,000 ($20.67)
Coupeville government finances - Revenue in 2017 (per resident):
- Charges - Sewerage: $449,000 ($232.04)
Other: $90,000 ($46.51)
- Miscellaneous - Rents: $34,000 ($17.57)
Fines and Forfeits: $10,000 ($5.17)
General Revenue - Other: $7,000 ($3.62)
Interest Earnings: $0 ($0.00)
- Revenue - Water Utilities: $598,000 ($309.04)
- State Intergovernmental - Other: $413,000 ($213.44)
Highways: $199,000 ($102.84)
General Local Government Support: $25,000 ($12.92)
- Tax - General Sales and Gross Receipts: $596,000 ($308.01)
Property: $375,000 ($193.80)
Public Utilities Sales: $357,000 ($184.50)
Documentary and Stock Transfer: $62,000 ($32.04)
Other Selective Sales: $61,000 ($31.52)
Other License: $50,000 ($25.84)
Coupeville government finances - Debt in 2017 (per resident):
- Long Term Debt - Outstanding Unspecified Public Purpose: $2,715,000 ($1403.10)
Beginning Outstanding - Unspecified Public Purpose: $2,279,000 ($1177.78)
Issue, Unspecified Public Purpose: $579,000 ($299.22)
Retired Unspecified Public Purpose: $143,000 ($73.90)
Coupeville government finances - Cash and Securities in 2017 (per resident):
- Bond Funds - Cash and Securities: $51,000 ($26.36)
11.29% of this county's 2021 resident taxpayers lived in other counties in 2020 ($88,161 average adjusted gross income)
| Here: | 11.29% |
| Washington average: | 7.53% |
0.33% of residents moved from foreign countries ($1,599 average AGI)
Island County: 0.33% Washington average: 0.05%
Top counties from which taxpayers relocated into this county between 2020 and 2021:
| from King County, WA | |
| from Snohomish County, WA | |
| from Skagit County, WA |
10.92% of this county's 2020 resident taxpayers moved to other counties in 2021 ($72,348 average adjusted gross income)
| Here: | 10.92% |
| Washington average: | 7.40% |
0.23% of residents moved to foreign countries ($1,258 average AGI)
Island County: 0.23% Washington average: 0.04%
Top counties to which taxpayers relocated from this county between 2020 and 2021:
| to Snohomish County, WA | |
| to Skagit County, WA | |
| to King County, WA |
Businesses in Coupeville, WA
- FedEx: 1
- H&R Block: 1
Strongest AM radio stations in Coupeville:
- KAPS (660 AM; 10 kW; MOUNT VERNON, WA; Owner: VALLEY BROADCASTERS, INC.)
- KRKO (1380 AM; 50 kW; EVERETT, WA; Owner: S-R BROADCASTING, CO.)
- KKOL (1300 AM; 50 kW; SEATTLE, WA; Owner: INSPIRATION MEDIA, INC.)
- KIXI (880 AM; 50 kW; MERCER ISLAND/SEATTL, WA; Owner: BELLEVUE RADIO, INC.)
- KIRO (710 AM; 50 kW; SEATTLE, WA; Owner: ENTERCOM SEATTLE LICENSE, LLC)
- KGNW (820 AM; 50 kW; BURIEN-SEATTLE, WA; Owner: INSPIRATION MEDIA, INC.)
- KTTH (770 AM; 50 kW; SEATTLE, WA; Owner: ENTERCOM SEATTLE LICENSE, LLC)
- KRPI (1550 AM; 50 kW; FERNDALE, WA; Owner: BBC BROADCASTING, INC.)
- KOMO (1000 AM; 50 kW; SEATTLE, WA; Owner: FISHER BROADCASTING - SEATTLE RADIO, L.L.C.)
- KWDB (1110 AM; daytime; 0 kW; OAK HARBOR, WA; Owner: WEST BEACH BROADCASTING CORP.)
- KARI (550 AM; 25 kW; BLAINE, WA; Owner: WAY BROADCASTING, INC.)
- KYCW (1090 AM; 50 kW; SEATTLE, WA; Owner: INFINITY RADIO SUBSIDIARY OPERATIONS INC.)
- KJR (950 AM; 50 kW; SEATTLE, WA)
Strongest FM radio stations in Coupeville:
- KISM (92.9 FM; BELLINGHAM, WA; Owner: SAGA BROADCASTING, LLC)
- KWPZ (106.5 FM; LYNDEN, WA; Owner: CRISTA MINISTRIES, INC.)
- KAFE (104.3 FM; BELLINGHAM, WA; Owner: SAGA BROADCASTING, LLC)
- K206CU (89.1 FM; MOUNT VERNON, WA; Owner: CALVARY CHAPEL OF TWIN FALLS, INC.)
- KSVR (91.7 FM; MOUNT VERNON, WA; Owner: BOARD OF TRUSTEES OF SKAGIT VALLEY COLLEGE)
- KISW (99.9 FM; SEATTLE, WA; Owner: ENTERCOM SEATTLE LICENSE, LLC)
- KQBZ (100.7 FM; SEATTLE, WA; Owner: ENTERCOM SEATTLE LICENSE, LLC)
- KMTT (103.7 FM; TACOMA, WA; Owner: ENTERCOM SEATTLE LICENSE, LLC)
- KNDD (107.7 FM; SEATTLE, WA; Owner: ENTERCOM SEATTLE LICENSE, LLC)
- KCMS (105.3 FM; EDMONDS, WA; Owner: CRISTA MINISTRIES, INC.)
- KYPT (96.5 FM; SEATTLE, WA; Owner: INFINITY RADIO SUBSIDIARY OPERATIONS INC.)
- KBSG-FM (97.3 FM; TACOMA, WA; Owner: ENTERCOM SEATTLE LICENSE, LLC)
- KBKS (106.1 FM; TACOMA, WA; Owner: INFINITY RADIO SUBSIDIARY OPERATIONS INC.)
- KING-FM (98.1 FM; SEATTLE, WA; Owner: CLASSIC RADIO, INC.)
- KLSY-FM (92.5 FM; BELLEVUE, WA; Owner: BELLEVUE RADIO INC.)
- KPLU-FM (88.5 FM; TACOMA, WA; Owner: PACIFIC LUTHERAN UNIVERSITY, INC.)
- KWJZ (98.9 FM; SEATTLE, WA; Owner: ORCA RADIO, INC.)
- KZOK-FM (102.5 FM; SEATTLE, WA; Owner: INFINITY RADIO SUBSIDIARY OPERATIONS INC.)
- KMPS-FM (94.1 FM; SEATTLE, WA; Owner: INFINITY RADIO SUBSIDIARY OPERATIONS INC.)
- K205DL (88.9 FM; GRANITE FALLS/EVERET, WA; Owner: CALVARY CHAPEL OF TWIN FALLS, INC.)
TV broadcast stations around Coupeville:
- KBCB (Channel 24; BELLINGHAM, WA; Owner: WORLD TELEVISION OF WASHINGTON, LLC.)
- Coupeville, Washington
- Fatal accident count9
- Vehicles involved in fatal accidents13
- Fatal accidents involving drunk persons:3
- Fatalities9
- Persons involved in fatal accidents18
- Pedestrians involved in fatal accidents1
- Washington average
- Fatal accident count5514
- Vehicles involved in fatal accidents8065
- Fatal accidents involving drunk persons2551
- Fatalities6184
- Persons involved in fatal accidents14079
- Pedestrians involved in fatal accidents303
- National Bridge Inventory (NBI) Statistics
- 2Number of bridges
- 10ft / 3.2mTotal length
- $1,008,000Total costs
- 13,600Total average daily traffic
- 623Total average daily truck traffic
FCC Registered Antenna Towers:
42 (See the full list of FCC Registered Antenna Towers in Coupeville)FCC Registered Broadcast Land Mobile Towers:
7- Main St 1 Mi E Of Int Of Hwy 20 (Lat: 48.213722 Lon: -122.685167), Call Sign: WNJR437, Licensee ID: L00102587,
Assigned Frequencies: 453.025 MHz, Grant Date: 09/22/1997, Expiration Date: 11/12/2002, Cancellation Date: 02/16/2003, Registrant: Whidbey General Hospital, Coupeville, WA 98239, Phone: (206) 678-5151
- Lat: 48.213722 Lon: -122.684889, Call Sign: WPAS566,
Assigned Frequencies: 451.312 MHz, 451.762 MHz, 452.062 MHz, 452.137 MHz, 452.162 MHz, 464.862 MHz, Grant Date: 02/06/2013, Expiration Date: 09/25/2022, Cancellation Date: 11/26/2022, Registrant: Radio Licensing Services, 4700 Se International Way, Milwaukie, OR 97269, Phone: (503) 794-3761, Fax: (503) 794-3759, Email:
- Lat: 48.160111 Lon: -122.672139, Call Sign: WPTP540,
Assigned Frequencies: 451.750 MHz, 456.750 MHz, Grant Date: 10/13/2011, Expiration Date: 11/15/2021, Cancellation Date: 01/15/2022, Certifier: Thomas Asmus, Registrant: Bearcom Wireless Worldwide, 14940-G Ne 95th St., Redmond, WA 98052, Phone: (425) 895-8118, Fax: (425) 895-9119, Email:
- Lat: 48.184250 Lon: -122.695722, Call Sign: WQBH284,
Assigned Frequencies: 151.805 MHz, Grant Date: 10/05/2004, Expiration Date: 10/05/2014, Cancellation Date: 12/06/2014, Certifier: Robert Engle, Registrant: Radio Licensing Services, 4700 Se International Way, Milwaukie, OR 97222, Phone: (503) 794-3787, Fax: (503) 794-3759
- Lat: 48.250111 Lon: -122.731333, Call Sign: WQGT906,
Assigned Frequencies: 152.945 MHz, 153.050 MHz, 153.020 MHz, 153.455 MHz, 153.065 MHz, Grant Date: 04/16/2007, Expiration Date: 04/16/2017, Cancellation Date: 06/17/2017, Certifier: Roberta Piercy, Registrant: Whidbey Island Pony Club, 750 Snowberry Lane, Coupeville, WA 98239, Phone: (360) 929-3607, Email:
- Lat: 48.218778 Lon: -122.685444, Call Sign: WQYA571,
Assigned Frequencies: 452.637 MHz, 452.812 MHz, 452.987 MHz, 457.637 MHz, 457.987 MHz, Grant Date: 08/01/2016, Expiration Date: 08/01/2026, Certifier: William Larue, Registrant: Radio Licensing Services, 4700 Se International Way, Milwaukie, OR 97269, Phone: (503) 659-1240, Fax: (503) 794-3759, Email:
- Lat: 48.128611 Lon: -122.589444, Call Sign: WRVB728,
Assigned Frequencies: 458.050 MHz, 465.575 MHz, Grant Date: 10/29/2022, Expiration Date: 10/29/2032, Certifier: Jay E Schmierer, Registrant: State Of Washington, 2803 156th Ave Se, Bellevue, WA 98007, Phone: (425) 401-7800, Fax: (425) 401-7847, Email:
FCC Registered Microwave Towers:
4- EAST RACE RD, East Race Rd. (Lat: 48.193444 Lon: -122.604889), Type: Mast, Structure height: 31.2 m, Call Sign: WPQS575,
Assigned Frequencies: 6529.57 MHz, Grant Date: 09/20/2000, Expiration Date: 09/20/2010, Cancellation Date: 11/20/2010, Certifier: Kathy Mcclymont, Registrant: Day Wireless Systems Inc, 2301 38th Street, Everett, WA 98201, Phone: (425) 258-0554, Fax: (425) 258-2949, Email:
- SE72XC018, 1164 Race Road (Lat: 48.173194 Lon: -122.603500), Type: Mtower, Structure height: 27 m, Overall height: 29 m, Call Sign: WQRF423,
Assigned Frequencies: 23025.0 MHz, Grant Date: 05/01/2013, Expiration Date: 05/01/2023, Cancellation Date: 10/31/2014, Certifier: Kyle B Entz, Registrant: Sprint Nextel Corporation, 12502 Sunrise Valley Drive, Reston, VA 20196, Phone: (703) 433-4000, Fax: (703) 433-4483
- SE72XC018, 1164 Race Road (Lat: 48.173194 Lon: -122.603500), Type: Mtower, Structure height: 27 m, Overall height: 29 m, Call Sign: WQVG921,
Assigned Frequencies: 23025.0 MHz, Grant Date: 02/10/2015, Expiration Date: 02/10/2025, Cancellation Date: 07/29/2016, Certifier: Kyle B Entz, Registrant: Sprint Corporation, 12502 Sunrise Valley Drive, M/S: Varesa0209, Reston, VA 20196, Phone: (703) 433-4000, Fax: (703) 433-4483
- Lat: 48.382306 Lon: -122.608500, Overall height: 33.5 m, Call Sign: WLC427, Licensee ID: L00050824,
Assigned Frequencies: 6197.20 MHz, 6197.20 MHz, 6256.50 MHz, 6256.50 MHz, 6315.90 MHz, 6315.90 MHz, 6375.20 MHz, 6375.20 MHz, Grant Date: 02/27/2001, Expiration Date: 02/01/2011, Cancellation Date: 04/17/2007, Registrant: Sprint Communications Company, LP, 2001 Edmund Halley Drive, Reston, VA 20191, Phone: (703) 433-4000, Fax: (703) 433-4035
FCC Registered Amateur Radio Licenses:
188 (See the full list of FCC Registered Amateur Radio Licenses in Coupeville)FAA Registered Aircraft:
24 (See the full list of FAA Registered Aircraft in Coupeville)2002 - 2018 National Fire Incident Reporting System (NFIRS) incidents
- Fire incident types reported to NFIRS in Coupeville, WA
- 17936.1%Outside Fires
- 17435.1%Structure Fires
- 7615.3%Mobile Property/Vehicle Fires
- 6713.5%Other
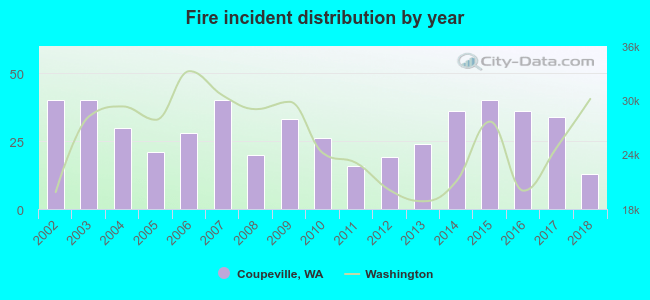 Based on the data from the years 2002 - 2018 the average number of fire incidents per year is 29. The highest number of reported fire incidents - 40 took place in 2002, and the least - 13 in 2018. The data has a dropping trend.
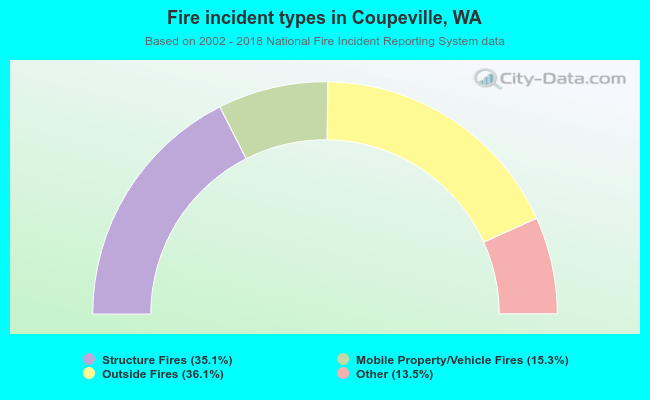 When looking into fire subcategories, the most incidents belonged to: Outside Fires (36.1%), and Structure Fires (35.1%).
| Most common first names in Coupeville, WA among deceased individuals | ||
| Name | Count | Lived (average) |
|---|---|---|
| John | 50 | 78.5 years |
| Robert | 44 | 76.2 years |
| William | 41 | 74.5 years |
| Charles | 29 | 74.2 years |
| George | 27 | 75.4 years |
| James | 26 | 74.5 years |
| Mary | 25 | 79.0 years |
| Richard | 25 | 73.3 years |
| Donald | 23 | 73.6 years |
| Dorothy | 20 | 82.7 years |
| Most common last names in Coupeville, WA among deceased individuals | ||
| Last name | Count | Lived (average) |
|---|---|---|
| Smith | 14 | 80.6 years |
| Williams | 12 | 77.9 years |
| White | 11 | 77.8 years |
| Anderson | 10 | 78.5 years |
| Miller | 9 | 82.6 years |
| Morris | 9 | 80.3 years |
| Bell | 8 | 85.3 years |
| Clark | 8 | 79.6 years |
| Brown | 8 | 75.3 years |
| Wright | 7 | 86.0 years |
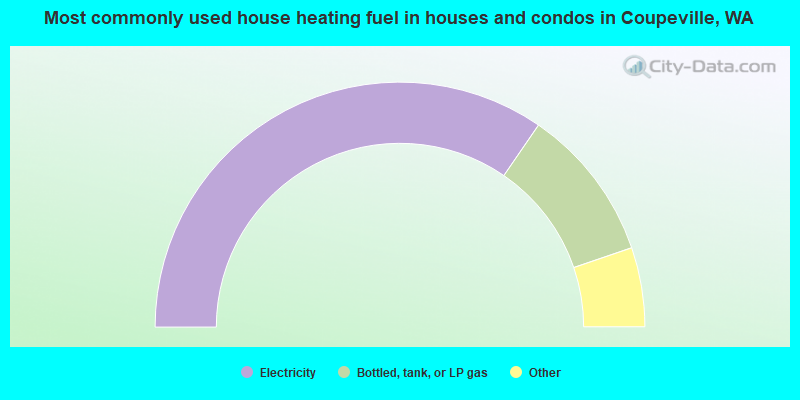
- 69.3%Electricity
- 20.4%Bottled, tank, or LP gas
- 3.8%Wood
- 2.5%Utility gas
- 2.3%Other fuel
- 1.8%Fuel oil, kerosene, etc.
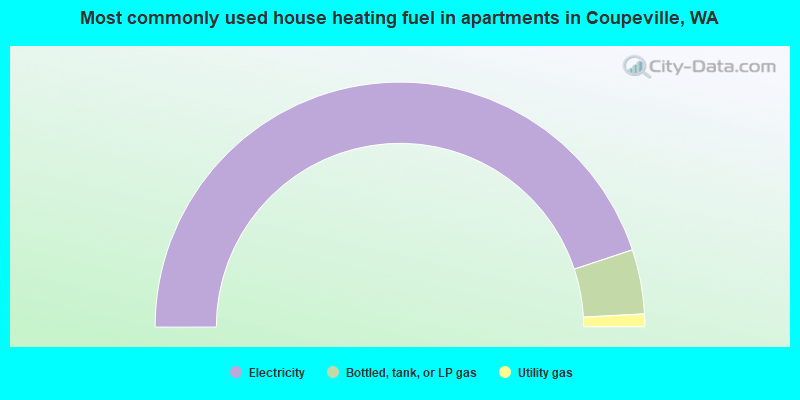
- 89.8%Electricity
- 8.5%Bottled, tank, or LP gas
- 1.7%Utility gas
Coupeville compared to Washington state average:
- Unemployed percentage below state average.
- Black race population percentage significantly below state average.
- Median age significantly above state average.
- Length of stay since moving in significantly above state average.
- Institutionalized population percentage significantly above state average.

|
|
Total of 35 patent applications in 2008-2024.