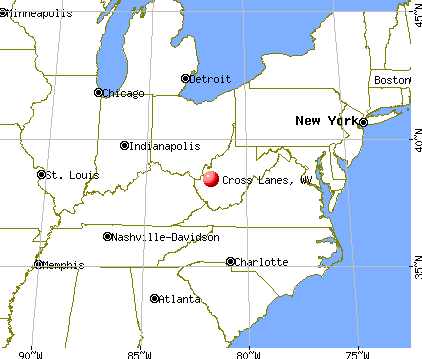
Cross Lanes, West Virginia Submit your own pictures of this place and show them to the world
OSM Map
General Map
Google Map
MSN Map
OSM Map
General Map
Google Map
MSN Map
OSM Map
General Map
Google Map
MSN Map
OSM Map
General Map
Google Map
MSN Map
Please wait while loading the map...
Population in 2010: 9,995. Population change since 2000: -3.5%Males: 4,889 Females: 5,106
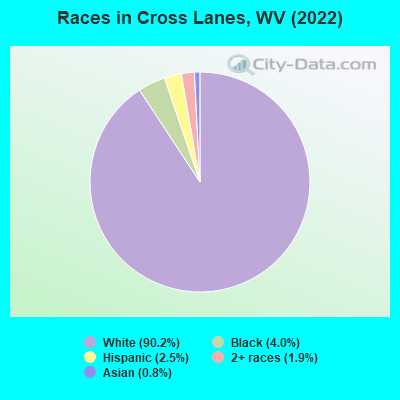
March 2022 cost of living index in Cross Lanes: 85.1 (less than average, U.S. average is 100) Percentage of residents living in poverty in 2022: 7.8%for White Non-Hispanic residents , 17.9% for Black residents , 9.4% for Hispanic or Latino residents , 18.3% for two or more races residents )
Profiles of local businesses
Business Search - 14 Million verified businesses
Data:
Median household income ($)
Median household income (% change since 2000)
Household income diversity
Ratio of average income to average house value (%)
Ratio of average income to average rent
Median household income ($) - White
Median household income ($) - Black or African American
Median household income ($) - Asian
Median household income ($) - Hispanic or Latino
Median household income ($) - American Indian and Alaska Native
Median household income ($) - Multirace
Median household income ($) - Other Race
Median household income for houses/condos with a mortgage ($)
Median household income for apartments without a mortgage ($)
Races - White alone (%)
Races - White alone (% change since 2000)
Races - Black alone (%)
Races - Black alone (% change since 2000)
Races - American Indian alone (%)
Races - American Indian alone (% change since 2000)
Races - Asian alone (%)
Races - Asian alone (% change since 2000)
Races - Hispanic (%)
Races - Hispanic (% change since 2000)
Races - Native Hawaiian and Other Pacific Islander alone (%)
Races - Native Hawaiian and Other Pacific Islander alone (% change since 2000)
Races - Two or more races (%)
Races - Two or more races (% change since 2000)
Races - Other race alone (%)
Races - Other race alone (% change since 2000)
Racial diversity
Unemployment (%)
Unemployment (% change since 2000)
Unemployment (%) - White
Unemployment (%) - Black or African American
Unemployment (%) - Asian
Unemployment (%) - Hispanic or Latino
Unemployment (%) - American Indian and Alaska Native
Unemployment (%) - Multirace
Unemployment (%) - Other Race
Population density (people per square mile)
Population - Males (%)
Population - Females (%)
Population - Males (%) - White
Population - Males (%) - Black or African American
Population - Males (%) - Asian
Population - Males (%) - Hispanic or Latino
Population - Males (%) - American Indian and Alaska Native
Population - Males (%) - Multirace
Population - Males (%) - Other Race
Population - Females (%) - White
Population - Females (%) - Black or African American
Population - Females (%) - Asian
Population - Females (%) - Hispanic or Latino
Population - Females (%) - American Indian and Alaska Native
Population - Females (%) - Multirace
Population - Females (%) - Other Race
Coronavirus confirmed cases (Jun 10, 2024)
Deaths caused by coronavirus (Jun 10, 2024)
Coronavirus confirmed cases (per 100k population) (Jun 10, 2024)
Deaths caused by coronavirus (per 100k population) (Jun 10, 2024)
Daily increase in number of cases (Jun 10, 2024)
Weekly increase in number of cases (Jun 10, 2024)
Cases doubled (in days) (Jun 10, 2024)
Hospitalized patients (Apr 18, 2022)
Negative test results (Apr 18, 2022)
Total test results (Apr 18, 2022)
COVID Vaccine doses distributed (per 100k population) (Sep 19, 2023)
COVID Vaccine doses administered (per 100k population) (Sep 19, 2023)
COVID Vaccine doses distributed (Sep 19, 2023)
COVID Vaccine doses administered (Sep 19, 2023)
Likely homosexual households (%)
Likely homosexual households (% change since 2000)
Likely homosexual households - Lesbian couples (%)
Likely homosexual households - Lesbian couples (% change since 2000)
Likely homosexual households - Gay men (%)
Likely homosexual households - Gay men (% change since 2000)
Cost of living index
Median gross rent ($)
Median contract rent ($)
Median monthly housing costs ($)
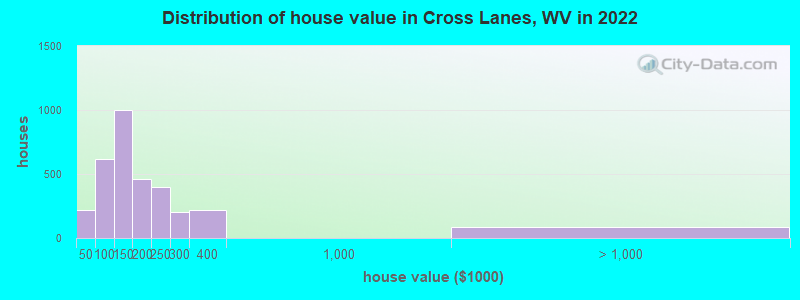
Median house or condo value ($)
Median house or condo value ($ change since 2000)
Mean house or condo value by units in structure - 1, detached ($)
Mean house or condo value by units in structure - 1, attached ($)
Mean house or condo value by units in structure - 2 ($)
Mean house or condo value by units in structure by units in structure - 3 or 4 ($)
Mean house or condo value by units in structure - 5 or more ($)
Mean house or condo value by units in structure - Boat, RV, van, etc. ($)
Mean house or condo value by units in structure - Mobile home ($)
Median house or condo value ($) - White
Median house or condo value ($) - Black or African American
Median house or condo value ($) - Asian
Median house or condo value ($) - Hispanic or Latino
Median house or condo value ($) - American Indian and Alaska Native
Median house or condo value ($) - Multirace
Median house or condo value ($) - Other Race
Median resident age
Resident age diversity
Median resident age - Males
Median resident age - Females
Median resident age - White
Median resident age - Black or African American
Median resident age - Asian
Median resident age - Hispanic or Latino
Median resident age - American Indian and Alaska Native
Median resident age - Multirace
Median resident age - Other Race
Median resident age - Males - White
Median resident age - Males - Black or African American
Median resident age - Males - Asian
Median resident age - Males - Hispanic or Latino
Median resident age - Males - American Indian and Alaska Native
Median resident age - Males - Multirace
Median resident age - Males - Other Race
Median resident age - Females - White
Median resident age - Females - Black or African American
Median resident age - Females - Asian
Median resident age - Females - Hispanic or Latino
Median resident age - Females - American Indian and Alaska Native
Median resident age - Females - Multirace
Median resident age - Females - Other Race
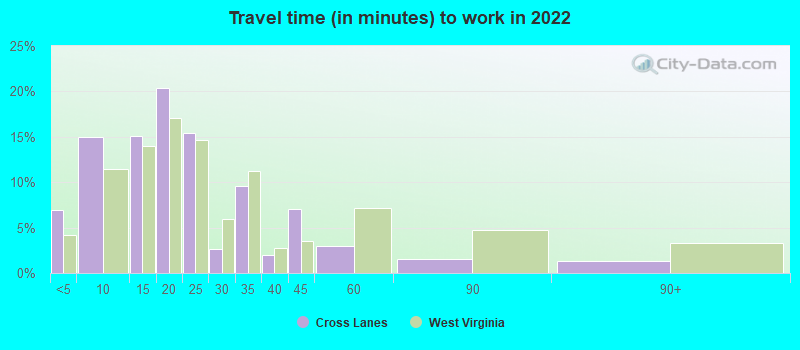
Commute - mean travel time to work (minutes)
Travel time to work - Less than 5 minutes (%)
Travel time to work - Less than 5 minutes (% change since 2000)
Travel time to work - 5 to 9 minutes (%)
Travel time to work - 5 to 9 minutes (% change since 2000)
Travel time to work - 10 to 19 minutes (%)
Travel time to work - 10 to 19 minutes (% change since 2000)
Travel time to work - 20 to 29 minutes (%)
Travel time to work - 20 to 29 minutes (% change since 2000)
Travel time to work - 30 to 39 minutes (%)
Travel time to work - 30 to 39 minutes (% change since 2000)
Travel time to work - 40 to 59 minutes (%)
Travel time to work - 40 to 59 minutes (% change since 2000)
Travel time to work - 60 to 89 minutes (%)
Travel time to work - 60 to 89 minutes (% change since 2000)
Travel time to work - 90 or more minutes (%)
Travel time to work - 90 or more minutes (% change since 2000)
Marital status - Never married (%)
Marital status - Now married (%)
Marital status - Separated (%)
Marital status - Widowed (%)
Marital status - Divorced (%)
Median family income ($)
Median family income (% change since 2000)
Median non-family income ($)
Median non-family income (% change since 2000)
Median per capita income ($)
Median per capita income (% change since 2000)
Median family income ($) - White
Median family income ($) - Black or African American
Median family income ($) - Asian
Median family income ($) - Hispanic or Latino
Median family income ($) - American Indian and Alaska Native
Median family income ($) - Multirace
Median family income ($) - Other Race
Median year house/condo built
Median year apartment built
Year house built - Built 2005 or later (%)
Year house built - Built 2000 to 2004 (%)
Year house built - Built 1990 to 1999 (%)
Year house built - Built 1980 to 1989 (%)
Year house built - Built 1970 to 1979 (%)
Year house built - Built 1960 to 1969 (%)
Year house built - Built 1950 to 1959 (%)
Year house built - Built 1940 to 1949 (%)
Year house built - Built 1939 or earlier (%)
Average household size
Household density (households per square mile)
Average household size - White
Average household size - Black or African American
Average household size - Asian
Average household size - Hispanic or Latino
Average household size - American Indian and Alaska Native
Average household size - Multirace
Average household size - Other Race
Occupied housing units (%)
Vacant housing units (%)
Owner occupied housing units (%)
Renter occupied housing units (%)
Vacancy status - For rent (%)
Vacancy status - For sale only (%)
Vacancy status - Rented or sold, not occupied (%)
Vacancy status - For seasonal, recreational, or occasional use (%)
Vacancy status - For migrant workers (%)
Vacancy status - Other vacant (%)
Residents with income below the poverty level (%)
Residents with income below 50% of the poverty level (%)
Children below poverty level (%)
Poor families by family type - Married-couple family (%)
Poor families by family type - Male, no wife present (%)
Poor families by family type - Female, no husband present (%)
Poverty status for native-born residents (%)
Poverty status for foreign-born residents (%)
Poverty among high school graduates not in families (%)
Poverty among people who did not graduate high school not in families (%)
Residents with income below the poverty level (%) - White
Residents with income below the poverty level (%) - Black or African American
Residents with income below the poverty level (%) - Asian
Residents with income below the poverty level (%) - Hispanic or Latino
Residents with income below the poverty level (%) - American Indian and Alaska Native
Residents with income below the poverty level (%) - Multirace
Residents with income below the poverty level (%) - Other Race
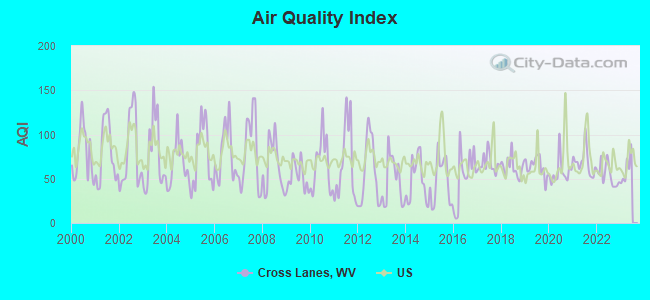
Air pollution - Air Quality Index (AQI)
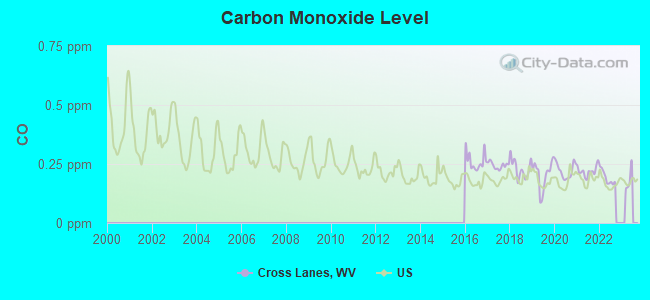
Air pollution - CO
Air pollution - NO2
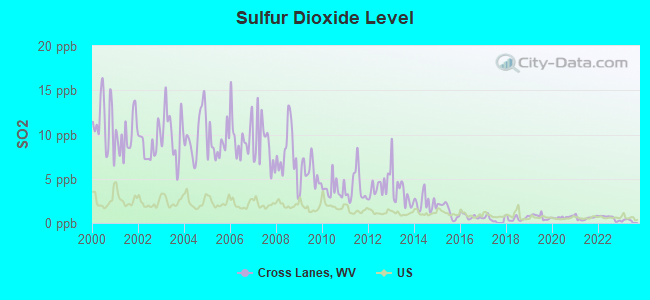
Air pollution - SO2
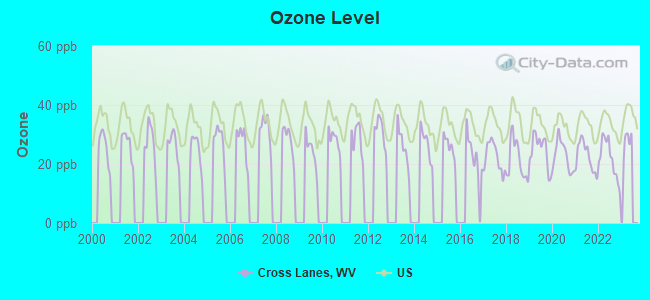
Air pollution - Ozone
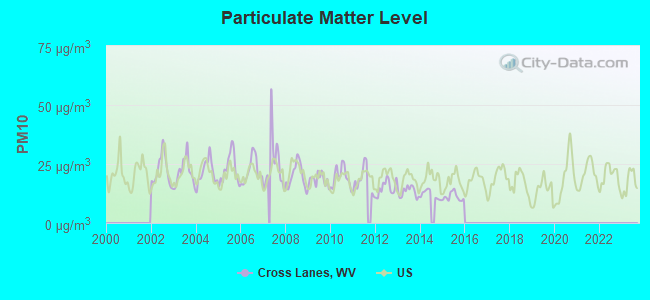
Air pollution - PM10
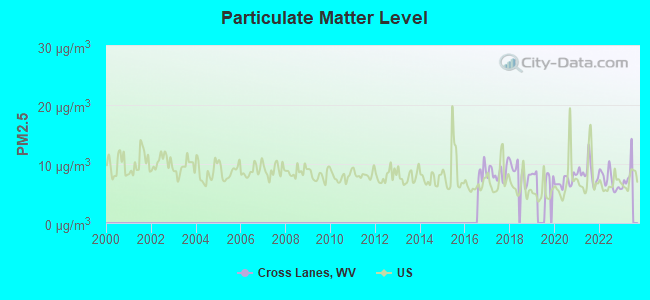
Air pollution - PM25
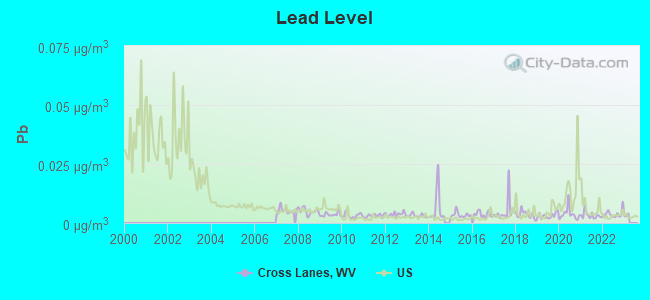
Air pollution - Pb
Crime - Murders per 100,000 population
Crime - Rapes per 100,000 population
Crime - Robberies per 100,000 population
Crime - Assaults per 100,000 population
Crime - Burglaries per 100,000 population
Crime - Thefts per 100,000 population
Crime - Auto thefts per 100,000 population
Crime - Arson per 100,000 population
Crime - City-data.com crime index
Crime - Violent crime index
Crime - Property crime index
Crime - Murders per 100,000 population (5 year average)
Crime - Rapes per 100,000 population (5 year average)
Crime - Robberies per 100,000 population (5 year average)
Crime - Assaults per 100,000 population (5 year average)
Crime - Burglaries per 100,000 population (5 year average)
Crime - Thefts per 100,000 population (5 year average)
Crime - Auto thefts per 100,000 population (5 year average)
Crime - Arson per 100,000 population (5 year average)
Crime - City-data.com crime index (5 year average)
Crime - Violent crime index (5 year average)
Crime - Property crime index (5 year average)
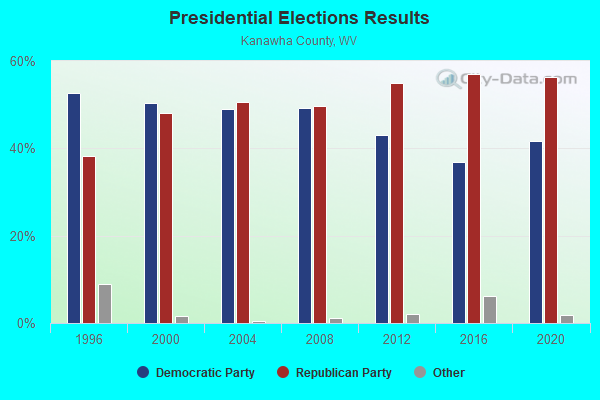
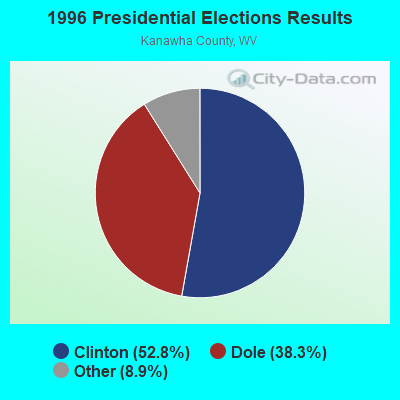
1996 Presidential Elections Results (%) - Democratic Party (Clinton)
1996 Presidential Elections Results (%) - Republican Party (Dole)
1996 Presidential Elections Results (%) - Other
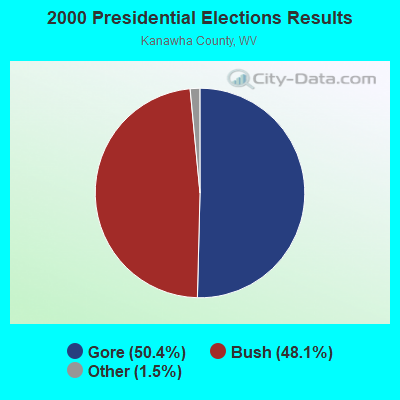
2000 Presidential Elections Results (%) - Democratic Party (Gore)
2000 Presidential Elections Results (%) - Republican Party (Bush)
2000 Presidential Elections Results (%) - Other
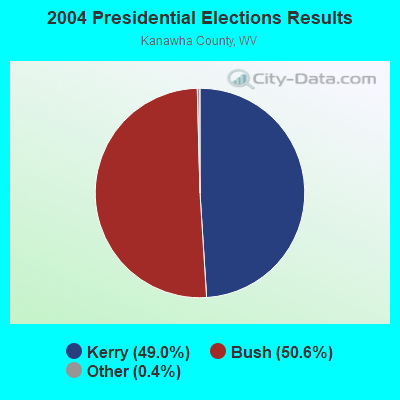
2004 Presidential Elections Results (%) - Democratic Party (Kerry)
2004 Presidential Elections Results (%) - Republican Party (Bush)
2004 Presidential Elections Results (%) - Other
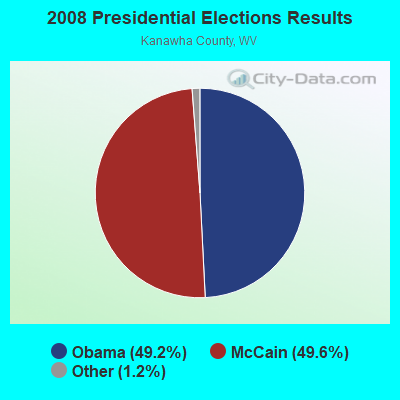
2008 Presidential Elections Results (%) - Democratic Party (Obama)
2008 Presidential Elections Results (%) - Republican Party (McCain)
2008 Presidential Elections Results (%) - Other
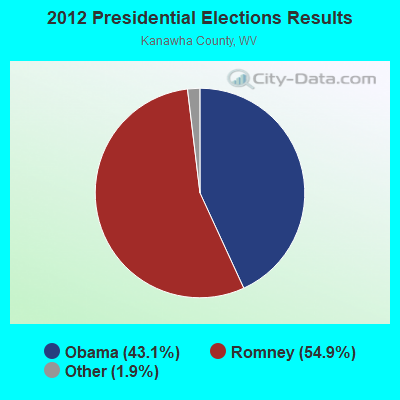
2012 Presidential Elections Results (%) - Democratic Party (Obama)
2012 Presidential Elections Results (%) - Republican Party (Romney)
2012 Presidential Elections Results (%) - Other
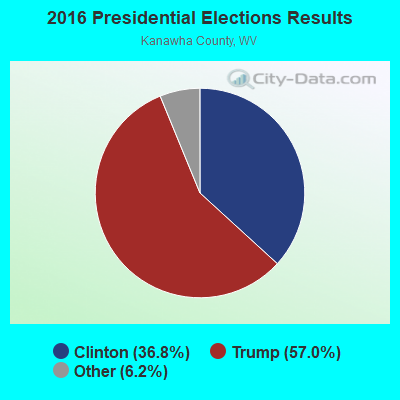
2016 Presidential Elections Results (%) - Democratic Party (Clinton)
2016 Presidential Elections Results (%) - Republican Party (Trump)
2016 Presidential Elections Results (%) - Other
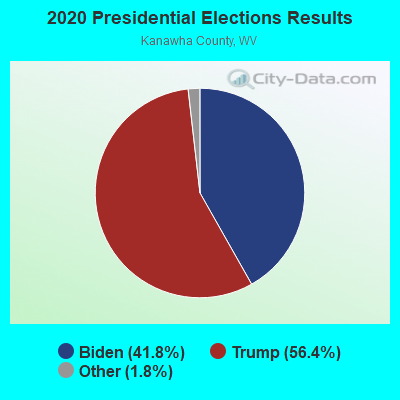
2020 Presidential Elections Results (%) - Democratic Party (Biden)
2020 Presidential Elections Results (%) - Republican Party (Trump)
2020 Presidential Elections Results (%) - Other
Ancestries Reported - Arab (%)
Ancestries Reported - Czech (%)
Ancestries Reported - Danish (%)
Ancestries Reported - Dutch (%)
Ancestries Reported - English (%)
Ancestries Reported - French (%)
Ancestries Reported - French Canadian (%)
Ancestries Reported - German (%)
Ancestries Reported - Greek (%)
Ancestries Reported - Hungarian (%)
Ancestries Reported - Irish (%)
Ancestries Reported - Italian (%)
Ancestries Reported - Lithuanian (%)
Ancestries Reported - Norwegian (%)
Ancestries Reported - Polish (%)
Ancestries Reported - Portuguese (%)
Ancestries Reported - Russian (%)
Ancestries Reported - Scotch-Irish (%)
Ancestries Reported - Scottish (%)
Ancestries Reported - Slovak (%)
Ancestries Reported - Subsaharan African (%)
Ancestries Reported - Swedish (%)
Ancestries Reported - Swiss (%)
Ancestries Reported - Ukrainian (%)
Ancestries Reported - United States (%)
Ancestries Reported - Welsh (%)
Ancestries Reported - West Indian (%)
Ancestries Reported - Other (%)
Educational Attainment - No schooling completed (%)
Educational Attainment - Less than high school (%)
Educational Attainment - High school or equivalent (%)
Educational Attainment - Less than 1 year of college (%)
Educational Attainment - 1 or more years of college (%)
Educational Attainment - Associate degree (%)
Educational Attainment - Bachelor's degree (%)
Educational Attainment - Master's degree (%)
Educational Attainment - Professional school degree (%)
Educational Attainment - Doctorate degree (%)
School Enrollment - Nursery, preschool (%)
School Enrollment - Kindergarten (%)
School Enrollment - Grade 1 to 4 (%)
School Enrollment - Grade 5 to 8 (%)
School Enrollment - Grade 9 to 12 (%)
School Enrollment - College undergrad (%)
School Enrollment - Graduate or professional (%)
School Enrollment - Not enrolled in school (%)
School enrollment - Public schools (%)
School enrollment - Private schools (%)
School enrollment - Not enrolled (%)
Median number of rooms in houses and condos
Median number of rooms in apartments
Housing units lacking complete plumbing facilities (%)
Housing units lacking complete kitchen facilities (%)
Density of houses
Urban houses (%)
Rural houses (%)
Households with people 60 years and over (%)
Households with people 65 years and over (%)
Households with people 75 years and over (%)
Households with one or more nonrelatives (%)
Households with no nonrelatives (%)
Population in households (%)
Family households (%)
Nonfamily households (%)
Population in families (%)
Family households with own children (%)
Median number of bedrooms in owner occupied houses
Mean number of bedrooms in owner occupied houses
Median number of bedrooms in renter occupied houses
Mean number of bedrooms in renter occupied houses
Median number of vehichles in owner occupied houses
Mean number of vehichles in owner occupied houses
Median number of vehichles in renter occupied houses
Mean number of vehichles in renter occupied houses
Mortgage status - with mortgage (%)
Mortgage status - with second mortgage (%)
Mortgage status - with home equity loan (%)
Mortgage status - with both second mortgage and home equity loan (%)
Mortgage status - without a mortgage (%)
Average family size
Average family size - White
Average family size - Black or African American
Average family size - Asian
Average family size - Hispanic or Latino
Average family size - American Indian and Alaska Native
Average family size - Multirace
Average family size - Other Race
Geographical mobility - Same house 1 year ago (%)
Geographical mobility - Moved within same county (%)
Geographical mobility - Moved from different county within same state (%)
Geographical mobility - Moved from different state (%)
Geographical mobility - Moved from abroad (%)
Place of birth - Born in state of residence (%)
Place of birth - Born in other state (%)
Place of birth - Native, outside of US (%)
Place of birth - Foreign born (%)
Housing units in structures - 1, detached (%)
Housing units in structures - 1, attached (%)
Housing units in structures - 2 (%)
Housing units in structures - 3 or 4 (%)
Housing units in structures - 5 to 9 (%)
Housing units in structures - 10 to 19 (%)
Housing units in structures - 20 to 49 (%)
Housing units in structures - 50 or more (%)
Housing units in structures - Mobile home (%)
Housing units in structures - Boat, RV, van, etc. (%)
House/condo owner moved in on average (years ago)
Renter moved in on average (years ago)
Year householder moved into unit - Moved in 1999 to March 2000 (%)
Year householder moved into unit - Moved in 1995 to 1998 (%)
Year householder moved into unit - Moved in 1990 to 1994 (%)
Year householder moved into unit - Moved in 1980 to 1989 (%)
Year householder moved into unit - Moved in 1970 to 1979 (%)
Year householder moved into unit - Moved in 1969 or earlier (%)
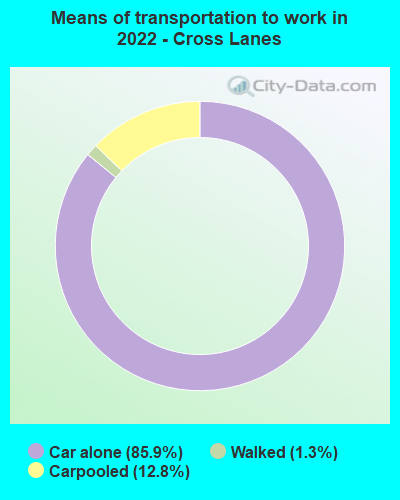
Means of transportation to work - Drove car alone (%)
Means of transportation to work - Carpooled (%)
Means of transportation to work - Public transportation (%)
Means of transportation to work - Bus or trolley bus (%)
Means of transportation to work - Streetcar or trolley car (%)
Means of transportation to work - Subway or elevated (%)
Means of transportation to work - Railroad (%)
Means of transportation to work - Ferryboat (%)
Means of transportation to work - Taxicab (%)
Means of transportation to work - Motorcycle (%)
Means of transportation to work - Bicycle (%)
Means of transportation to work - Walked (%)
Means of transportation to work - Other means (%)
Working at home (%)
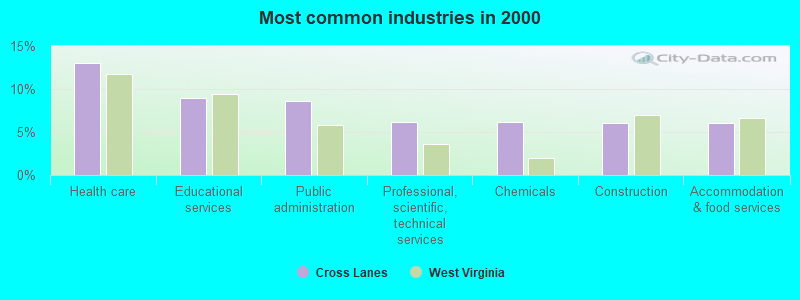
Industry diversity
Most Common Industries - Agriculture, forestry, fishing and hunting, and mining (%)
Most Common Industries - Agriculture, forestry, fishing and hunting (%)
Most Common Industries - Mining, quarrying, and oil and gas extraction (%)
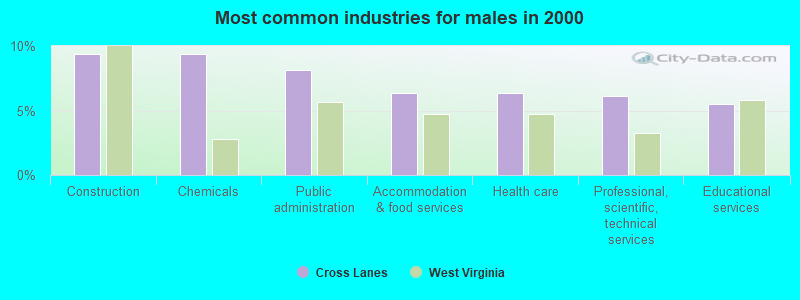
Most Common Industries - Construction (%)
Most Common Industries - Manufacturing (%)
Most Common Industries - Wholesale trade (%)
Most Common Industries - Retail trade (%)
Most Common Industries - Transportation and warehousing, and utilities (%)
Most Common Industries - Transportation and warehousing (%)
Most Common Industries - Utilities (%)
Most Common Industries - Information (%)
Most Common Industries - Finance and insurance, and real estate and rental and leasing (%)
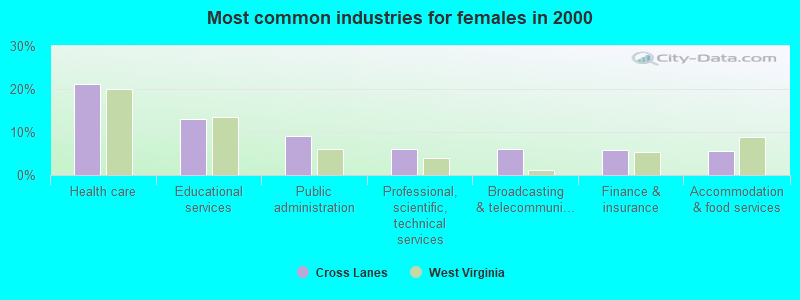
Most Common Industries - Finance and insurance (%)
Most Common Industries - Real estate and rental and leasing (%)
Most Common Industries - Professional, scientific, and management, and administrative and waste management services (%)
Most Common Industries - Professional, scientific, and technical services (%)
Most Common Industries - Management of companies and enterprises (%)
Most Common Industries - Administrative and support and waste management services (%)
Most Common Industries - Educational services, and health care and social assistance (%)
Most Common Industries - Educational services (%)
Most Common Industries - Health care and social assistance (%)
Most Common Industries - Arts, entertainment, and recreation, and accommodation and food services (%)
Most Common Industries - Arts, entertainment, and recreation (%)
Most Common Industries - Accommodation and food services (%)
Most Common Industries - Other services, except public administration (%)
Most Common Industries - Public administration (%)
Occupation diversity
Most Common Occupations - Management, business, science, and arts occupations (%)
Most Common Occupations - Management, business, and financial occupations (%)
Most Common Occupations - Management occupations (%)
Most Common Occupations - Business and financial operations occupations (%)
Most Common Occupations - Computer, engineering, and science occupations (%)
Most Common Occupations - Computer and mathematical occupations (%)
Most Common Occupations - Architecture and engineering occupations (%)
Most Common Occupations - Life, physical, and social science occupations (%)
Most Common Occupations - Education, legal, community service, arts, and media occupations (%)
Most Common Occupations - Community and social service occupations (%)
Most Common Occupations - Legal occupations (%)
Most Common Occupations - Education, training, and library occupations (%)
Most Common Occupations - Arts, design, entertainment, sports, and media occupations (%)
Most Common Occupations - Healthcare practitioners and technical occupations (%)
Most Common Occupations - Health diagnosing and treating practitioners and other technical occupations (%)
Most Common Occupations - Health technologists and technicians (%)
Most Common Occupations - Service occupations (%)
Most Common Occupations - Healthcare support occupations (%)
Most Common Occupations - Protective service occupations (%)
Most Common Occupations - Fire fighting and prevention, and other protective service workers including supervisors (%)
Most Common Occupations - Law enforcement workers including supervisors (%)
Most Common Occupations - Food preparation and serving related occupations (%)
Most Common Occupations - Building and grounds cleaning and maintenance occupations (%)
Most Common Occupations - Personal care and service occupations (%)
Most Common Occupations - Sales and office occupations (%)
Most Common Occupations - Sales and related occupations (%)
Most Common Occupations - Office and administrative support occupations (%)
Most Common Occupations - Natural resources, construction, and maintenance occupations (%)
Most Common Occupations - Farming, fishing, and forestry occupations (%)
Most Common Occupations - Construction and extraction occupations (%)
Most Common Occupations - Installation, maintenance, and repair occupations (%)
Most Common Occupations - Production, transportation, and material moving occupations (%)
Most Common Occupations - Production occupations (%)
Most Common Occupations - Transportation occupations (%)
Most Common Occupations - Material moving occupations (%)
People in Group quarters - Institutionalized population (%)
People in Group quarters - Correctional institutions (%)
People in Group quarters - Federal prisons and detention centers (%)
People in Group quarters - Halfway houses (%)
People in Group quarters - Local jails and other confinement facilities (including police lockups) (%)
People in Group quarters - Military disciplinary barracks (%)
People in Group quarters - State prisons (%)
People in Group quarters - Other types of correctional institutions (%)
People in Group quarters - Nursing homes (%)
People in Group quarters - Hospitals/wards, hospices, and schools for the handicapped (%)
People in Group quarters - Hospitals/wards and hospices for chronically ill (%)
People in Group quarters - Hospices or homes for chronically ill (%)
People in Group quarters - Military hospitals or wards for chronically ill (%)
People in Group quarters - Other hospitals or wards for chronically ill (%)
People in Group quarters - Hospitals or wards for drug/alcohol abuse (%)
People in Group quarters - Mental (Psychiatric) hospitals or wards (%)
People in Group quarters - Schools, hospitals, or wards for the mentally retarded (%)
People in Group quarters - Schools, hospitals, or wards for the physically handicapped (%)
People in Group quarters - Institutions for the deaf (%)
People in Group quarters - Institutions for the blind (%)
People in Group quarters - Orthopedic wards and institutions for the physically handicapped (%)
People in Group quarters - Wards in general hospitals for patients who have no usual home elsewhere (%)
People in Group quarters - Wards in military hospitals for patients who have no usual home elsewhere (%)
People in Group quarters - Juvenile institutions (%)
People in Group quarters - Long-term care (%)
People in Group quarters - Homes for abused, dependent, and neglected children (%)
People in Group quarters - Residential treatment centers for emotionally disturbed children (%)
People in Group quarters - Training schools for juvenile delinquents (%)
People in Group quarters - Short-term care, detention or diagnostic centers for delinquent children (%)
People in Group quarters - Type of juvenile institution unknown (%)
People in Group quarters - Noninstitutionalized population (%)
People in Group quarters - College dormitories (includes college quarters off campus) (%)
People in Group quarters - Military quarters (%)
People in Group quarters - On base (%)
People in Group quarters - Barracks, unaccompanied personnel housing (UPH), (Enlisted/Officer), ;and similar group living quarters for military personnel (%)
People in Group quarters - Transient quarters for temporary residents (%)
People in Group quarters - Military ships (%)
People in Group quarters - Group homes (%)
People in Group quarters - Homes or halfway houses for drug/alcohol abuse (%)
People in Group quarters - Homes for the mentally ill (%)
People in Group quarters - Homes for the mentally retarded (%)
People in Group quarters - Homes for the physically handicapped (%)
People in Group quarters - Other group homes (%)
People in Group quarters - Religious group quarters (%)
People in Group quarters - Dormitories (%)
People in Group quarters - Agriculture workers' dormitories on farms (%)
People in Group quarters - Job Corps and vocational training facilities (%)
People in Group quarters - Other workers' dormitories (%)
People in Group quarters - Crews of maritime vessels (%)
People in Group quarters - Other nonhousehold living situations (%)
People in Group quarters - Other noninstitutional group quarters (%)
Residents speaking English at home (%)
Residents speaking English at home - Born in the United States (%)
Residents speaking English at home - Native, born elsewhere (%)
Residents speaking English at home - Foreign born (%)
Residents speaking Spanish at home (%)
Residents speaking Spanish at home - Born in the United States (%)
Residents speaking Spanish at home - Native, born elsewhere (%)
Residents speaking Spanish at home - Foreign born (%)
Residents speaking other language at home (%)
Residents speaking other language at home - Born in the United States (%)
Residents speaking other language at home - Native, born elsewhere (%)
Residents speaking other language at home - Foreign born (%)
Class of Workers - Employee of private company (%)
Class of Workers - Self-employed in own incorporated business (%)
Class of Workers - Private not-for-profit wage and salary workers (%)
Class of Workers - Local government workers (%)
Class of Workers - State government workers (%)
Class of Workers - Federal government workers (%)
Class of Workers - Self-employed workers in own not incorporated business and Unpaid family workers (%)
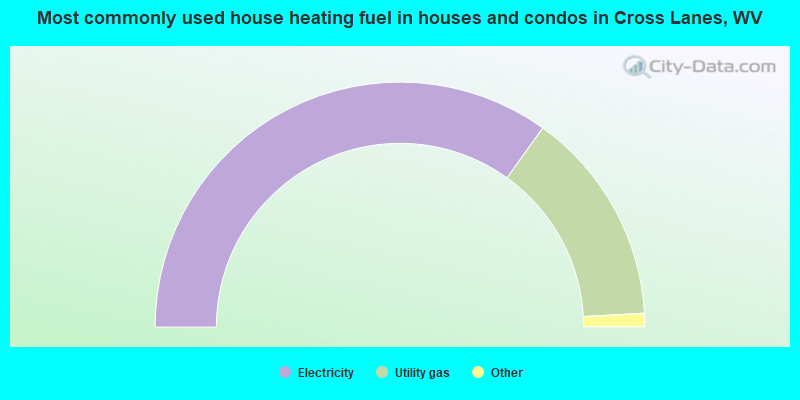
House heating fuel used in houses and condos - Utility gas (%)
House heating fuel used in houses and condos - Bottled, tank, or LP gas (%)
House heating fuel used in houses and condos - Electricity (%)
House heating fuel used in houses and condos - Fuel oil, kerosene, etc. (%)
House heating fuel used in houses and condos - Coal or coke (%)
House heating fuel used in houses and condos - Wood (%)
House heating fuel used in houses and condos - Solar energy (%)
House heating fuel used in houses and condos - Other fuel (%)
House heating fuel used in houses and condos - No fuel used (%)
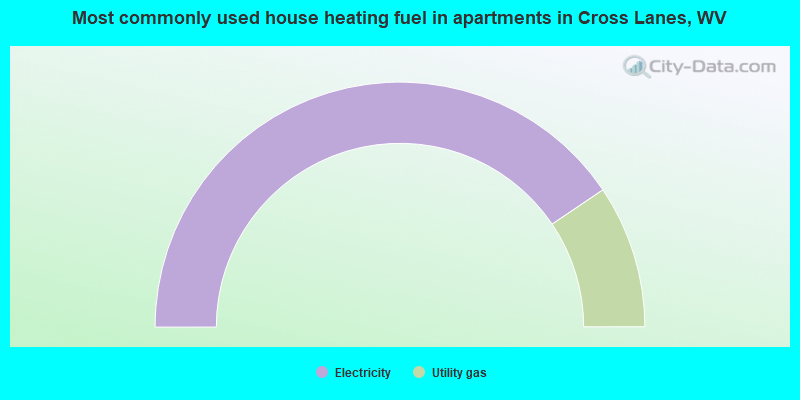
House heating fuel used in apartments - Utility gas (%)
House heating fuel used in apartments - Bottled, tank, or LP gas (%)
House heating fuel used in apartments - Electricity (%)
House heating fuel used in apartments - Fuel oil, kerosene, etc. (%)
House heating fuel used in apartments - Coal or coke (%)
House heating fuel used in apartments - Wood (%)
House heating fuel used in apartments - Solar energy (%)
House heating fuel used in apartments - Other fuel (%)
House heating fuel used in apartments - No fuel used (%)
Armed forces status - In Armed Forces (%)
Armed forces status - Civilian (%)
Armed forces status - Civilian - Veteran (%)
Armed forces status - Civilian - Nonveteran (%)
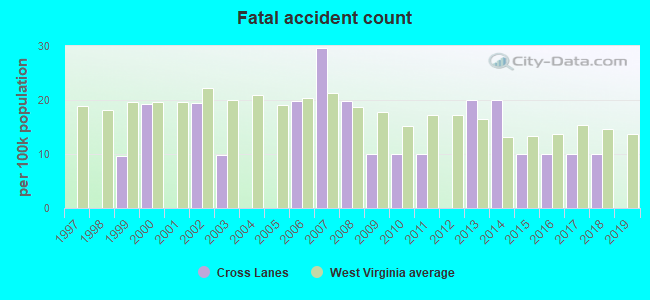
Fatal accidents locations in years 2005-2021
Fatal accidents locations in 2005
Fatal accidents locations in 2006
Fatal accidents locations in 2007
Fatal accidents locations in 2008
Fatal accidents locations in 2009
Fatal accidents locations in 2010
Fatal accidents locations in 2011
Fatal accidents locations in 2012
Fatal accidents locations in 2013
Fatal accidents locations in 2014
Fatal accidents locations in 2015
Fatal accidents locations in 2016
Fatal accidents locations in 2017
Fatal accidents locations in 2018
Fatal accidents locations in 2019
Fatal accidents locations in 2020
Fatal accidents locations in 2021
Alcohol use - People drinking some alcohol every month (%)
Alcohol use - People not drinking at all (%)
Alcohol use - Average days/month drinking alcohol
Alcohol use - Average drinks/week
Alcohol use - Average days/year people drink much
Audiometry - Average condition of hearing (%)
Audiometry - People that can hear a whisper from across a quiet room (%)
Audiometry - People that can hear normal voice from across a quiet room (%)
Audiometry - Ears ringing, roaring, buzzing (%)
Audiometry - Had a job exposure to loud noise (%)
Audiometry - Had off-work exposure to loud noise (%)
Blood Pressure & Cholesterol - Has high blood pressure (%)
Blood Pressure & Cholesterol - Checking blood pressure at home (%)
Blood Pressure & Cholesterol - Frequently checking blood cholesterol (%)
Blood Pressure & Cholesterol - Has high cholesterol level (%)
Consumer Behavior - Money monthly spent on food at supermarket/grocery store
Consumer Behavior - Money monthly spent on food at other stores
Consumer Behavior - Money monthly spent on eating out
Consumer Behavior - Money monthly spent on carryout/delivered foods
Consumer Behavior - Income spent on food at supermarket/grocery store (%)
Consumer Behavior - Income spent on food at other stores (%)
Consumer Behavior - Income spent on eating out (%)
Consumer Behavior - Income spent on carryout/delivered foods (%)
Current Health Status - General health condition (%)
Current Health Status - Blood donors (%)
Current Health Status - Has blood ever tested for HIV virus (%)
Current Health Status - Left-handed people (%)
Dermatology - People using sunscreen (%)
Diabetes - Diabetics (%)
Diabetes - Had a blood test for high blood sugar (%)
Diabetes - People taking insulin (%)
Diet Behavior & Nutrition - Diet health (%)
Diet Behavior & Nutrition - Milk product consumption (# of products/month)
Diet Behavior & Nutrition - Meals not home prepared (#/week)
Diet Behavior & Nutrition - Meals from fast food or pizza place (#/week)
Diet Behavior & Nutrition - Ready-to-eat foods (#/month)
Diet Behavior & Nutrition - Frozen meals/pizza (#/month)
Drug Use - People that ever used marijuana or hashish (%)
Drug Use - Ever used hard drugs (%)
Drug Use - Ever used any form of cocaine (%)
Drug Use - Ever used heroin (%)
Drug Use - Ever used methamphetamine (%)
Health Insurance - People covered by health insurance (%)
Kidney Conditions-Urology - Avg. # of times urinating at night
Medical Conditions - People with asthma (%)
Medical Conditions - People with anemia (%)
Medical Conditions - People with psoriasis (%)
Medical Conditions - People with overweight (%)
Medical Conditions - Elderly people having difficulties in thinking or remembering (%)
Medical Conditions - People who ever received blood transfusion (%)
Medical Conditions - People having trouble seeing even with glass/contacts (%)
Medical Conditions - People with arthritis (%)
Medical Conditions - People with gout (%)
Medical Conditions - People with congestive heart failure (%)
Medical Conditions - People with coronary heart disease (%)
Medical Conditions - People with angina pectoris (%)
Medical Conditions - People who ever had heart attack (%)
Medical Conditions - People who ever had stroke (%)
Medical Conditions - People with emphysema (%)
Medical Conditions - People with thyroid problem (%)
Medical Conditions - People with chronic bronchitis (%)
Medical Conditions - People with any liver condition (%)
Medical Conditions - People who ever had cancer or malignancy (%)
Mental Health - People who have little interest in doing things (%)
Mental Health - People feeling down, depressed, or hopeless (%)
Mental Health - People who have trouble sleeping or sleeping too much (%)
Mental Health - People feeling tired or having little energy (%)
Mental Health - People with poor appetite or overeating (%)
Mental Health - People feeling bad about themself (%)
Mental Health - People who have trouble concentrating on things (%)
Mental Health - People moving or speaking slowly or too fast (%)
Mental Health - People having thoughts they would be better off dead (%)
Oral Health - Average years since last visit a dentist
Oral Health - People embarrassed because of mouth (%)
Oral Health - People with gum disease (%)
Oral Health - General health of teeth and gums (%)
Oral Health - Average days a week using dental floss/device
Oral Health - Average days a week using mouthwash for dental problem
Oral Health - Average number of teeth
Pesticide Use - Households using pesticides to control insects (%)
Pesticide Use - Households using pesticides to kill weeds (%)
Physical Activity - People doing vigorous-intensity work activities (%)
Physical Activity - People doing moderate-intensity work activities (%)
Physical Activity - People walking or bicycling (%)
Physical Activity - People doing vigorous-intensity recreational activities (%)
Physical Activity - People doing moderate-intensity recreational activities (%)
Physical Activity - Average hours a day doing sedentary activities
Physical Activity - Average hours a day watching TV or videos
Physical Activity - Average hours a day using computer
Physical Functioning - People having limitations keeping them from working (%)
Physical Functioning - People limited in amount of work they can do (%)
Physical Functioning - People that need special equipment to walk (%)
Physical Functioning - People experiencing confusion/memory problems (%)
Physical Functioning - People requiring special healthcare equipment (%)
Prescription Medications - Average number of prescription medicines taking
Preventive Aspirin Use - Adults 40+ taking low-dose aspirin (%)
Reproductive Health - Vaginal deliveries (%)
Reproductive Health - Cesarean deliveries (%)
Reproductive Health - Deliveries resulted in a live birth (%)
Reproductive Health - Pregnancies resulted in a delivery (%)
Reproductive Health - Women breastfeeding newborns (%)
Reproductive Health - Women that had a hysterectomy (%)
Reproductive Health - Women that had both ovaries removed (%)
Reproductive Health - Women that have ever taken birth control pills (%)
Reproductive Health - Women taking birth control pills (%)
Reproductive Health - Women that have ever used Depo-Provera or injectables (%)
Reproductive Health - Women that have ever used female hormones (%)
Sexual Behavior - People 18+ that ever had sex (vaginal, anal, or oral) (%)
Sexual Behavior - Males 18+ that ever had vaginal sex with a woman (%)
Sexual Behavior - Males 18+ that ever performed oral sex on a woman (%)
Sexual Behavior - Males 18+ that ever had anal sex with a woman (%)
Sexual Behavior - Males 18+ that ever had any sex with a man (%)
Sexual Behavior - Females 18+ that ever had vaginal sex with a man (%)
Sexual Behavior - Females 18+ that ever performed oral sex on a man (%)
Sexual Behavior - Females 18+ that ever had anal sex with a man (%)
Sexual Behavior - Females 18+ that ever had any kind of sex with a woman (%)
Sexual Behavior - Average age people first had sex
Sexual Behavior - Average number of female sex partners in lifetime (males 18+)
Sexual Behavior - Average number of female vaginal sex partners in lifetime (males 18+)
Sexual Behavior - Average age people first performed oral sex on a woman (18+)
Sexual Behavior - Average number of woman performed oral sex on in lifetime (18+)
Sexual Behavior - Average number of male sex partners in lifetime (males 18+)
Sexual Behavior - Average number of male anal sex partners in lifetime (males 18+)
Sexual Behavior - Average age people first performed oral sex on a man (18+)
Sexual Behavior - Average number of male oral sex partners in lifetime (18+)
Sexual Behavior - People using protection when performing oral sex (%)
Sexual Behavior - Average number of times people have vaginal or anal sex a year
Sexual Behavior - People having sex without condom (%)
Sexual Behavior - Average number of male sex partners in lifetime (females 18+)
Sexual Behavior - Average number of male vaginal sex partners in lifetime (females 18+)
Sexual Behavior - Average number of female sex partners in lifetime (females 18+)
Sexual Behavior - Circumcised males 18+ (%)
Sleep Disorders - Average hours sleeping at night
Sleep Disorders - People that has trouble sleeping (%)
Smoking-Cigarette Use - People smoking cigarettes (%)
Taste & Smell - People 40+ having problems with smell (%)
Taste & Smell - People 40+ having problems with taste (%)
Taste & Smell - People 40+ that ever had wisdom teeth removed (%)
Taste & Smell - People 40+ that ever had tonsils teeth removed (%)
Taste & Smell - People 40+ that ever had a loss of consciousness because of a head injury (%)
Taste & Smell - People 40+ that ever had a broken nose or other serious injury to face or skull (%)
Taste & Smell - People 40+ that ever had two or more sinus infections (%)
Weight - Average height (inches)
Weight - Average weight (pounds)
Weight - Average BMI
Weight - People that are obese (%)
Weight - People that ever were obese (%)
Weight - People trying to lose weight (%)
Latest news from Cross Lanes, WV collected exclusively by city-data.com from local newspapers, TV, and radio stations
Ancestries: English (26.4%), American (18.6%), German (17.1%), Irish (6.9%), Scotch-Irish (2.9%), Scottish (2.7%).
Current Local Time:
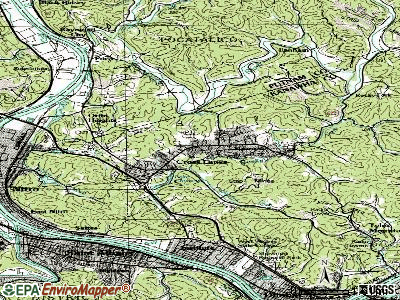
Land area: 6.49 square miles.
Population density: 1,539 people per square mile (low).
214 residents are foreign born (1.2% Asia , 0.3% Africa , 0.3% Latin America ).
This place:
2.2%West Virginia:
1.6%
Median real estate property taxes paid for housing units with mortgages in 2022: $1,091 (0.7%)Median real estate property taxes paid for housing units with no mortgage in 2022: $741 (0.7%)
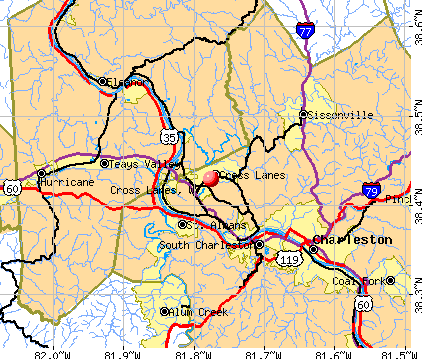
Nearest city with pop. 50,000+: Charleston, WV
Nearest city with pop. 200,000+: Columbus, OH
Nearest city with pop. 1,000,000+: Philadelphia, PA
Nearest cities:
Latitude: 38.43 N, Longitude: 81.78 W
Daytime population change due to commuting: -2,507 (-25.6%)Workers who live and work in this place: 1,209 (24.6%)
Unemployment in December 2023: Here:
3.7%West Virginia:
4.0%
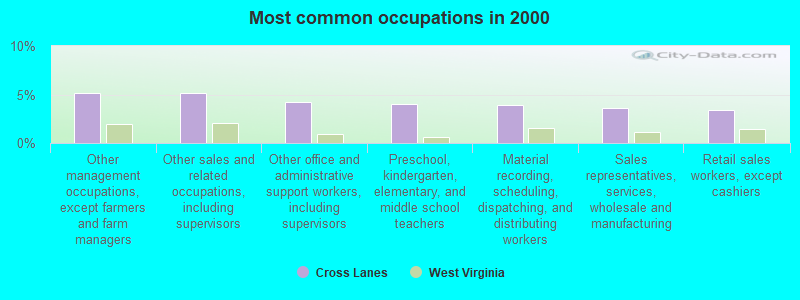
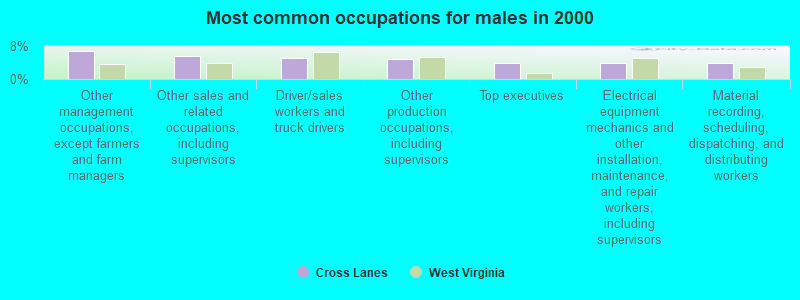
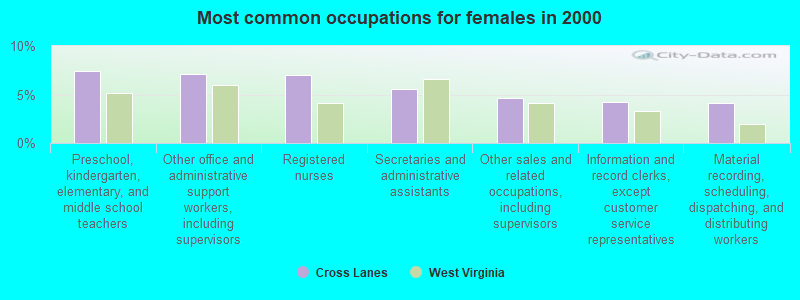
Most common occupations in Cross Lanes, WV (%)
Both Males Females
Other management occupations, except farmers and farm managers (5.2%)
Other sales and related occupations, including supervisors (5.2%)
Other office and administrative support workers, including supervisors (4.2%)
Preschool, kindergarten, elementary, and middle school teachers (4.0%)
Material recording, scheduling, dispatching, and distributing workers (3.9%)
Sales representatives, services, wholesale and manufacturing (3.6%)
Retail sales workers, except cashiers (3.4%)
Other management occupations, except farmers and farm managers (6.9%)
Other sales and related occupations, including supervisors (5.6%)
Driver/sales workers and truck drivers (5.0%)
Other production occupations, including supervisors (4.8%)
Top executives (3.9%)
Electrical equipment mechanics and other installation, maintenance, and repair workers, including supervisors (3.9%)
Material recording, scheduling, dispatching, and distributing workers (3.8%)
Preschool, kindergarten, elementary, and middle school teachers (7.5%)
Other office and administrative support workers, including supervisors (7.1%)
Registered nurses (7.0%)
Secretaries and administrative assistants (5.6%)
Other sales and related occupations, including supervisors (4.6%)
Information and record clerks, except customer service representatives (4.2%)
Material recording, scheduling, dispatching, and distributing workers (4.1%)
Tornado activity:
Cross Lanes-area historical tornado activity is slightly below West Virginia state average. It is 73% smaller than the overall U.S. average.
On 4/23/1968, a category F5 (max. wind speeds 261-318 mph) tornado 35.4 miles away from the Cross Lanes place center killed 7 people and injured 93 people and caused between $500,000 and $5,000,000 in damages.
On 4/8/1965, a category F3 (max. wind speeds 158-206 mph) tornado 40.9 miles away from the place center injured 3 people and caused between $50,000 and $500,000 in damages.
Earthquake activity:
Cross Lanes-area historical earthquake activity is significantly above West Virginia state average. It is 6% smaller than the overall U.S. average. On 8/23/2011 at 17:51:04, a magnitude 5.8 (5.8 MW, Depth: 3.7 mi, Class: Moderate, Intensity: VI - VII) earthquake occurred 211.8 miles away from Cross Lanes center On 7/27/1980 at 18:52:21, a magnitude 5.2 (5.1 MB, 4.7 MS, 5.0 UK, 5.2 UK) earthquake occurred 118.6 miles away from the city center On 8/9/2020 at 12:07:37, a magnitude 5.1 (5.1 MW, Depth: 4.7 mi) earthquake occurred 140.2 miles away from the city center On 9/25/1998 at 19:52:52, a magnitude 5.2 (4.8 MB, 4.3 MS, 5.2 LG, 4.5 MW, Depth: 3.1 mi) earthquake occurred 224.1 miles away from Cross Lanes center On 9/7/1988 at 02:28:09, a magnitude 4.6 (4.5 MB, 4.6 LG, Class: Light, Intensity: IV - V) earthquake occurred 115.8 miles away from the city center On 1/31/1986 at 16:46:43, a magnitude 5.0 (5.0 MB) earthquake occurred 221.9 miles away from the city center Magnitude types: regional Lg-wave magnitude (LG), body-wave magnitude (MB), surface-wave magnitude (MS), moment magnitude (MW) Natural disasters: The number of natural disasters in Kanawha County (28) is a lot greater than the US average (15).Major Disasters (Presidential) Declared: 22Emergencies Declared: 5Floods: 15, Storms: 14, Landslides: 8, Winter Storms: 5, Hurricanes: 3, Mudslides: 3, Blizzard: 1, Fire: 1, Heavy Rain: 1, Snowfall: 1, Snowstorm: 1, Tornado: 1, Wind: 1, Other: 2 (Note: some incidents may be assigned to more than one category). Hospitals and medical centers in Cross Lanes: CROSS LANES GROUP HOME (5202 LINDA VISTA DRIVE) Other hospitals and medical centers near Cross Lanes: HUDSON STREET GROUP HOME (Hospital, about 4 miles away; SAINT ALBANS, WV)
GOLDEN LIVINGCENTER - RIVERSIDE (Nursing Home, about 4 miles away; SAINT ALBANS, WV)
HANSFORD STREET GROUP HOME (Hospital, about 5 miles away; SAINT ALBANS, WV)
ARC GROUP HOME (Hospital, about 5 miles away; DUNBAR, WV)
KANAWHA HOSPICE CARE, INC. (Hospital, about 6 miles away; DUNBAR, WV)
FMC - KANAWHA COUNTY (Dialysis Facility, about 6 miles away; DUNBAR, WV)
DUNBAR CARE AND REHABILITATION CENTER (Nursing Home, about 6 miles away; DUNBAR, WV)
Amtrak station near Cross Lanes: 9 miles: CHARLESTON (350 MCCORKLE AVE. SE) Services: ticket office, fully wheelchair accessible, enclosed waiting area, public restrooms, public payphones, vending machines, free short-term parking, free long-term parking, call for taxi service, public transit connection.
College/University in Cross Lanes: Everest Institute-Cross Lanes Full-time enrollment: 408; Location: 5514 Big Tyler Rd; Private, for-profit; Website: www.everest.edu/campus/cross_lanes)
Colleges/universities with over 2000 students nearest to Cross Lanes:
West Virginia State University (about 4 miles; Institute, WV ; Full-time enrollment: 2,133)
Marshall University (about 36 miles; Huntington, WV ; FT enrollment: 11,450)
Ashland Community and Technical College (about 48 miles; Ashland, KY ; FT enrollment: 2,482)
New River Community and Technical College (about 54 miles; Beckley, WV ; FT enrollment: 2,234)
West Virginia University at Parkersburg (about 57 miles; Parkersburg, WV ; FT enrollment: 2,619)
Ohio University-Main Campus (about 65 miles; Athens, OH ; FT enrollment: 26,181)
Shawnee State University (about 70 miles; Portsmouth, OH ; FT enrollment: 4,160)
Private high school in Cross Lanes: CROSS LANES CHRISTIAN SCHOOL Students: 264, Location: 5330 FLORADALE DR, Grades: KG-12)
Kanawha County has a predicted average indoor radon screening level less than 2 pCi/L (pico curies per liter) - Low Potential Average household size: This place:
2.3 peopleWest Virginia:
2.4 people
Percentage of family households: This place:
64.6%Whole state:
65.8%
Percentage of households with unmarried partners: This place:
7.5%Whole state:
6.6%
Likely homosexual households (counted as self-reported same-sex unmarried-partner households)
Lesbian couples: 0.5% of all households Gay men: 0.6% of all households
7 people in correctional residential facilities in 2010people in group homes intended for adults in 2010people in other noninstitutional group quarters in 2000people in homes for the mentally retarded in 2000
Banks with branches in Cross Lanes (2011 data):
Branch Banking and Trust Company: Cross Lanes Branch at 5560 Big Tyler Road, branch established on 1986/09/29. Info updated 2010/03/29: Bank assets: $168,867.6 mil, Deposits: $127,549.5 mil, headquarters in Winston Salem, NC, positive income , Commercial Lending Specialization, 1793 total offices , Holding Company: Bb&T Corporation
City National Bank of West Virginia: Cross Lanes Branch at 308 Goff Mountain Road, branch established on 1972/07/05. Info updated 2008/01/10: Bank assets: $2,753.2 mil, Deposits: $2,223.1 mil, headquarters in Charleston, WV, positive income , Commercial Lending Specialization, 68 total offices , Holding Company: City Holding Company
Fifth Third Bank: Cross Lanes Banking Center Branch at 102 Lakeview Drive, branch established on 2005/09/19. Info updated 2009/10/05: Bank assets: $114,540.4 mil, Deposits: $89,689.1 mil, headquarters in Cincinnati, OH, positive income , Commercial Lending Specialization, 1378 total offices , Holding Company: Fifth Third Bancorp
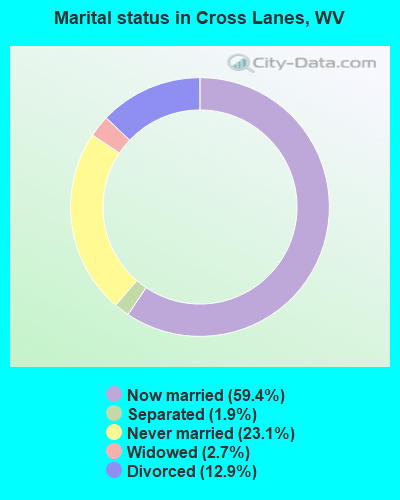
For population 15 years and over in Cross Lanes:
Never married: 23.1%Now married: 59.4%Separated: 1.9%Widowed: 2.7%Divorced: 12.9% For population 25 years and over in Cross Lanes:
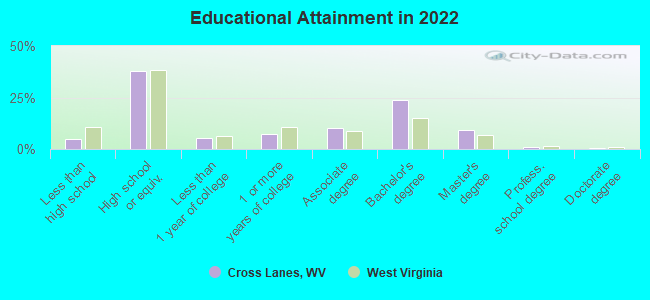
High school or higher: 95.5%Bachelor's degree or higher: 32.9%Graduate or professional degree: 10.4%Unemployed: 4.9%Mean travel time to work (commute): 20.8 minutes
Education Gini index (Inequality in education) Here:
9.3West Virginia average:
11.1
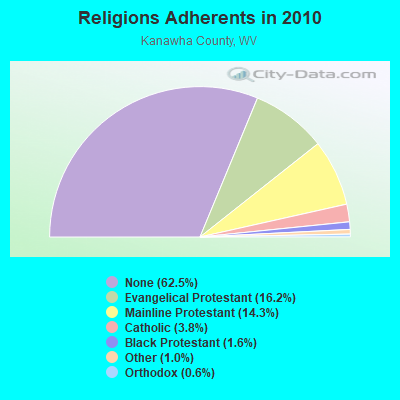
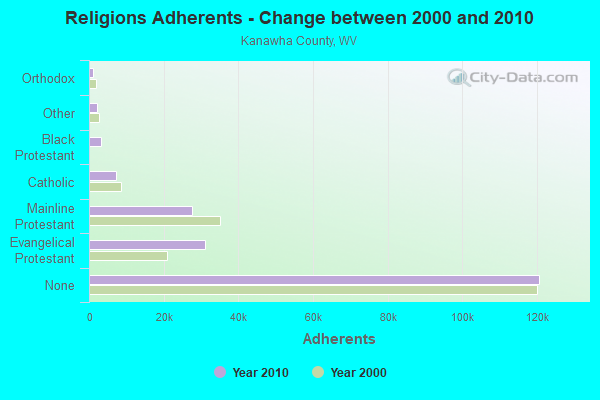
Religion statistics for Cross Lanes, WV (based on Kanawha County data)
Religion Adherents Congregations Evangelical Protestant 31,202 219 Mainline Protestant 27,583 114 Catholic 7,331 11 Black Protestant 3,114 12 Other 2,020 10 Orthodox 1,136 2 None 120,677 -
Source: Clifford Grammich, Kirk Hadaway, Richard Houseal, Dale E.Jones, Alexei Krindatch, Richie Stanley and Richard H.Taylor. 2012. 2010 U.S.Religion Census: Religious Congregations & Membership Study. Association of Statisticians of American Religious Bodies. Jones, Dale E., et al. 2002. Congregations and Membership in the United States 2000. Nashville, TN: Glenmary Research Center. Graphs represent county-level data
Food Environment Statistics: Number of grocery stores : 47Here :
2.46 / 10,000 pop.West Virginia :
2.41 / 10,000 pop.
Number of supercenters and club stores : 3Kanawha County :
0.16 / 10,000 pop.West Virginia :
0.28 / 10,000 pop.
Number of convenience stores (no gas) : 10This county :
0.52 / 10,000 pop.West Virginia :
1.09 / 10,000 pop.
Number of convenience stores (with gas) : 98This county :
5.13 / 10,000 pop.West Virginia :
5.38 / 10,000 pop.
Number of full-service restaurants : 132Here :
6.90 / 10,000 pop.West Virginia :
6.22 / 10,000 pop.
Adult diabetes rate : Here :
12.1%West Virginia :
12.2%
Adult obesity rate : Kanawha County :
29.6%West Virginia :
31.1%
Low-income preschool obesity rate : Kanawha County :
12.0%West Virginia :
13.1%
Health and Nutrition: Healthy diet rate : Here:
50.1%West Virginia:
51.8%
Average overall health of teeth and gums : Cross Lanes:
48.2%West Virginia:
49.7%
Average BMI : Cross Lanes:
29.0State:
28.6
People feeling badly about themselves : This city:
19.6%State:
20.4%
People not drinking alcohol at all : Here:
9.1%West Virginia:
9.7%
Average hours sleeping at night : Overweight people : Cross Lanes:
35.2%West Virginia:
34.8%
General health condition : This city:
58.4%State:
58.4%
Average condition of hearing : Cross Lanes:
79.6%West Virginia:
78.6%
More about Health and Nutrition of Cross Lanes, WV Residents
Businesses in Cross Lanes, WV
Name Count Name Count
7-Eleven 1 Motel 6 1 Arby's 1 Papa John's Pizza 1 Burger King 1 Pizza Hut 1 Comfort Inn 1 RadioShack 1 Cracker Barrel 1 Rite Aid 2 Domino's Pizza 1 Sleep Inn 1 Fashion Bug 1 Subway 1 FedEx 1 T.G.I. Driday's 1 GNC 1 Taco Bell 1 GameStop 1 Tim Hortons 1 H&R Block 1 U-Haul 1 Little Caesars Pizza 1 UPS 2 Lowe's 1 Walgreens 1 MasterBrand Cabinets 1 Walmart 1 McDonald's 1 Wendy's 1
Strongest AM radio stations in Cross Lanes:
WCHS (580 AM; 5 kW; CHARLESTON, WV; Owner: WEST VIRGINIA RADIO CORPORATION OF CHARLESTON)
WVTS (950 AM; 5 kW; CHARLESTON, WV; Owner: BRISTOL BROADCASTING COMPANY, INC.)
WSCW (1410 AM; daytime; 5 kW; SOUTH CHARLESTON, WV; Owner: L.M. COMMUNICATIONS OF KENTUCKY, LLC)
WCAW (680 AM; 10 kW; CHARLESTON, WV; Owner: WEST VIRGINIA RADIO CORPORATION OF CHARLESTON)
WBES (1240 AM; 1 kW; CHARLESTON, WV; Owner: BRISTOL BROADCASTING COMPANY, INC.)
WJYP (1300 AM; 1 kW; ST. ALBANS, WV)
WZZW (1600 AM; 5 kW; MILTON, WV; Owner: CAPSTAR TX LIMITED PARTNERSHIP)
WBGS (1030 AM; daytime; 10 kW; POINT PLEASANT, WV; Owner: BIG RIVER RADIO, INC.)
WTVN (610 AM; 50 kW; COLUMBUS, OH; Owner: CITICASTERS LICENSES, L.P.)
WSWW (1490 AM; 1 kW; CHARLESTON, WV; Owner: WEST VIRGINIA RADIO CORPORATION OF CHARLESTON)
WOKU (1080 AM; daytime; 1 kW; HURRICANE, WV; Owner: BIG RIVER RADIO, INC.)
WOAY (860 AM; 10 kW; OAK HILL, WV; Owner: COMMISSIONED COMMUNICATIONS, INC.)
WVHU (800 AM; 5 kW; HUNTINGTON, WV; Owner: CAPSTAR TX LIMITED PARTNERSHIP)
Strongest FM radio stations in Cross Lanes:
WZJO (94.5 FM; DUNBAR, WV; Owner: BRISTOL BROADCASTING COMPANY, INC)
WQBE-FM (97.5 FM; CHARLESTON, WV; Owner: BRISTOL BROADCASTING COMPANY)
WKLC-FM (105.1 FM; ST. ALBANS, WV; Owner: WKLC, INC.)
WJYP-FM (100.9 FM; SOUTH CHARLESTON, WV; Owner: L.M. COMMUNICATIONS OF KENTUCKY, LLC)
WRVZ (98.7 FM; POCATALICO, WV; Owner: WEST VIRGINIA RADIO CORPORATION OF CHARLESTON)
WVSR-FM (102.7 FM; CHARLESTON, WV; Owner: BRISTOL BROADCASTING COMPANY, INC.)
WKWS (96.1 FM; CHARLESTON, WV; Owner: WEST VIRGINIA RADIO CORPORATION OF CHARLESTON)
WVWV (89.9 FM; HUNTINGTON, WV; Owner: WEST VIRGINIA EDUCATIONAL BROADCASTING AUTHORITY)
WVAF (99.9 FM; CHARLESTON, WV; Owner: WEST VIRGINIA RADIO CORPORATION OF CHARLESTON)
WAMX (106.3 FM; MILTON, WV; Owner: CAPSTAR TX LIMITED PARTNERSHIP)
WKAZ (107.3 FM; MIAMI, WV; Owner: WEST VIRGINIA RADIO CORPORATION OF CHARLESTON)
WVPN (88.5 FM; CHARLESTON, WV; Owner: WEST VIRGINIA EDUCATIONAL BROADCASTING AUTHORITY)
WXAF (90.9 FM; CHARLESTON, WV; Owner: MARANATHA BROADCASTING, INC.)
WCIR-FM (103.7 FM; BECKLEY, WV; Owner: SOUTHERN COMMUNICATIONS CORPORATION)
WKVW (93.3 FM; MONTGOMERY, WV; Owner: EDUCATIONAL MEDIA FOUNDATION)
WZAC-FM (92.5 FM; DANVILLE, WV; Owner: PRICE BROADCASTING COMPANY)
WDBS (97.1 FM; SUTTON, WV; Owner: SUMMIT MEDIA BROADCASTING, L.L.C.)
W208AK (89.5 FM; CHARLESTON, WV; Owner: LOWER OHIO VALLEY EDUCATIONAL CORP.)
WEMM (107.9 FM; HUNTINGTON, WV; Owner: MORTENSON BROADCASTING CO. OF WEST VIRGINIA, LLC)
WCEF (98.3 FM; RIPLEY, WV; Owner: BIG RIVER RADIO, INC.)
TV broadcast stations around Cross Lanes:
WLPX-TV (Channel 29; CHARLESTON, WV; Owner: PAXSON CHARLESTON LICENSE, INC.)
WVAH-TV (Channel 11; CHARLESTON, WV; Owner: WVAH LICENSEE, LLC)
WCHS-TV (Channel 8; CHARLESTON, WV; Owner: WCHS LICENSEE, LLC)
WPBY-TV (Channel 33; HUNTINGTON, WV; Owner: WEST VIRGINIA EDUCATIONAL BROADCASTING AUTHORITY)
WSAZ-TV (Channel 3; HUNTINGTON, WV; Owner: EMMIS TELEVISION LICENSE CORPORATION)
W31CA (Channel 31; CHARLESTON, WV; Owner: NATIONAL MINORITY T.V., INC.)
WOWK-TV (Channel 13; HUNTINGTON, WV; Owner: WEST VIRGINIA MEDIA HOLDINGS, LLC)
W16CE (Channel 16; CHARLESTON, WV; Owner: EMMIS TELEVISION LICENSE CORPORATION)
W36CR (Channel 36; HUNTINGTON, WV; Owner: NATIONAL MINORITY T.V., INC.)
WOWB-LP (Channel 53; CHARLESTON, WV; Owner: COMMONWEALTH BROADCASTING GROUP, INC.)
National Bridge Inventory (NBI) Statistics 12 Number of bridges92ft / 27.8m Total length $950,000 Total costs62,586 Total average daily traffic12,051 Total average daily truck traffic76,264 Total future (year 2037) average daily traffic
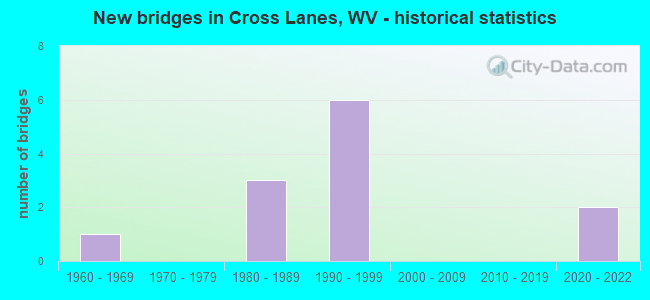
New bridges - historical statistics
1 1960-1969 3 1980-1989 6 1990-1999 2 2020-2022
See full National Bridge Inventory statistics for Cross Lanes, WV
FCC Registered Antenna Towers: 43 (
See the full list of FCC Registered Antenna Towers in Cross Lanes )
FCC Registered Private Land Mobile Towers: 1
1 Mi E Of I64 & Goff Mountain Rd (Lat: 38.399250 Lon: -81.778194), Structure height: 101 m, Call Sign: WPQW908, Licensee ID: L00001014, Assigned Frequencies: 861.812 MHz, 863.812 MHz, Grant Date: 08/19/2008, Expiration Date: 09/27/2018, Cancellation Date: 07/16/2014, Certifier: Robin J Glenny, Registrant: Nextel Wip Expansion Two Corp. FCC Registered Broadcast Land Mobile Towers: 2
5380 Big Tower Rd (Lat: 38.432028 Lon: -81.749306), Call Sign: WYG255, Assigned Frequencies: 155.145 MHz, 155.745 MHz, Grant Date: 09/12/2023, Expiration Date: 11/14/2033, Registrant: Metro 911 Kanawha County Emergency Operations Center, 200 Peyton Way, Charleston, WV 25309-8627, Phone: (304) 746-7911, Fax: (304) 746-7914, Email:
1 Mi E Of I64 & Goff Mt Rd (Lat: 38.399528 Lon: -81.778472), Call Sign: KNIB415, Assigned Frequencies: 39.7600 MHz, 39.9800 MHz, Grant Date: 11/01/2023, Expiration Date: 12/13/2033, Registrant: Kanawha County Metro 911, 200 Peyton Way, Charleston, WV 25309-8627, Phone: (304) 746-7911, Fax: (304) 746-7914, Email:
FCC Registered Microwave Towers: 4 (
See the full list of FCC Registered Microwave Towers in this town )
FCC Registered Paging Towers: 5 (
See the full list of FCC Registered Paging Towers )
FCC Registered Amateur Radio Licenses: 47 (
See the full list of FCC Registered Amateur Radio Licenses in Cross Lanes )
FAA Registered Aircraft: 4
Aircraft: CESSNA 172M (Category: Land, Seats: 4, Weight: Up to 12,499 Pounds, Speed: 108 mph), Engine: LYCOMING 0-320 SERIES (180 HP) (4 Cycle)N-Number: 20512, N20512, N-20512, Serial Number: 17261350, Year manufactured: 1973, Airworthiness Date: 03/15/1973, Certificate Issue Date: 07/28/2003Registrant (LLC): Fly Guys LLC, 5014 Ann Lee Dr, Cross Lanes, WV 25313Aircraft: HAWKER BEECHCRAFT CORP 390 (Category: Land, Engines: 2, Seats: 8, Weight: 12,500 - 19,999 Pounds), Engine: WILLIAMS FJ44-2A (2300 Pounds of Thrust) (Turbo-fan)N-Number: 21FM, N21FM, N-21FM, Serial Number: RB-273, Year manufactured: 2009, Airworthiness Date: 08/19/2009, Certificate Issue Date: 10/01/2009Registrant (LLC): Rcs Holdings LLC, 5081 Washington St W, Cross Lanes, WV 25313Aircraft: SPADARO JAMES J T-BIRD I (Category: Land, Weight: Up to 12,499 Pounds), Engine: ROTAX 503ULDCDI (52 HP) (2 Cycle)N-Number: 703JS, N703JS, N-703JS, Serial Number: 117000TBI, Year manufactured: 2000, Airworthiness Date: 11/25/2007, Certificate Issue Date: 10/10/2007Registrant (Individual): James J Spadaro, 126 Goff Mountain Rd Apt 25, Cross Lanes, WV 25313Aircraft: CESSNA 150M (Category: Land, Seats: 2, Weight: Up to 12,499 Pounds, Speed: 81 mph), Engine: CONT MOTOR 0-200 SERIES (100 HP) (4 Cycle)N-Number: 8619U, N8619U, N-8619U, Serial Number: 15077961, Year manufactured: 1976, Airworthiness Date: 02/20/1976, Certificate Issue Date: 11/29/2005Registrant (Individual): James Spadaro, 126 Goff Mountain Rd Apt 25, Cross Lanes, WV 25313
Home Mortgage Disclosure Act Aggregated Statistics For Year 2009(Based on 3 partial tracts) A) FHA, FSA/RHS & VA B) Conventional C) Refinancings D) Home Improvement Loans E) Loans on Dwellings For 5+ Families F) Non-occupant Loans on G) Loans On Manufactured Number Average Value Number Average Value Number Average Value Number Average Value Number Average Value Number Average Value Number Average Value
LOANS ORIGINATED 29 $129,379 22 $103,707 89 $116,786 12 $32,108 1 $1,650,530 5 $62,432 3 $42,390 APPLICATIONS APPROVED, NOT ACCEPTED 4 $136,708 1 $79,530 6 $149,242 1 $78,100 0 $0 1 $68,860 0 $0 APPLICATIONS DENIED 6 $142,603 5 $118,274 37 $117,981 13 $26,658 0 $0 3 $88,000 1 $71,550 APPLICATIONS WITHDRAWN 5 $153,810 9 $85,759 25 $121,308 1 $116,200 0 $0 2 $38,715 1 $56,330 FILES CLOSED FOR INCOMPLETENESS 1 $200,050 0 $0 8 $110,976 0 $0 0 $0 0 $0 0 $0
Aggregated Statistics For Year 2008(Based on 3 partial tracts) A) FHA, FSA/RHS & VA B) Conventional C) Refinancings D) Home Improvement Loans E) Loans on Dwellings For 5+ Families F) Non-occupant Loans on G) Loans On Manufactured Number Average Value Number Average Value Number Average Value Number Average Value Number Average Value Number Average Value Number Average Value
LOANS ORIGINATED 24 $126,692 40 $116,597 62 $102,672 21 $30,656 1 $669,970 7 $116,373 4 $38,582 APPLICATIONS APPROVED, NOT ACCEPTED 4 $78,200 3 $101,640 7 $76,920 0 $0 0 $0 2 $80,405 1 $82,650 APPLICATIONS DENIED 4 $148,368 10 $69,647 60 $115,564 8 $45,024 0 $0 2 $56,285 3 $49,057 APPLICATIONS WITHDRAWN 2 $137,285 6 $123,650 19 $123,040 1 $68,860 0 $0 2 $91,405 1 $33,050 FILES CLOSED FOR INCOMPLETENESS 0 $0 2 $89,725 2 $146,580 0 $0 0 $0 0 $0 0 $0
Aggregated Statistics For Year 2007(Based on 3 partial tracts) A) FHA, FSA/RHS & VA B) Conventional C) Refinancings D) Home Improvement Loans F) Non-occupant Loans on G) Loans On Manufactured Number Average Value Number Average Value Number Average Value Number Average Value Number Average Value Number Average Value
LOANS ORIGINATED 7 $130,701 72 $96,030 84 $94,938 20 $38,326 9 $63,653 7 $49,093 APPLICATIONS APPROVED, NOT ACCEPTED 0 $0 12 $117,320 19 $97,159 3 $45,463 1 $154,700 1 $36,680 APPLICATIONS DENIED 0 $0 11 $70,560 57 $117,249 17 $46,245 5 $131,122 6 $56,287 APPLICATIONS WITHDRAWN 1 $117,510 7 $96,969 19 $111,997 2 $37,560 1 $74,450 0 $0 FILES CLOSED FOR INCOMPLETENESS 0 $0 4 $84,055 6 $85,393 0 $0 0 $0 0 $0
Aggregated Statistics For Year 2006(Based on 3 partial tracts) A) FHA, FSA/RHS & VA B) Conventional C) Refinancings D) Home Improvement Loans E) Loans on Dwellings For 5+ Families F) Non-occupant Loans on G) Loans On Manufactured Number Average Value Number Average Value Number Average Value Number Average Value Number Average Value Number Average Value Number Average Value
LOANS ORIGINATED 9 $123,084 81 $102,361 81 $96,485 25 $27,327 1 $448,820 21 $88,429 4 $32,990 APPLICATIONS APPROVED, NOT ACCEPTED 0 $0 12 $122,598 16 $81,990 2 $29,550 0 $0 1 $168,030 3 $96,223 APPLICATIONS DENIED 1 $103,140 31 $66,581 64 $95,417 13 $37,523 0 $0 6 $66,115 21 $54,991 APPLICATIONS WITHDRAWN 1 $133,100 14 $109,064 24 $109,200 4 $96,485 0 $0 3 $83,597 0 $0 FILES CLOSED FOR INCOMPLETENESS 0 $0 5 $108,766 6 $134,573 0 $0 0 $0 0 $0 0 $0
Aggregated Statistics For Year 2005(Based on 3 partial tracts) A) FHA, FSA/RHS & VA B) Conventional C) Refinancings D) Home Improvement Loans E) Loans on Dwellings For 5+ Families F) Non-occupant Loans on G) Loans On Manufactured Number Average Value Number Average Value Number Average Value Number Average Value Number Average Value Number Average Value Number Average Value
LOANS ORIGINATED 9 $100,573 80 $105,972 97 $96,450 17 $31,191 1 $271,260 7 $97,207 3 $72,503 APPLICATIONS APPROVED, NOT ACCEPTED 0 $0 14 $83,444 20 $84,468 3 $42,443 0 $0 2 $44,005 5 $55,302 APPLICATIONS DENIED 3 $69,507 32 $77,844 70 $103,097 18 $34,253 1 $222,890 5 $72,064 20 $54,114 APPLICATIONS WITHDRAWN 1 $75,490 8 $91,646 28 $115,401 5 $163,346 0 $0 1 $91,940 1 $38,150 FILES CLOSED FOR INCOMPLETENESS 1 $94,980 4 $134,322 4 $111,698 0 $0 0 $0 1 $80,650 0 $0
Aggregated Statistics For Year 2004(Based on 3 partial tracts) A) FHA, FSA/RHS & VA B) Conventional C) Refinancings D) Home Improvement Loans E) Loans on Dwellings For 5+ Families F) Non-occupant Loans on G) Loans On Manufactured Number Average Value Number Average Value Number Average Value Number Average Value Number Average Value Number Average Value Number Average Value
LOANS ORIGINATED 11 $95,993 79 $97,598 112 $93,844 21 $29,366 1 $375,900 9 $56,110 6 $44,663 APPLICATIONS APPROVED, NOT ACCEPTED 0 $0 11 $69,634 21 $92,027 4 $24,015 0 $0 1 $81,310 3 $34,057 APPLICATIONS DENIED 6 $90,510 20 $84,360 69 $96,809 14 $17,670 0 $0 1 $141,790 11 $62,375 APPLICATIONS WITHDRAWN 2 $87,960 10 $103,651 31 $116,751 1 $14,320 0 $0 0 $0 1 $49,160 FILES CLOSED FOR INCOMPLETENESS 2 $66,550 5 $129,506 7 $101,103 0 $0 0 $0 0 $0 0 $0
Aggregated Statistics For Year 2003(Based on 3 partial tracts) A) FHA, FSA/RHS & VA B) Conventional C) Refinancings D) Home Improvement Loans E) Loans on Dwellings For 5+ Families F) Non-occupant Loans on Number Average Value Number Average Value Number Average Value Number Average Value Number Average Value Number Average Value
LOANS ORIGINATED 10 $96,848 80 $98,192 206 $92,246 15 $21,697 3 $861,903 12 $76,262 APPLICATIONS APPROVED, NOT ACCEPTED 1 $45,600 17 $83,097 28 $99,327 6 $13,815 0 $0 2 $70,520 APPLICATIONS DENIED 1 $118,480 18 $57,089 54 $91,007 19 $22,155 0 $0 5 $72,094 APPLICATIONS WITHDRAWN 2 $76,395 9 $115,899 32 $100,180 0 $0 0 $0 4 $100,285 FILES CLOSED FOR INCOMPLETENESS 0 $0 6 $60,382 8 $97,966 1 $33,910 0 $0 2 $56,240
Aggregated Statistics For Year 2002(Based on 3 partial tracts) A) FHA, FSA/RHS & VA B) Conventional C) Refinancings D) Home Improvement Loans E) Loans on Dwellings For 5+ Families F) Non-occupant Loans on Number Average Value Number Average Value Number Average Value Number Average Value Number Average Value Number Average Value
LOANS ORIGINATED 12 $95,191 61 $94,378 160 $93,454 22 $25,009 2 $246,125 12 $69,323 APPLICATIONS APPROVED, NOT ACCEPTED 0 $0 17 $59,339 24 $84,514 1 $18,790 0 $0 3 $76,180 APPLICATIONS DENIED 2 $121,365 27 $55,369 73 $86,847 11 $9,651 0 $0 6 $44,853 APPLICATIONS WITHDRAWN 1 $56,270 5 $73,174 27 $83,204 0 $0 0 $0 4 $41,948 FILES CLOSED FOR INCOMPLETENESS 1 $81,120 3 $103,837 10 $103,651 1 $10,240 0 $0 0 $0
Aggregated Statistics For Year 2001(Based on 3 partial tracts) A) FHA, FSA/RHS & VA B) Conventional C) Refinancings D) Home Improvement Loans F) Non-occupant Loans on Number Average Value Number Average Value Number Average Value Number Average Value Number Average Value
LOANS ORIGINATED 12 $104,797 70 $94,789 116 $91,888 14 $22,908 6 $83,815 APPLICATIONS APPROVED, NOT ACCEPTED 2 $112,075 13 $69,538 25 $74,353 3 $50,640 0 $0 APPLICATIONS DENIED 1 $71,720 27 $51,863 60 $91,787 8 $29,539 4 $53,095 APPLICATIONS WITHDRAWN 0 $0 4 $70,395 35 $71,714 3 $21,260 1 $86,520 FILES CLOSED FOR INCOMPLETENESS 0 $0 0 $0 5 $109,728 1 $14,180 0 $0
Aggregated Statistics For Year 2000(Based on 3 partial tracts) A) FHA, FSA/RHS & VA B) Conventional C) Refinancings D) Home Improvement Loans F) Non-occupant Loans on Number Average Value Number Average Value Number Average Value Number Average Value Number Average Value
LOANS ORIGINATED 9 $83,261 62 $81,774 45 $74,487 19 $18,098 5 $59,880 APPLICATIONS APPROVED, NOT ACCEPTED 8 $40,409 12 $41,281 15 $40,954 5 $29,624 1 $43,990 APPLICATIONS DENIED 9 $55,992 35 $45,949 40 $69,960 9 $9,829 2 $23,590 APPLICATIONS WITHDRAWN 0 $0 9 $61,542 31 $58,260 2 $20,745 0 $0 FILES CLOSED FOR INCOMPLETENESS 1 $63,410 2 $65,015 6 $47,287 0 $0 1 $8,300
Aggregated Statistics For Year 1999(Based on 3 partial tracts) A) FHA, FSA/RHS & VA B) Conventional C) Refinancings D) Home Improvement Loans E) Loans on Dwellings For 5+ Families F) Non-occupant Loans on Number Average Value Number Average Value Number Average Value Number Average Value Number Average Value Number Average Value
LOANS ORIGINATED 16 $82,423 76 $83,790 93 $80,625 18 $15,551 1 $350,750 9 $83,104 APPLICATIONS APPROVED, NOT ACCEPTED 1 $96,130 16 $50,535 16 $63,369 2 $18,240 0 $0 0 $0 APPLICATIONS DENIED 2 $78,670 31 $51,922 36 $57,344 11 $16,735 0 $0 2 $37,980 APPLICATIONS WITHDRAWN 3 $68,223 13 $57,093 27 $65,524 2 $51,365 0 $0 0 $0 FILES CLOSED FOR INCOMPLETENESS 0 $0 1 $77,790 7 $82,156 0 $0 0 $0 2 $68,245
Detailed HMDA statistics for the following Tracts:
0105.00
, 0107.01 , 0107.02
Private Mortgage Insurance Companies Aggregated Statistics For Year 2009(Based on 3 partial tracts) A) Conventional B) Refinancings Number Average Value Number Average Value
LOANS ORIGINATED 9 $122,973 4 $159,018 APPLICATIONS APPROVED, NOT ACCEPTED 1 $119,650 3 $125,453 APPLICATIONS DENIED 0 $0 1 $186,880 APPLICATIONS WITHDRAWN 0 $0 0 $0 FILES CLOSED FOR INCOMPLETENESS 0 $0 0 $0
Aggregated Statistics For Year 2008(Based on 3 partial tracts) A) Conventional B) Refinancings C) Non-occupant Loans on Number Average Value Number Average Value Number Average Value
LOANS ORIGINATED 16 $134,116 7 $162,706 1 $56,570 APPLICATIONS APPROVED, NOT ACCEPTED 5 $90,932 2 $160,020 0 $0 APPLICATIONS DENIED 0 $0 0 $0 0 $0 APPLICATIONS WITHDRAWN 1 $194,010 0 $0 0 $0 FILES CLOSED FOR INCOMPLETENESS 0 $0 0 $0 0 $0
Aggregated Statistics For Year 2007(Based on 3 partial tracts) A) Conventional B) Refinancings Number Average Value Number Average Value
LOANS ORIGINATED 30 $125,947 9 $143,383 APPLICATIONS APPROVED, NOT ACCEPTED 9 $114,104 0 $0 APPLICATIONS DENIED 0 $0 0 $0 APPLICATIONS WITHDRAWN 1 $247,890 0 $0 FILES CLOSED FOR INCOMPLETENESS 0 $0 0 $0
Aggregated Statistics For Year 2006(Based on 3 partial tracts) A) Conventional B) Refinancings C) Non-occupant Loans on Number Average Value Number Average Value Number Average Value
LOANS ORIGINATED 25 $120,356 3 $135,477 2 $77,765 APPLICATIONS APPROVED, NOT ACCEPTED 7 $104,014 4 $116,532 2 $54,345 APPLICATIONS DENIED 1 $100,810 0 $0 0 $0 APPLICATIONS WITHDRAWN 2 $86,850 1 $72,460 0 $0 FILES CLOSED FOR INCOMPLETENESS 0 $0 0 $0 0 $0
Aggregated Statistics For Year 2005(Based on 3 partial tracts) A) Conventional B) Refinancings Number Average Value Number Average Value
LOANS ORIGINATED 21 $115,424 6 $125,487 APPLICATIONS APPROVED, NOT ACCEPTED 5 $98,396 4 $127,640 APPLICATIONS DENIED 1 $91,880 0 $0 APPLICATIONS WITHDRAWN 4 $120,015 3 $91,500 FILES CLOSED FOR INCOMPLETENESS 0 $0 0 $0
Aggregated Statistics For Year 2004(Based on 3 partial tracts) A) Conventional B) Refinancings C) Non-occupant Loans on Number Average Value Number Average Value Number Average Value
LOANS ORIGINATED 22 $105,815 16 $115,953 1 $43,220 APPLICATIONS APPROVED, NOT ACCEPTED 7 $89,510 2 $93,090 0 $0 APPLICATIONS DENIED 0 $0 0 $0 0 $0 APPLICATIONS WITHDRAWN 3 $97,487 1 $157,520 1 $63,010 FILES CLOSED FOR INCOMPLETENESS 0 $0 0 $0 0 $0
Aggregated Statistics For Year 2003(Based on 3 partial tracts) A) Conventional B) Refinancings C) Non-occupant Loans on Number Average Value Number Average Value Number Average Value
LOANS ORIGINATED 38 $113,719 20 $118,814 1 $54,540 APPLICATIONS APPROVED, NOT ACCEPTED 8 $108,964 9 $102,942 1 $66,470 APPLICATIONS DENIED 0 $0 0 $0 0 $0 APPLICATIONS WITHDRAWN 1 $63,000 1 $63,800 0 $0 FILES CLOSED FOR INCOMPLETENESS 0 $0 0 $0 0 $0
Aggregated Statistics For Year 2002(Based on 3 partial tracts) A) Conventional B) Refinancings Number Average Value Number Average Value
LOANS ORIGINATED 29 $105,476 20 $118,354 APPLICATIONS APPROVED, NOT ACCEPTED 10 $114,426 5 $126,918 APPLICATIONS DENIED 0 $0 0 $0 APPLICATIONS WITHDRAWN 2 $104,865 2 $121,505 FILES CLOSED FOR INCOMPLETENESS 0 $0 0 $0
Aggregated Statistics For Year 2001(Based on 3 partial tracts) A) Conventional B) Refinancings C) Non-occupant Loans on Number Average Value Number Average Value Number Average Value
LOANS ORIGINATED 28 $102,955 15 $121,901 0 $0 APPLICATIONS APPROVED, NOT ACCEPTED 4 $127,302 4 $133,212 0 $0 APPLICATIONS DENIED 1 $25,990 0 $0 1 $39,300 APPLICATIONS WITHDRAWN 1 $287,470 1 $83,490 0 $0 FILES CLOSED FOR INCOMPLETENESS 0 $0 0 $0 0 $0
Aggregated Statistics For Year 2000(Based on 3 partial tracts) A) Conventional B) Refinancings C) Non-occupant Loans on Number Average Value Number Average Value Number Average Value
LOANS ORIGINATED 21 $101,769 4 $105,130 0 $0 APPLICATIONS APPROVED, NOT ACCEPTED 2 $89,030 0 $0 1 $70,680 APPLICATIONS DENIED 0 $0 0 $0 0 $0 APPLICATIONS WITHDRAWN 1 $129,850 0 $0 0 $0 FILES CLOSED FOR INCOMPLETENESS 1 $78,760 0 $0 0 $0
Aggregated Statistics For Year 1999(Based on 3 partial tracts) A) Conventional B) Refinancings C) Non-occupant Loans on Number Average Value Number Average Value Number Average Value
LOANS ORIGINATED 30 $95,651 5 $106,310 1 $76,890 APPLICATIONS APPROVED, NOT ACCEPTED 2 $99,370 2 $71,915 0 $0 APPLICATIONS DENIED 1 $59,420 1 $150,900 0 $0 APPLICATIONS WITHDRAWN 1 $73,900 0 $0 0 $0 FILES CLOSED FOR INCOMPLETENESS 0 $0 0 $0 0 $0
Detailed PMIC statistics for the following Tracts:
0105.00
, 0107.01 , 0107.02 Fire-safe hotels and motels in Cross Lanes, West Virginia:
Comfort Inn, 102 Racer Dr, Cross Lanes, West Virginia 25313 Phone: (304) 776-8070, Fax: (304) 776-6460
Motel 6, 330 Goff MTN Rd, Cross Lanes, West Virginia 25313 Phone: (304) 776-5917, Fax: (304) 776-7450
Sleep Inn, 15 Goff Crossing Dr, Cross Lanes, West Virginia 25313 Phone: (304) 776-7711, Fax: (304) 776-7781
All 3 fire-safe hotels and motels in Cross Lanes, West Virginia Cross Lanes compared to West Virginia state average:
Unemployed percentage significantly below state average. Length of stay since moving in above state average. Percentage of population with a bachelor's degree or higher above state average.
Top Patent Applicants
F. David Hussein (17)
Thomas C. Eisenschmid (9)
Stanley L. Hager (9)
Louis A. Kapicak (7)
Fathi D. Hussein (3)
David F. Hussein (3)
Donald A. Fischer (3)
John R Parrish (2)
Douglas H. Jackson (1)
Daniel N. Thomas, Jr. (1)
Total of 68 patent applications in 2008-2024.


 Recent articles from our blog. Our writers, many of them Ph.D. graduates or candidates, create easy-to-read articles on a wide variety of topics.

 (9.5 miles
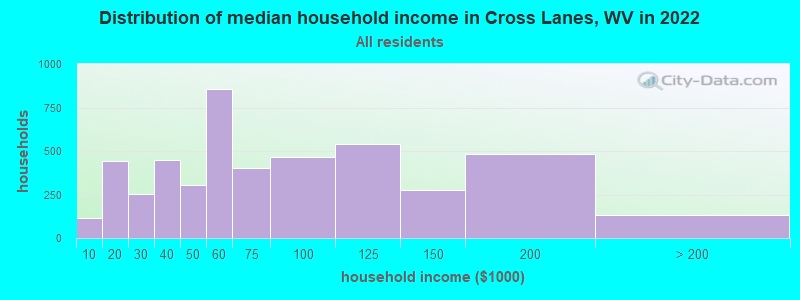


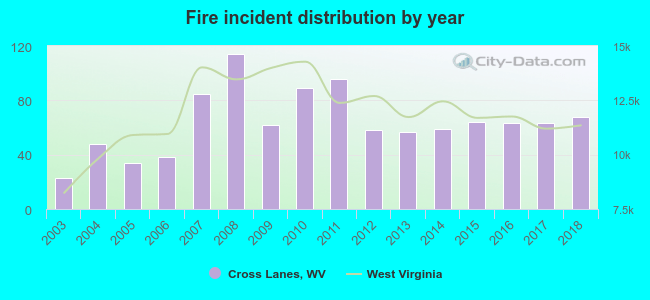 Based on the data from the years 2003 - 2018 the average number of fire incidents per year is 64. The highest number of reported fires - 114 took place in 2008, and the least - 23 in 2003. The data has a growing trend.
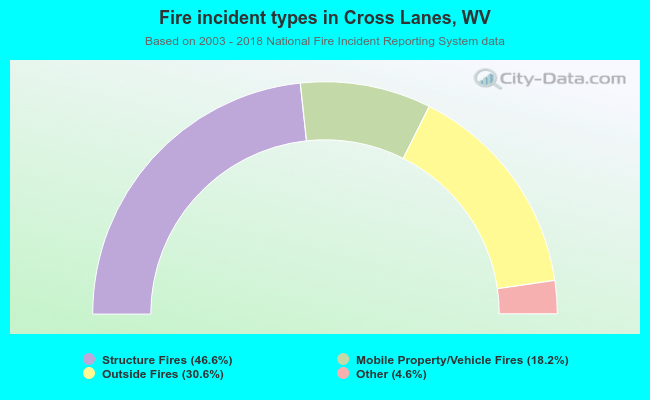 When looking into fire subcategories, the most reports belonged to: Structure Fires (46.6%), and Outside Fires (30.6%).