Danville, Illinois

Danville: Sunset on Harmon St.

Danville: Lamon House

Danville: Temple Plaza
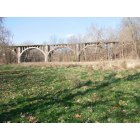
Danville: This old, abandoned and collapsing bridge was once the main traffic connection between Danville and Vermilion Heights. The 791 ft. long structure was built in 1915 and closed to traffic in 1960.
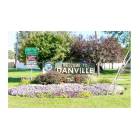
Danville: Welcome to Danville!

Danville: War Museum
Danville: ellsworth parl
Danville: Kennekuk County Park

Danville: The 4th of July as seen from the lake.

Danville: Mushrooms
Danville: Local signs encourage citizens to keep Danville clean
- add
your
Submit your own pictures of this city and show them to the world
- OSM Map
- General Map
- Google Map
- MSN Map
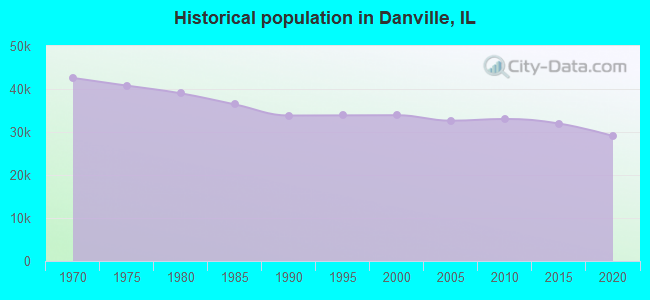
Population change since 2000: -16.0%
 |
| Males: 14,311 | |
| Females: 14,161 |
| Median resident age: | 39.3 years |
| Illinois median age: | 39.1 years |
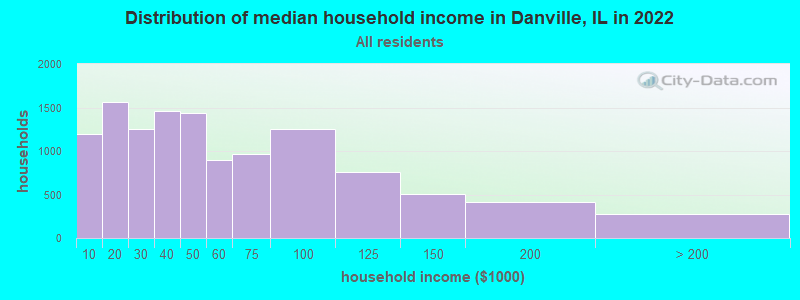
| Danville: | $41,402 |
| IL: | $76,708 |
Estimated per capita income in 2022: $25,913 (it was $16,476 in 2000)
Danville city income, earnings, and wages data
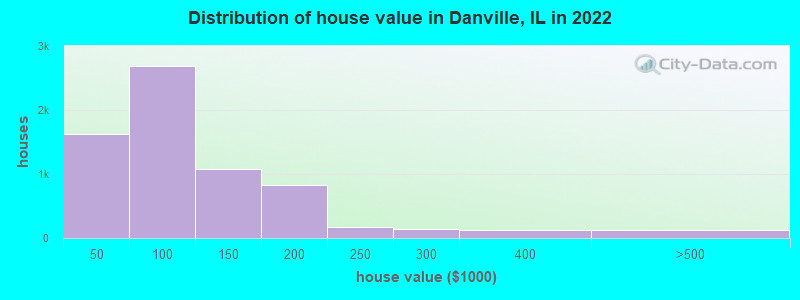
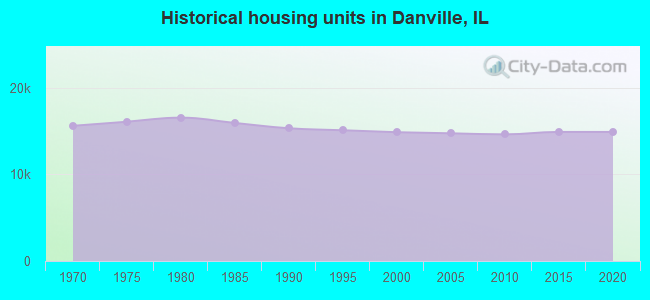
Estimated median house or condo value in 2022: $81,550 (it was $51,800 in 2000)
| Danville: | $81,550 |
| IL: | $251,600 |
Mean prices in 2022: all housing units: $104,760; detached houses: $100,759; townhouses or other attached units: $116,515; in 2-unit structures: $128,975; in 3-to-4-unit structures: $119,783; in 5-or-more-unit structures: $341,393; mobile homes: $155,260
Median gross rent in 2022: $734.
(18.1% for White Non-Hispanic residents, 40.0% for Black residents, 20.5% for Hispanic or Latino residents, 100.0% for American Indian residents, 6.0% for other race residents, 35.9% for two or more races residents)
Detailed information about poverty and poor residents in Danville, IL


Compare current foreclosures in Danville, IL:
| Photo | Address | Area | Beds / Baths | Price | Details |
|---|---|---|---|---|---|

|
#1
N Franklin St
Danville, IL 61832
|
900 sq. feet
|
1 baths 2 beds |
$26,900
|
show details |

|
#2
E Fairchild St
Danville, IL 61832
|
- sq. feet
|
- baths - beds |
$12,900
|
show details |

|
#3
Timberline Dr
Danville, IL 61832
|
- sq. feet
|
1 baths 3 beds |
show details | |

|
#4
W Voorhees St
Danville, IL 61832
|
- sq. feet
|
- baths - beds |
show details | |

|
#5
Shasta Dr
Danville, IL 61832
|
- sq. feet
|
- baths - beds |
show details | |

|
#6
Oak St
Danville, IL 61832
|
- sq. feet
|
- baths - beds |
show details | |

|
#7
King St
Danville, IL 61832
|
- sq. feet
|
- baths - beds |
show details | |

|
#8
E 2750 North Rd
Danville, IL 61834
|
- sq. feet
|
- baths - beds |
show details | |

|
#9
Johnson St
Danville, IL 61832
|
- sq. feet
|
- baths - beds |
show details | |

|
#10
E 14th St Trlr 11
Danville, IL 61832
|
- sq. feet
|
- baths - beds |
show details |
| Photo | Address | Area | Beds / Baths | Price | Details |
|---|---|---|---|---|---|

|
#11
Griggs St
Danville, IL 61832
|
- sq. feet
|
- baths - beds |
show details | |

|
#12
Perrysville Rd Lot 2
Danville, IL 61834
|
- sq. feet
|
- baths - beds |
show details | |

|
#13
Sunset Rdg
Danville, IL 61832
|
- sq. feet
|
- baths - beds |
show details | |

|
#14
N Vermilion St Apt 405
Danville, IL 61832
|
- sq. feet
|
- baths - beds |
show details | |

|
#15
N Walnut St
Danville, IL 61832
|
- sq. feet
|
- baths - beds |
show details | |

|
#16
Oak St # 9
Danville, IL 61832
|
- sq. feet
|
- baths - beds |
show details | |

|
#17
Dodge Ave
Danville, IL 61832
|
- sq. feet
|
- baths - beds |
show details | |

|
#18
Vine St
Danville, IL 61834
|
- sq. feet
|
- baths - beds |
show details | |

|
#19
1/2 Dodge Ave
Danville, IL 61832
|
- sq. feet
|
- baths - beds |
show details | |

|
#20
Avenue C
Danville, IL 61832
|
- sq. feet
|
- baths - beds |
show details |
| Photo | Address | Area | Beds / Baths | Price | Details |
|---|---|---|---|---|---|

|
#21
Myrtle Dr
Danville, IL 61832
|
- sq. feet
|
- baths - beds |
show details | |

|
#22
W Conron Ave
Danville, IL 61832
|
- sq. feet
|
- baths - beds |
show details | |

|
#23
Redbud Ln
Danville, IL 61832
|
- sq. feet
|
- baths - beds |
show details | |

|
#24
Sherman St
Danville, IL 61832
|
- sq. feet
|
- baths - beds |
show details | |

|
#25
Perrysville Rd
Danville, IL 61834
|
- sq. feet
|
- baths - beds |
show details | |

|
#26
Garfield Pl
Danville, IL 61832
|
- sq. feet
|
- baths - beds |
show details | |

|
#27
E Elm St
Danville, IL 61832
|
- sq. feet
|
- baths - beds |
show details | |

|
#28
Country Club Dr
Danville, IL 61832
|
- sq. feet
|
- baths - beds |
show details | |

|
#29
S Crawford St
Danville, IL 61832
|
- sq. feet
|
- baths - beds |
show details | |

|
#30
Johnson St
Danville, IL 61832
|
- sq. feet
|
- baths - beds |
show details |
| Photo | Address | Area | Beds / Baths | Price | Details |
|---|---|---|---|---|---|

|
#31
Oakwood Ave
Danville, IL 61832
|
- sq. feet
|
- baths - beds |
show details | |

|
#32
Warrington Ave
Danville, IL 61832
|
- sq. feet
|
- baths - beds |
show details | |

|
#33
N Gilbert St
Danville, IL 61832
|
- sq. feet
|
- baths - beds |
show details | |

|
#34
Poland Rd
Danville, IL 61834
|
- sq. feet
|
- baths - beds |
show details | |

|
#35
Shady Ln
Danville, IL 61832
|
- sq. feet
|
- baths - beds |
show details | |

|
#36
Sunset Rdg
Danville, IL 61832
|
- sq. feet
|
- baths - beds |
show details | |

|
#37
N California Ave
Danville, IL 61832
|
- sq. feet
|
- baths - beds |
show details | |

|
#38
E 2550 North Rd
Danville, IL 61834
|
- sq. feet
|
- baths - beds |
show details | |

|
#39
Oakwood Ave
Danville, IL 61832
|
- sq. feet
|
- baths - beds |
show details | |

|
#40
E Fairchild St
Danville, IL 61832
|
- sq. feet
|
- baths - beds |
show details |
| Photo | Address | Area | Beds / Baths | Price | Details |
|---|---|---|---|---|---|

|
Check over 1 million property listings on Foreclosure.com!
|
browse all offers | |||
| Photo | Address | Area | Beds / Baths | Price | Details |
|---|


- 15,66655.2%White alone
- 9,58633.8%Black alone
- 2,3928.4%Hispanic
- 5521.9%Two or more races
- 4031.4%Asian alone
- 220.08%American Indian alone
- 90.03%Native Hawaiian and Other
Pacific Islander alone
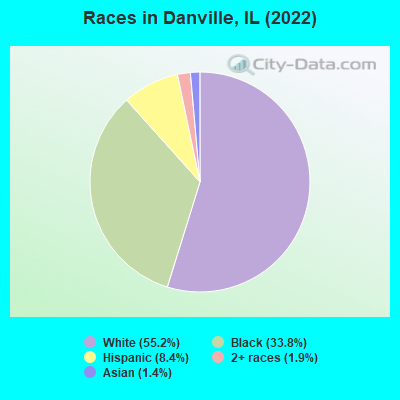
Races in Danville detailed stats: ancestries, foreign born residents, place of birth
According to our research of Illinois and other state lists, there were 148 registered sex offenders living in Danville, Illinois as of May 19, 2024.
The ratio of all residents to sex offenders in Danville is 216 to 1.
Type |
2009 |
2010 |
2011 |
2012 |
2013 |
2014 |
2015 |
2016 |
2017 |
2018 |
2019 |
2020 |
2021 |
2022 |
|---|---|---|---|---|---|---|---|---|---|---|---|---|---|---|
| Murders (per 100,000) | 4 (12.5) | 1 (3.0) | 3 (9.1) | 3 (9.1) | 4 (12.3) | 0 (0.0) | 0 (0.0) | 6 (18.8) | 10 (31.9) | 12 (38.5) | 6 (19.6) | 8 (26.5) | 6 (20.1) | 4 (14.0) |
| Rapes (per 100,000) | 0 (0.0) | 35 (106.0) | 50 (150.9) | 42 (127.3) | 44 (135.3) | 43 (132.7) | 52 (162.2) | 36 (112.7) | 36 (114.8) | 53 (169.9) | 50 (163.2) | 10 (33.1) | 55 (184.4) | 42 (147.5) |
| Robberies (per 100,000) | 108 (336.7) | 86 (260.4) | 74 (223.4) | 80 (242.4) | 81 (249.0) | 77 (237.6) | 87 (271.4) | 88 (275.6) | 88 (280.5) | 103 (330.1) | 65 (212.1) | 59 (195.3) | 29 (97.2) | 35 (122.9) |
| Assaults (per 100,000) | 219 (682.8) | 226 (684.3) | 208 (627.9) | 203 (615.2) | 267 (820.7) | 228 (703.6) | 313 (976.4) | 367 (1,149) | 412 (1,313) | 391 (1,253) | 414 (1,351) | 428 (1,417) | 437 (1,465) | 419 (1,471) |
| Burglaries (per 100,000) | 791 (2,466) | 826 (2,501) | 793 (2,394) | 659 (1,997) | 849 (2,610) | 630 (1,944) | 705 (2,199) | 646 (2,023) | 456 (1,454) | 379 (1,215) | 341 (1,113) | 399 (1,321) | 236 (791.2) | 287 (1,008) |
| Thefts (per 100,000) | 1,338 (4,171) | 1,295 (3,921) | 1,366 (4,124) | 1,247 (3,779) | 1,194 (3,670) | 1,191 (3,675) | 1,255 (3,915) | 1,185 (3,711) | 1,306 (4,163) | 1,133 (3,631) | 957 (3,123) | 774 (2,562) | 970 (3,252) | 1,015 (3,564) |
| Auto thefts (per 100,000) | 82 (255.6) | 57 (172.6) | 47 (141.9) | 74 (224.3) | 45 (138.3) | 57 (175.9) | 77 (240.2) | 63 (197.3) | 71 (226.3) | 77 (246.8) | 72 (235.0) | 48 (158.9) | 103 (345.3) | 71 (249.3) |
| Arson (per 100,000) | 12 (37.4) | 9 (27.3) | 11 (33.2) | 21 (63.6) | 17 (52.3) | 6 (18.5) | 11 (34.3) | 7 (21.9) | 9 (28.7) | 15 (48.1) | 9 (29.4) | 30 (99.3) | 23 (77.1) | 16 (56.2) |
| City-Data.com crime index | 622.4 | 651.5 | 675.3 | 624.7 | 712.2 | 615.4 | 736.2 | 746.2 | 788.8 | 812.5 | 725.2 | 629.1 | 723.0 | 710.2 |
The City-Data.com crime index weighs serious crimes and violent crimes more heavily. Higher means more crime, U.S. average is 246.1. It adjusts for the number of visitors and daily workers commuting into cities.
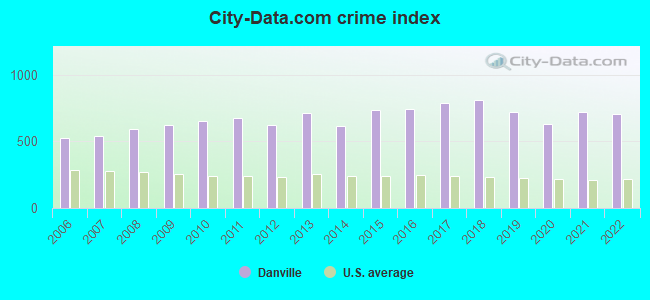
Crime rate in Danville detailed stats: murders, rapes, robberies, assaults, burglaries, thefts, arson
Full-time law enforcement employees in 2021, including police officers: 72 (60 officers - 55 male; 5 female).
| Officers per 1,000 residents here: | 2.01 |
| Illinois average: | 2.84 |
 Recent articles from our blog. Our writers, many of them Ph.D. graduates or candidates, create easy-to-read articles on a wide variety of topics.

 | cabrini green residents (44 replies) |
| Retiring in IL - LIBERAL! (24 replies) |
| Do any other non-Chicagoans hate being call "down staters"? (21 replies) |
| Why do restaurant chains leave Chicago area? (91 replies) |
| Illinois is headed for disaster and I don't want to be here for it (484 replies) |
| East St. Louis... what happened there? (79 replies) |
Latest news from Danville, IL collected exclusively by city-data.com from local newspapers, TV, and radio stations
Ancestries: German (7.9%), American (5.9%), Irish (5.2%), English (4.4%), Italian (1.4%), Austrian (1.1%).
Current Local Time: CST time zone
Incorporated on 06/09/1874
Elevation: 597 feet
Land area: 17.0 square miles.
Population density: 1,675 people per square mile (low).
1,037 residents are foreign born (2.2% Latin America, 1.1% Asia).
| This city: | 3.7% |
| Illinois: | 14.1% |
Median real estate property taxes paid for housing units with mortgages in 2022: $2,376 (2.5%)
Median real estate property taxes paid for housing units with no mortgage in 2022: $1,210 (1.7%)
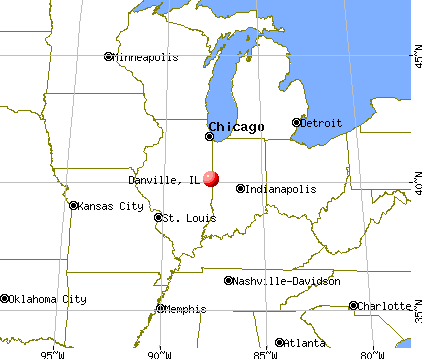
Nearest city with pop. 50,000+: Champaign, IL  (33.9 miles , pop. 67,518).
Nearest city with pop. 200,000+: Indianapolis, IN (81.8 miles , pop. 781,870).
Nearest city with pop. 1,000,000+: Chicago, IL (117.7 miles , pop. 2,896,016).
Nearest cities:
), ), ), ), ), Latitude: 40.14 N, Longitude: 87.62 W
Daytime population change due to commuting: +8,312 (+29.3%)
Workers who live and work in this city: 8,238 (79.2%)
Area code: 217
Danville, Illinois accommodation & food services, waste management - Economy and Business Data
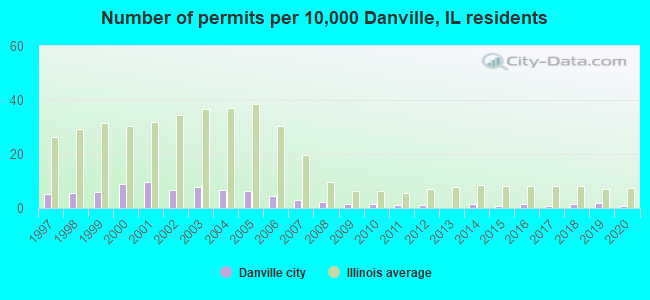
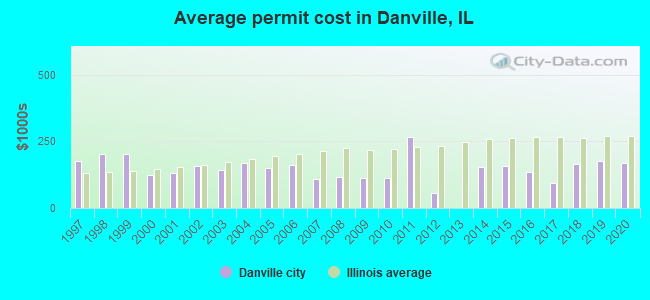
Single-family new house construction building permits:
- 2020: 2 buildings, average cost: $167,000
- 2019: 6 buildings, average cost: $175,000
- 2018: 5 buildings, average cost: $163,800
- 2017: 3 buildings, average cost: $93,300
- 2016: 5 buildings, average cost: $136,000
- 2015: 3 buildings, average cost: $159,000
- 2014: 5 buildings, average cost: $152,000
- 2012: 4 buildings, average cost: $57,500
- 2011: 4 buildings, average cost: $265,500
- 2010: 5 buildings, average cost: $112,000
- 2009: 5 buildings, average cost: $112,000
- 2008: 8 buildings, average cost: $118,400
- 2007: 10 buildings, average cost: $106,600
- 2006: 15 buildings, average cost: $160,000
- 2005: 21 buildings, average cost: $150,700
- 2004: 23 buildings, average cost: $168,600
- 2003: 27 buildings, average cost: $143,300
- 2002: 23 buildings, average cost: $156,700
- 2001: 33 buildings, average cost: $133,400
- 2000: 30 buildings, average cost: $125,000
- 1999: 20 buildings, average cost: $202,600
- 1998: 19 buildings, average cost: $202,600
- 1997: 17 buildings, average cost: $178,300
| Here: | 6.3% |
| Illinois: | 4.2% |
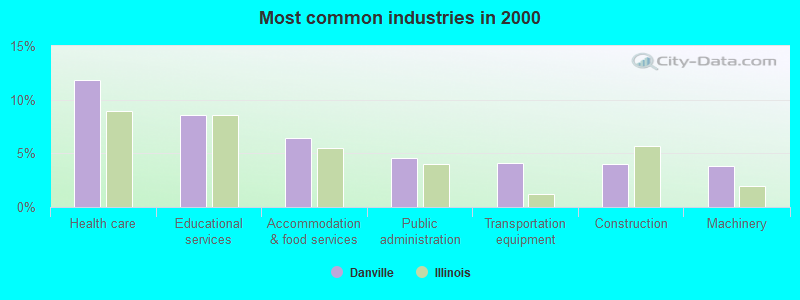
- Health care (11.8%)
- Educational services (8.5%)
- Accommodation & food services (6.4%)
- Public administration (4.5%)
- Transportation equipment (4.1%)
- Construction (4.0%)
- Machinery (3.8%)
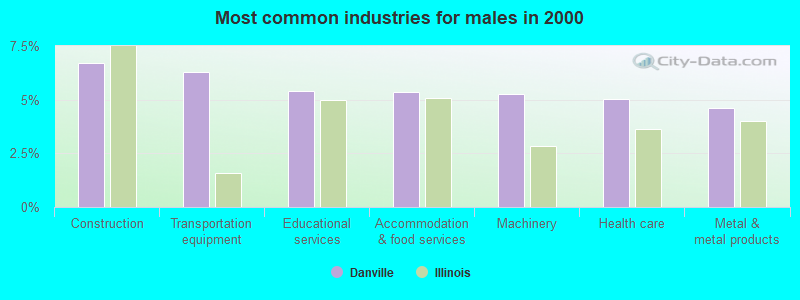
- Construction (6.7%)
- Transportation equipment (6.3%)
- Educational services (5.4%)
- Accommodation & food services (5.4%)
- Machinery (5.3%)
- Health care (5.0%)
- Metal & metal products (4.6%)
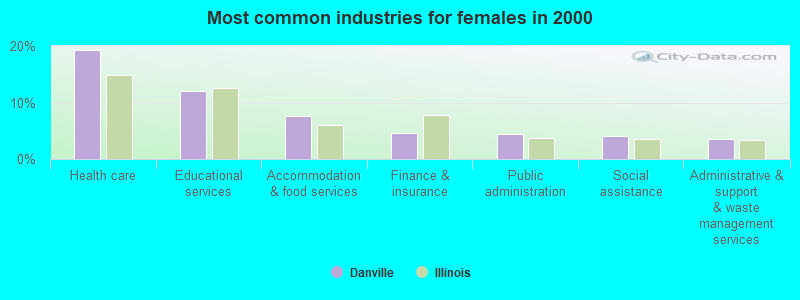
- Health care (19.3%)
- Educational services (12.0%)
- Accommodation & food services (7.6%)
- Finance & insurance (4.5%)
- Public administration (4.4%)
- Social assistance (4.0%)
- Administrative & support & waste management services (3.5%)
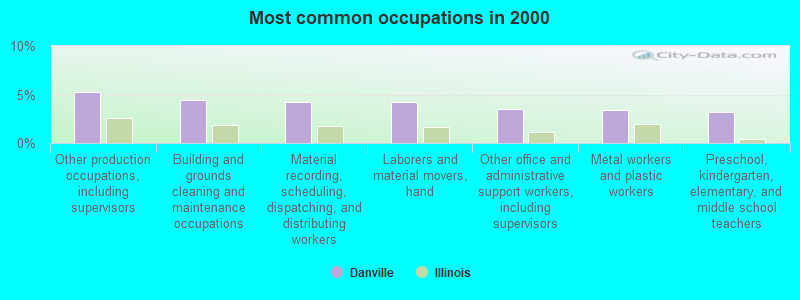
- Other production occupations, including supervisors (5.2%)
- Building and grounds cleaning and maintenance occupations (4.4%)
- Material recording, scheduling, dispatching, and distributing workers (4.3%)
- Laborers and material movers, hand (4.2%)
- Other office and administrative support workers, including supervisors (3.5%)
- Metal workers and plastic workers (3.4%)
- Preschool, kindergarten, elementary, and middle school teachers (3.2%)
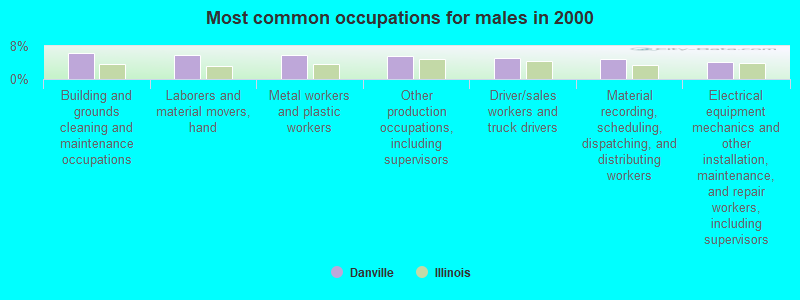
- Building and grounds cleaning and maintenance occupations (6.2%)
- Laborers and material movers, hand (5.8%)
- Metal workers and plastic workers (5.7%)
- Other production occupations, including supervisors (5.6%)
- Driver/sales workers and truck drivers (5.1%)
- Material recording, scheduling, dispatching, and distributing workers (4.8%)
- Electrical equipment mechanics and other installation, maintenance, and repair workers, including supervisors (4.2%)
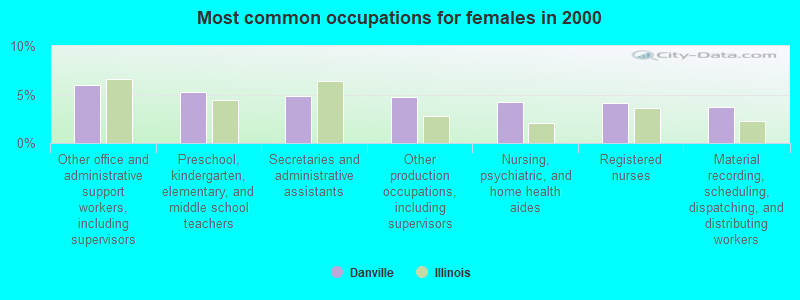
- Other office and administrative support workers, including supervisors (6.0%)
- Preschool, kindergarten, elementary, and middle school teachers (5.2%)
- Secretaries and administrative assistants (4.8%)
- Other production occupations, including supervisors (4.8%)
- Nursing, psychiatric, and home health aides (4.3%)
- Registered nurses (4.1%)
- Material recording, scheduling, dispatching, and distributing workers (3.7%)
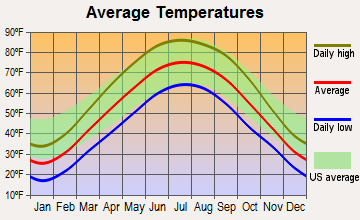
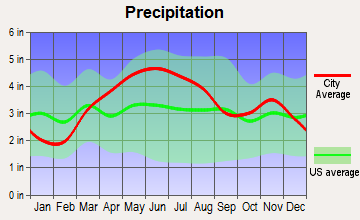
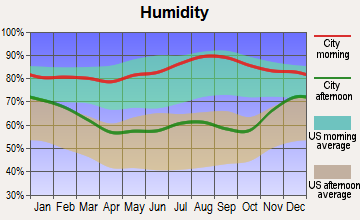
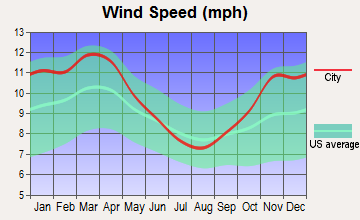
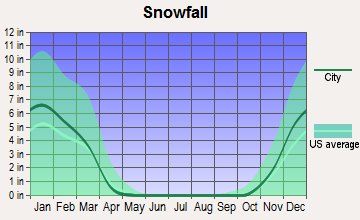
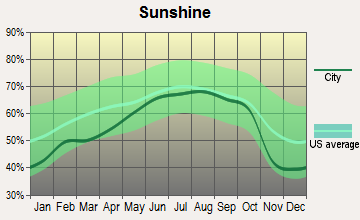
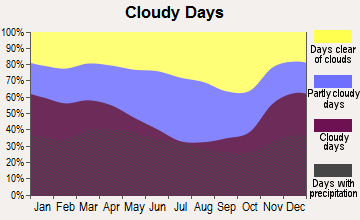
Average climate in Danville, Illinois
Based on data reported by over 4,000 weather stations
|
|

Tornado activity:
Danville-area historical tornado activity is near Illinois state average. It is 79% greater than the overall U.S. average.
On 3/20/1976, a category F4 (max. wind speeds 207-260 mph) tornado 5.2 miles away from the Danville city center injured 18 people and caused between $500,000 and $5,000,000 in damages.
On 4/3/1974, a category F3 (max. wind speeds 158-206 mph) tornado 12.3 miles away from the city center caused between $50,000 and $500,000 in damages.
Earthquake activity:
Danville-area historical earthquake activity is significantly above Illinois state average. It is 89% greater than the overall U.S. average.On 4/18/2008 at 09:36:59, a magnitude 5.4 (5.1 MB, 4.8 MS, 5.4 MW, 5.2 MW, Class: Moderate, Intensity: VI - VII) earthquake occurred 117.6 miles away from Danville center
On 6/10/1987 at 23:48:54, a magnitude 5.1 (4.9 MB, 4.4 MS, 4.6 MS, 5.1 LG) earthquake occurred 92.3 miles away from the city center
On 4/18/2008 at 09:36:59, a magnitude 5.2 (5.2 MW, Depth: 8.9 mi) earthquake occurred 117.6 miles away from the city center
On 6/18/2002 at 17:37:15, a magnitude 5.0 (4.3 MB, 4.6 MW, 5.0 LG) earthquake occurred 149.1 miles away from the city center
On 4/18/2008 at 15:14:16, a magnitude 4.8 (4.5 MB, 4.8 MW, 4.6 MW, Class: Light, Intensity: IV - V) earthquake occurred 115.7 miles away from the city center
On 4/3/1974 at 23:05:02, a magnitude 4.7 (4.5 MB, 4.7 LG) earthquake occurred 110.0 miles away from Danville center
Magnitude types: regional Lg-wave magnitude (LG), body-wave magnitude (MB), surface-wave magnitude (MS), moment magnitude (MW)
Natural disasters:
The number of natural disasters in Vermilion County (10) is smaller than the US average (15).Major Disasters (Presidential) Declared: 7
Emergencies Declared: 2
Causes of natural disasters: Storms: 7, Floods: 4, Tornadoes: 4, Hurricane: 1, Ice Storm: 1, Snow: 1, Wind: 1, Other: 1 (Note: some incidents may be assigned to more than one category).

Hospitals in Danville:
- DANVILLE HEALTHCARE LLC (26 WEST NEWELL ROAD)
- PRESENCE UNITED SAMARITANS MEDICAL CENTER (Voluntary non-profit - Church, 812 N LOGAN)
- PROVENA HOSPICE (812 N LOGAN AVE)
- SCHULTZ HOUSE (340 BRYAN AVENUE)
- UNITED SAMARITANS MED CENTER-LOGAN (812 NORTH LOGAN AVE)
- VA ILLIANA HEALTHCARE SYSTEM - DANVILLE (Government Federal, 1900 E. MAIN)
Nursing Homes in Danville:
- COLONIAL MANOR (620 WARRINGTON AVENUE)
- DANVILLE CARE CENTER (1701 NORTH BOWMAN)
- DANVILLE NSG AND REHAB RESIDENCE (207 SOUTH BUCHANAN STREET)
- HAWTHORNE INN OF DANVILLE (3222 INDEPENDENCE DRIVE)
- NORTH LOGAN HEALTHCARE CENTER (801 NORTH LOGAN AVENUE)
- VERMILION MANOR NURSING HOME (14792 CATLIN TILTON ROAD)
Dialysis Facilities in Danville:
Home Health Centers in Danville:
Airports and heliports located in Danville:
- Vermilion Regional Airport (DNV) (Runways: 2, Air Taxi Ops: 1,000, Itinerant Ops: 4,000, Local Ops: 4,850, Military Ops: 150)
- Flying B Ranch Airport (0IL3) (Runways: 1)
- Melody Field Airport (IS88) (Runways: 1)
- Danville Correctional Center Heliport (7IS4)
- Danville V A Heliport (19IL)
- Presence United Samaritans Medical Center Heliport (93IS)
- Welch Heliport (IL00)
Colleges/Universities in Danville:
- Danville Area Community College (Full-time enrollment: 2,229; Location: 2000 E Main St; Public; Website: www.dacc.edu)
- Lakeview College of Nursing (Full-time enrollment: 215; Location: 903 N Logan Ave; Private, not-for-profit; Website: www.lakeviewcol.edu)
- Concept College of Cosmetology (Full-time enrollment: 94; Location: 2500 Georgetown Rd; Private, for-profit; Website: conceptcollege.com)
Other colleges/universities with over 2000 students near Danville:
- University of Illinois at Urbana-Champaign (about 33 miles; Champaign, IL; Full-time enrollment: 47,528)
- Parkland College (about 36 miles; Champaign, IL; FT enrollment: 7,326)
- Purdue University-Main Campus (about 43 miles; West Lafayette, IN; FT enrollment: 38,271)
- Indiana State University (about 48 miles; Terre Haute, IN; FT enrollment: 10,925)
- Rose-Hulman Institute of Technology (about 49 miles; Terre Haute, IN; FT enrollment: 2,123)
- DePauw University (about 54 miles; Greencastle, IN; FT enrollment: 2,360)
- Eastern Illinois University (about 55 miles; Charleston, IL; FT enrollment: 9,414)
Public high schools in Danville:
- DANVILLE HIGH SCHOOL (Students: 1,585, Location: 202 E FAIRCHILD ST, Grades: 9-12)
- MIDDLEFORK SCHOOL RSSP (Location: 15009 CATLIN TILTON RD, Grades: 6-12)
- KENNETH D BAILEY ACADEMY (Location: 502 E MAIN ST, Grades: 7-12)
Private high schools in Danville:
Biggest public elementary/middle schools in Danville:
- EAST PARK ELEMENTARY SCHOOL (Students: 837, Location: 930 COLFAX DR, Grades: PK-5)
- NORTH RIDGE MIDDLE SCHOOL (Students: 802, Location: 1619 N JACKSON ST, Grades: 6-8)
- SOUTH VIEW MIDDLE SCHOOL (Students: 708, Location: 133 E 9TH ST, Grades: 6-8)
- MEADE PARK ELEM SCHOOL (Students: 463, Location: 200 S KANSAS AVE, Grades: KG-5)
- SOUTHWEST ELEM SCHOOL (Students: 452, Location: 14794 CATLIN TILTON RD, Grades: PK-5)
- NORTHEAST ELEM MAGNET SCHOOL (Students: 297, Location: 1330 E ENGLISH ST, Grades: KG-5)
- CANNON ELEM SCHOOL (Students: 259, Location: 1202 E MAIN ST, Grades: KG-5)
- OAKWOOD JUNIOR HIGH SCHOOL (Students: 189, Location: 21600 N 900 EAST RD, Grades: 7-8)
- GARFIELD ELEM SCHOOL (Location: 1101 N GILBERT ST, Grades: KG-5)
- LIBERTY ELEM SCHOOL (Location: 20 E LIBERTY LN, Grades: KG-5)
Private elementary/middle schools in Danville:
Library in Danville:
User-submitted facts and corrections:
- please add Community Church of God to Danville Illinois page. www.dccog.com
- Add to Churches in Danville: Bethel Lutheran Church, Immanuel Lutheran Church, Trinity Lutheran Church
- Danville IL. is also the birthplace of Gene Hackman, Jerry and Dick Van Dyke, and Bobby Short
- Add Carle Clinic to the nearest clinic/doctor section
- The Provena Medical Center School of Radiologic Technology is now closed. Danville Area Community College now houses the Radiologic Technology Program.
Points of interest:
Notable locations in Danville: Vacetta Plaza Industrial Park (A), Eastgate Industrial Park (B), Danville Country Club (C), Childrens Home of Vermilion County (D), Bresee Tower (E), Danville Civic Center (F), Danville Fire Department Station 3 (G), Danville Fire Department Station 4 (H), Webster Memorial Home (I), Danville Fire Department Station 1 (J), Danville City Hall (K), Vermilion County Courthouse (L), Danville Fire Department Station 2 (M), Danville Correctional Center (N), Danville Public Library (O), Medix Emergency Medical Services (P). Display/hide their locations on the map
Shopping Centers: Village Mall Shopping Center (1), Holiday Square Shopping Center (2). Display/hide their locations on the map
Churches in Danville include: Bowman Avenue United Methodist Church (A), Church of the Holy Trinity (B), First Baptist Church (C), First Presbyterian Church (D), Immanuel Lutheran Church (E), Saint James United Methodist Church (F), Trinity Lutheran Church (G), East Park Church of Christ (H), Antioch Temple Pentecostal Church (I). Display/hide their locations on the map
Cemeteries: Sunset Memorial Cemetery (1), Saint Patrick's Cemetery (2), Springhill Cemetery (3), Lutheran Cemetery (4). Display/hide their locations on the map
River: North Fork Vermilion River (A). Display/hide its location on the map
Parks in Danville include: Danville Stadium (1), Elsworth Park (2), Cannon Park (3), Sunset Memorial Park (4), Douglas Park (5), Garfield Park (6), Harrison Park (7), Lincoln Park (8), Meade Park (9). Display/hide their locations on the map
Tourist attractions: Am-Vend CO (Amusement & Theme Parks; 427 East Main Street) (1), Danville Area Convention & Visitors Bureau (100 West Main Street) (2). Display/hide their approximate locations on the map
Hotels: Danville Super 8 Motel (377 Lynch Dr) (1), Action Amusement (1824 East Main Street) (2), Days Inn (77 North Gilbert Street) (3), Harwal Hotel (101 West Harrison Street) (4), Comfort Inn Danville (383 Lynch Drive) (5), Best Western Riverside Inn (57 South Gilbert Street) (6), Days Inn-Danville (77 North Gilbert Street) (7), Comfort Inn (383 Lynch Dr) (8), Coach's Bar & Grille (77 North Gilbert Street) (9). Display/hide their approximate locations on the map
Birthplace of: Mary Ellen Carroll - Performance artist, Charles E. Summers, Jr. - Politician, Helen Morgan - Singer, Isaac R. Moores, Jr. - Politician, Jason Anderson - 2005 Major League Baseball player (New York Yankees, born: Jun 9, 1979), Jason Anderson (baseball) - Baseball player, Jeff Oster - Trumpeter, Jerry Van Dyke - Actor-comedian, Joseph R. Tanner - Astronaut, Joshua Ferris - Author.
Drinking water stations with addresses in Danville and their reported violations in the past:
AQUA ILLINOIS-VERMILION COUNTY (Population served: 38,000, Surface water):Past monitoring violations:AQUA ILLINOIS-PHILO (Population served: 1,300, Purch groundwater):
- Monitoring and Reporting (DBP) - Between OCT-2006 and DEC-2006, Contaminant: Chlorine. Follow-up actions: St Violation/Reminder Notice (DEC-14-2006), St Compliance achieved (DEC-27-2006)
- One minor monitoring violation
Past monitoring violations:AQUA ILLINOIS-INDIANOLA (Population served: 224, Groundwater):
- Lead Consumer Notice - In JAN-02-2010, Contaminant: Lead and Copper Rule. Follow-up actions: St Violation/Reminder Notice (JAN-12-2010), St Compliance achieved (JAN-20-2010)
Past health violations:WOLFCREEK COUNTRY CLUB (Address: 2521 PERRYSVILLE ROAD , Population served: 200, Groundwater):Past monitoring violations:
- MCL, Monthly (TCR) - In SEP-2005, Contaminant: Coliform. Follow-up actions: St Public Notif requested (NOV-03-2005), St Violation/Reminder Notice (NOV-03-2005), St Public Notif received (NOV-14-2005), St Compliance achieved (APR-01-2006)
- One minor monitoring violation
Past health violations:Past monitoring violations:
- MCL, Monthly (TCR) - Between JUL-2007 and SEP-2007, Contaminant: Coliform. Follow-up actions: St Compliance achieved (AUG-22-2007)
- MCL, Monthly (TCR) - Between APR-2006 and JUN-2006, Contaminant: Coliform. Follow-up actions: St Boil Water Order (JUN-05-2006), St Tech Assistance Visit (JUN-07-2006), St Compliance Meeting conducted (JUN-07-2006), St Tech Assistance Visit (NOV-09-2006), St Compliance Meeting conducted (NOV-09-2006), St Compliance achieved (DEC-05-2006)
- One minor monitoring violation
Drinking water stations with addresses in Danville that have no violations reported:
- KENNEKUK COVE COUNTY PARK (Population served: 200, Primary Water Source Type: Groundwater)
- GRAPE CREEK BAPTIST CHURCH (Population served: 125, Primary Water Source Type: Groundwater)
- I&I STEAK HOUSE (Population served: 100, Primary Water Source Type: Groundwater)
- LOYAL ORDER OF MOOSE (Population served: 75, Primary Water Source Type: Groundwater)
- MOON GLO (Population served: 50, Primary Water Source Type: Groundwater)
| This city: | 2.4 people |
| Illinois: | 2.6 people |
| This city: | 60.6% |
| Whole state: | 65.8% |
| This city: | 7.7% |
| Whole state: | 6.3% |
Likely homosexual households (counted as self-reported same-sex unmarried-partner households)
- Lesbian couples: 0.3% of all households
- Gay men: 0.3% of all households
People in group quarters in Danville in 2010:
- 1,839 people in state prisons
- 245 people in local jails and other municipal confinement facilities
- 159 people in nursing facilities/skilled-nursing facilities
- 108 people in group homes intended for adults
- 39 people in other noninstitutional facilities
- 26 people in emergency and transitional shelters (with sleeping facilities) for people experiencing homelessness
- 6 people in residential treatment centers for adults
People in group quarters in Danville in 2000:
- 1,827 people in state prisons
- 376 people in nursing homes
- 139 people in local jails and other confinement facilities (including police lockups)
- 76 people in homes for the mentally retarded
- 34 people in homes for the mentally ill
- 26 people in other noninstitutional group quarters
- 17 people in other nonhousehold living situations
- 12 people in mental (psychiatric) hospitals or wards
- 8 people in homes or halfway houses for drug/alcohol abuse
- 7 people in schools, hospitals, or wards for the intellectually disabled
Banks with branches in Danville (2011 data):
- First Financial Bank, National Association: Fairchild And Gilbert Facility, South Danville Branch, First National Bank Of Danville Bran, North Vermilion Office Branch. Info updated 2012/01/04: Bank assets: $2,852.7 mil, Deposits: $2,227.7 mil, headquarters in Terre Haute, IN, positive income, Commercial Lending Specialization, 66 total offices, Holding Company: First Financial Corporation
- First Midwest Bank: Danville Main Branch, North Vermilion Street Branch, Gilbert Street Facility. Info updated 2011/12/22: Bank assets: $7,848.0 mil, Deposits: $6,529.2 mil, headquarters in Itasca, IL, positive income, Commercial Lending Specialization, 100 total offices, Holding Company: First Midwest Bancorp, Inc.
- Old National Bank: Danville Branch at 2 West Main Street, branch established on 1892/04/15; Danville North Branch at 2431 North Vermilion Street, branch established on 1974/09/06. Info updated 2011/08/01: Bank assets: $8,467.9 mil, Deposits: $6,653.1 mil, headquarters in Evansville, IN, positive income, 195 total offices, Holding Company: Old National Bancorp
- Iroquois Federal Savings and Loan Association: 619 N Gilbert Branch at 619 North Gilbert, branch established on 1883/01/01. Info updated 2011/07/21: Bank assets: $482.6 mil, Deposits: $352.4 mil, headquarters in Watseka, IL, positive income, 5 total offices
- CIBM Bank: Danville Branch at 2490 North Vermillion Street, branch established on 1995/08/01. Info updated 2010/08/18: Bank assets: $500.2 mil, Deposits: $431.1 mil, headquarters in Champaign, IL, negative income in the last year, Commercial Lending Specialization, 14 total offices, Holding Company: Cib Marine Bancshares, Inc.
- First Savings Bank: at 6 West Williams Street, branch established on 1880/01/01. Info updated 2006/11/03: Bank assets: $37.7 mil, Deposits: $24.5 mil, local headquarters, positive income, Mortgage Lending Specialization, 1 total offices
- Woodforest National Bank: Danville Illinois Branch at 4101 North Vermilion, Suite A, branch established on 2007/06/02. Info updated 2011/05/10: Bank assets: $3,488.9 mil, Deposits: $3,097.6 mil, headquarters in Houston, TX, positive income, Commercial Lending Specialization, 766 total offices, Holding Company: Woodforest Financial Group Employee Stock Ownership Plan (With 401(K) Provisions)
- United Community Bank: Danville Branch at 821 N Vermilion, branch established on 1996/05/06. Info updated 2006/11/03: Bank assets: $40.3 mil, Deposits: $36.1 mil, headquarters in Oakwood, IL, positive income, Agricultural Specialization, 2 total offices, Holding Company: Oakwood Bancorp, Inc.
For population 15 years and over in Danville:
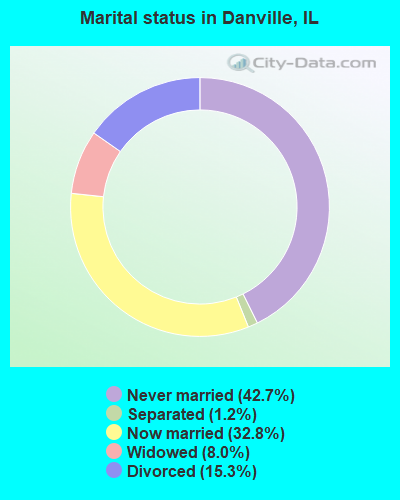
- Never married: 42.7%
- Now married: 32.8%
- Separated: 1.2%
- Widowed: 8.0%
- Divorced: 15.3%
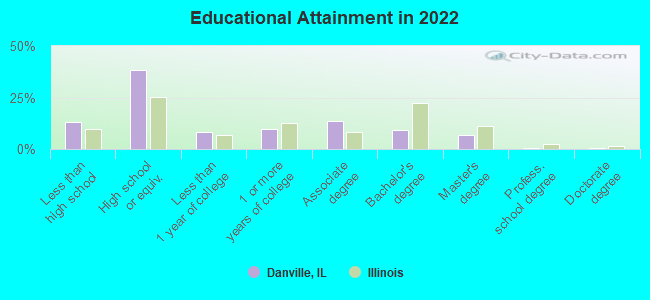
For population 25 years and over in Danville:
- High school or higher: 87.8%
- Bachelor's degree or higher: 17.2%
- Graduate or professional degree: 7.8%
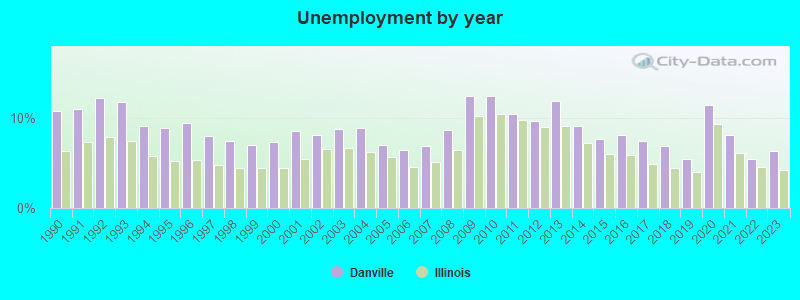
- Unemployed: 9.2%
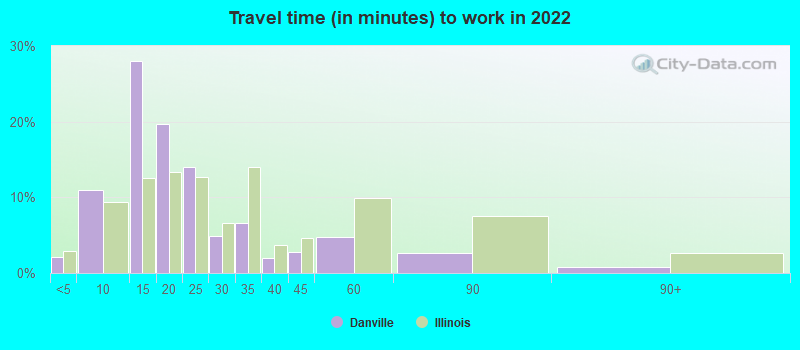
- Mean travel time to work (commute): 14.8 minutes
| Here: | 10.5 |
| Illinois average: | 12.5 |
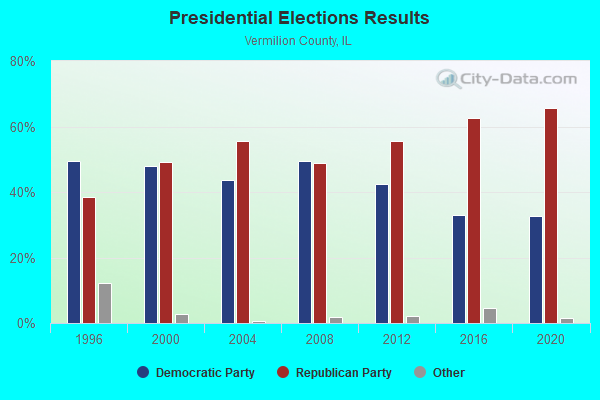
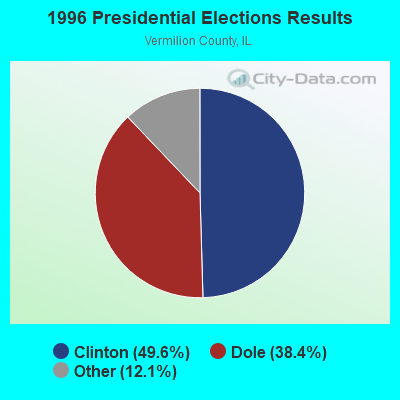
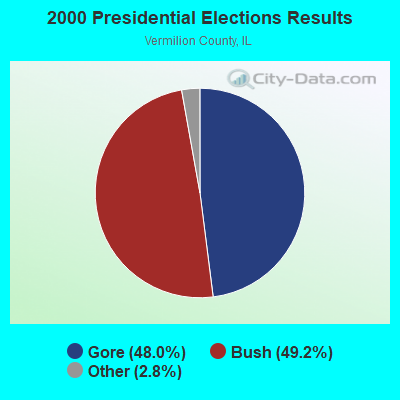
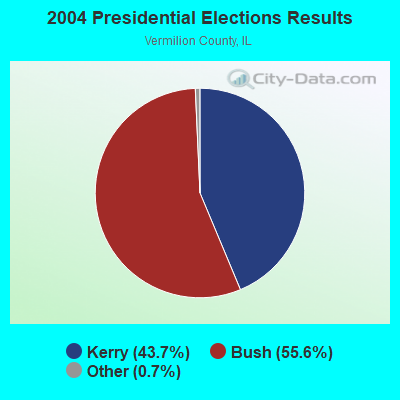
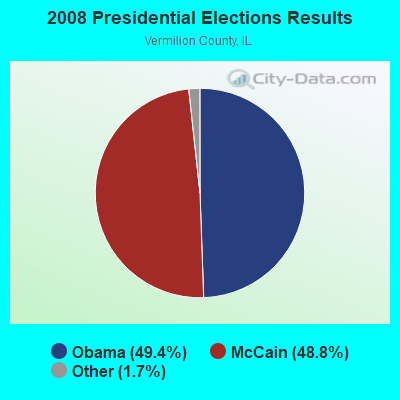
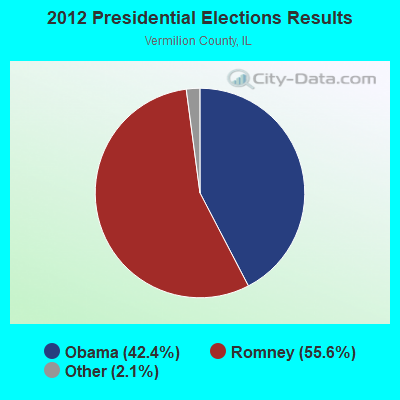
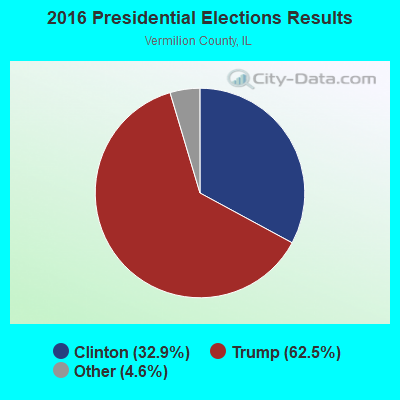
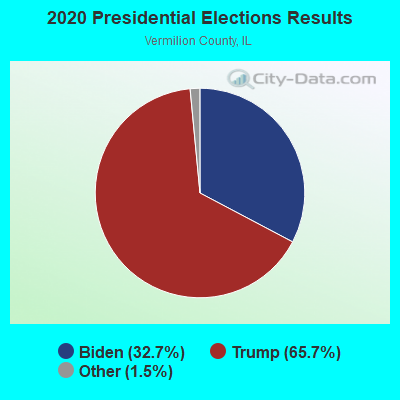
Graphs represent county-level data. Detailed 2008 Election Results
Religion statistics for Danville, IL (based on Vermilion County data)
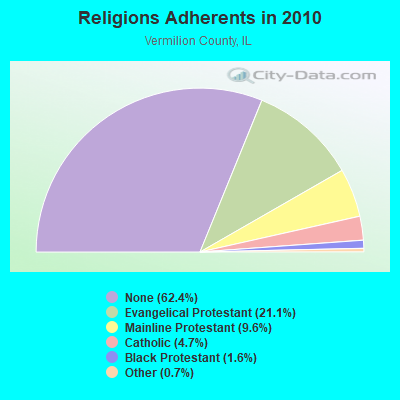
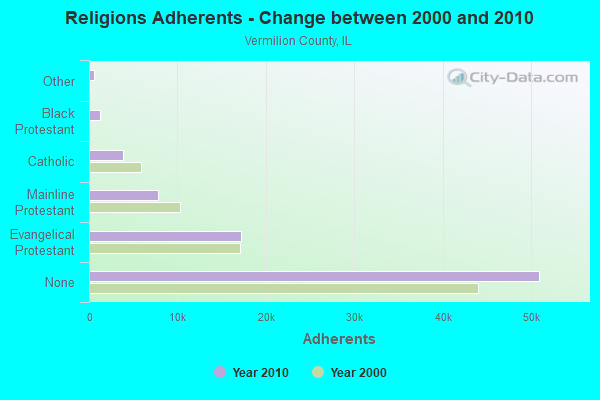
| Religion | Adherents | Congregations |
|---|---|---|
| Evangelical Protestant | 17,200 | 82 |
| Mainline Protestant | 7,817 | 42 |
| Catholic | 3,804 | 5 |
| Black Protestant | 1,285 | 8 |
| Other | 568 | 5 |
| None | 50,951 | - |
Food Environment Statistics:
| This county: | 1.97 / 10,000 pop. |
| Illinois: | 2.24 / 10,000 pop. |
| Here: | 0.12 / 10,000 pop. |
| Illinois: | 0.08 / 10,000 pop. |
| Vermilion County: | 5.05 / 10,000 pop. |
| State: | 2.61 / 10,000 pop. |
| Vermilion County: | 6.41 / 10,000 pop. |
| Illinois: | 6.86 / 10,000 pop. |
| Vermilion County: | 9.5% |
| Illinois: | 8.3% |
| This county: | 28.1% |
| State: | 25.2% |
| This county: | 11.8% |
| State: | 14.5% |
Health and Nutrition:
| Danville: | 49.2% |
| State: | 49.5% |
| Danville: | 45.4% |
| State: | 47.2% |
| Danville: | 29.1 |
| State: | 28.6 |
| Danville: | 20.2% |
| State: | 20.5% |
| Danville: | 12.2% |
| State: | 10.8% |
| Danville: | 6.8 |
| State: | 6.8 |
| Here: | 34.2% |
| Illinois: | 33.4% |
| Here: | 55.1% |
| Illinois: | 56.4% |
| Danville: | 78.5% |
| State: | 79.9% |
More about Health and Nutrition of Danville, IL Residents
| Local government employment and payroll (March 2022) | |||||
| Function | Full-time employees | Monthly full-time payroll | Average yearly full-time wage | Part-time employees | Monthly part-time payroll |
|---|---|---|---|---|---|
| Police Protection - Officers | 65 | $470,332 | $86,831 | 0 | $0 |
| Firefighters | 45 | $354,064 | $94,417 | 0 | $0 |
| Transit | 22 | $96,377 | $52,569 | 6 | $20,168 |
| Local Libraries | 20 | $70,678 | $42,407 | 14 | $19,151 |
| Financial Administration | 16 | $74,803 | $56,102 | 0 | $0 |
| Streets and Highways | 15 | $81,174 | $64,939 | 1 | $638 |
| Other and Unallocable | 13 | $57,645 | $53,211 | 0 | $0 |
| Sewerage | 13 | $68,309 | $63,054 | 0 | $0 |
| Solid Waste Management | 12 | $60,147 | $60,147 | 0 | $0 |
| Police - Other | 12 | $40,096 | $40,096 | 1 | $1,488 |
| Other Government Administration | 9 | $42,554 | $56,739 | 14 | $3,150 |
| Parks and Recreation | 8 | $31,275 | $46,913 | 6 | $6,922 |
| Judicial and Legal | 4 | $22,154 | $66,462 | 0 | $0 |
| Fire - Other | 2 | $11,355 | $68,130 | 0 | $0 |
| Welfare | 0 | $0 | 1 | $542 | |
| Totals for Government | 256 | $1,480,961 | $69,420 | 43 | $52,059 |
Danville government finances - Expenditure in 2021 (per resident):
- Construction - Central Staff Services: $910,000 ($31.96)
- Current Operations - General - Other: $20,415,000 ($717.02)
Financial Administration: $5,796,000 ($203.57)
Local Fire Protection: $4,548,000 ($159.74)
Police Protection: $3,990,000 ($140.14)
Regular Highways: $3,679,000 ($129.21)
Solid Waste Management: $2,213,000 ($77.73)
Sewerage: $2,209,000 ($77.58)
Libraries: $1,863,000 ($65.43)
Parks and Recreation: $1,845,000 ($64.80)
- General - Interest on Debt: $147,000 ($5.16)
- Total Salaries and Wages: $14,549,000 ($510.99)
Danville government finances - Revenue in 2021 (per resident):
- Charges - Other: $7,172,000 ($251.90)
Parks and Recreation: $3,000 ($0.11)
- Federal Intergovernmental - Other: $1,657,000 ($58.20)
Housing and Community Development: $1,287,000 ($45.20)
Highways: $165,000 ($5.80)
- Miscellaneous - General Revenue - Other: $3,481,000 ($122.26)
Fines and Forfeits: $327,000 ($11.48)
Interest Earnings: $44,000 ($1.55)
- State Intergovernmental - General Local Government Support: $23,682,000 ($831.76)
Other: $2,377,000 ($83.49)
Highways: $2,273,000 ($79.83)
Transit Utilities: $1,835,000 ($64.45)
- Tax - Property: $13,396,000 ($470.50)
General Sales and Gross Receipts: $2,729,000 ($95.85)
Other License: $767,000 ($26.94)
Danville government finances - Debt in 2021 (per resident):
- Long Term Debt - Beginning Outstanding - Unspecified Public Purpose: $3,935,000 ($138.21)
Outstanding Unspecified Public Purpose: $3,187,000 ($111.93)
Retired Unspecified Public Purpose: $748,000 ($26.27)
Danville government finances - Cash and Securities in 2021 (per resident):
- Other Funds - Cash and Securities: $30,433,000 ($1068.87)
| Businesses in Danville, IL | ||||
| Name | Count | Name | Count | |
|---|---|---|---|---|
| AT&T | 1 | Little Caesars Pizza | 2 | |
| Advance Auto Parts | 1 | Long John Silver's | 1 | |
| Arby's | 2 | Lowe's | 1 | |
| AutoZone | 1 | Marriott | 1 | |
| Bath & Body Works | 1 | MasterBrand Cabinets | 5 | |
| Best Western | 2 | Maurices | 1 | |
| Blockbuster | 1 | McDonald's | 2 | |
| Buffalo Wild Wings | 1 | Menards | 1 | |
| Burger King | 2 | New Balance | 1 | |
| CVS | 2 | Nike | 4 | |
| Carson Pirie Scott | 1 | OfficeMax | 1 | |
| Circle K | 3 | Papa John's Pizza | 1 | |
| Comfort Inn | 1 | Payless | 2 | |
| Curves | 1 | Penske | 1 | |
| Dairy Queen | 2 | Pizza Hut | 1 | |
| Deb | 1 | RadioShack | 1 | |
| Domino's Pizza | 1 | Red Lobster | 1 | |
| Fashion Bug | 1 | SAS Shoes | 1 | |
| FedEx | 5 | Sears | 2 | |
| Finish Line | 1 | Sleep Inn | 1 | |
| Ford | 1 | Steak 'n Shake | 2 | |
| GNC | 1 | Subway | 3 | |
| GameStop | 1 | Super 8 | 2 | |
| H&R Block | 2 | T-Mobile | 1 | |
| Hardee's | 1 | Taco Bell | 2 | |
| Hilton | 1 | U-Haul | 5 | |
| Holiday Inn | 1 | UPS | 10 | |
| Honda | 1 | Vans | 1 | |
| Hyundai | 1 | Walgreens | 2 | |
| Jones New York | 2 | Walmart | 1 | |
| KFC | 1 | Wendy's | 2 | |
| Kmart | 1 | YMCA | 1 | |
| Lane Furniture | 1 | |||
Strongest AM radio stations in Danville:
- WDAN (1490 AM; 1 kW; DANVILLE, IL; Owner: NEUHOFF BROADCASTING - DANVILLE, INC)
- WITY (980 AM; 1 kW; DANVILLE, IL; Owner: VERMILION BROADCASTING CORPORATION)
- WIBC (1070 AM; 50 kW; INDIANAPOLIS, IN; Owner: EMMIS RADIO LICENSE CORPORATION)
- WILL (580 AM; 5 kW; URBANA, IL; Owner: UNIV. OF ILLINOIS BOARD OF TRUSTEES)
- WLS (890 AM; 50 kW; CHICAGO, IL; Owner: WLS, INC.)
- WSCR (670 AM; 50 kW; CHICAGO, IL; Owner: INFINITY BROADCASTING OPERATIONS, INC.)
- WYLL (1160 AM; 50 kW; CHICAGO, IL; Owner: SCA LICENSE CORPORATION)
- WGN (720 AM; 50 kW; CHICAGO, IL; Owner: WGN CONTINENTAL BROADCASTING CO.)
- WBBM (780 AM; 50 kW; CHICAGO, IL; Owner: INFINITY BROADCASTING OPERATIONS, INC.)
- WMVP (1000 AM; 50 kW; CHICAGO, IL; Owner: ABC, INC.)
- WBAA (920 AM; 5 kW; WEST LAFAYETTE, IN; Owner: PURDUE UNIVERSITY)
- WOWO (1190 AM; 50 kW; FORT WAYNE, IN; Owner: PATHFINDER COMMUNICATIONS CORPORATION)
- WTMJ (620 AM; 50 kW; MILWAUKEE, WI; Owner: JOURNAL BROADCAST CORPORATION)
Strongest FM radio stations in Danville:
- WDNL (102.1 FM; DANVILLE, IL; Owner: NEUHOFF BROADCASTING - DANVILLE, INC)
- W293AF (106.5 FM; DANVILLE, IL; Owner: TRUSTEES OF UNIVERSITY OF ILLINOIS)
- WXLS (99.1 FM; DANVILLE, IL; Owner: I.A.I. BROADCASTING, INC.)
- WRHK (94.9 FM; DANVILLE, IL; Owner: NEUHOFF BROADCASTING - DANVILLE, INC)
- WKZS (103.1 FM; COVINGTON, IN; Owner: BENTON-WEATHERFORD BROADCASTING , INC., OF IN.)
- WFOF (90.3 FM; COVINGTON, IN; Owner: DOXA, INCORP.)
- WGNJ (89.3 FM; ST. JOSEPH, IL; Owner: GOOD NEWS RADIO, INC.)
- WSKL (92.9 FM; VEEDERSBURG, IN; Owner: ZONA COMMUNICATIONS, INC.)
- WBGL (91.7 FM; CHAMPAIGN, IL; Owner: ILLINOIS BIBLE INSTITUTE,INC)
- WKIO (92.5 FM; URBANA, IL; Owner: SAGA COMMUNICATIONS OF ILLINOIS, LLC)
- W216BB (91.1 FM; WILLIAMSPORT, IN; Owner: PENSACOLA CHRISTIAN COLLEGE, INC.)
- WIXY (100.3 FM; CHAMPAIGN, IL; Owner: SAGA COMMUNICATIONS OF ILLINOIS, LLC)
- WEVX (95.3 FM; RANTOUL, IL; Owner: AAA ENTERTAINMENT LICENSING LLC)
- WAZY-FM (96.5 FM; LAFAYETTE, IN; Owner: ARTISTIC MEDIA PARTNERS L.P.)
- WHPO (100.9 FM; HOOPESTON, IL; Owner: MARKET STREET BROADCASTING, LLC)
TV broadcast stations around Danville:
- W31BX (Channel 31; DANVILLE, IL; Owner: WAND(TV) PARTNERSHIP)
- WICD (Channel 15; CHAMPAIGN, IL; Owner: WICD LICENSEE, LLC)
- WCIA (Channel 3; CHAMPAIGN, IL; Owner: NEXSTAR BROADCASTING OF CHAMPAIGN, L.L.C.)
- W34CD (Channel 34; QUINCY, IL; Owner: MS COMMUNICATIONS, LLC)
- W52BR (Channel 52; CHAMPAIGN-URBANA, IL; Owner: MARCIA COHEN)
- WCCU (Channel 27; URBANA, IL; Owner: URBANA-CHAMPAIGN BROADCASTING PARTNERS)
- W58DA (Channel 58; CHAMPAIGN, IL; Owner: TRINITY BROADCASTING NETWORK)
- National Bridge Inventory (NBI) Statistics
- 109Number of bridges
- 1,342ft / 409mTotal length
- $5,187,000Total costs
- 605,945Total average daily traffic
- 128,405Total average daily truck traffic
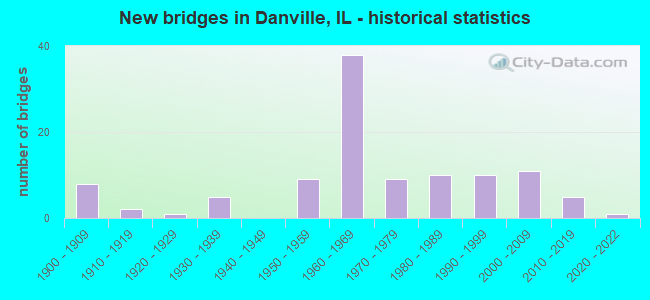
- New bridges - historical statistics
- 81900-1909
- 21910-1919
- 11920-1929
- 51930-1939
- 91950-1959
- 381960-1969
- 91970-1979
- 101980-1989
- 101990-1999
- 112000-2009
- 52010-2019
- 12020-2022
FCC Registered Antenna Towers: 227 (See the full list of FCC Registered Antenna Towers)
FCC Registered Commercial Land Mobile Towers: 1 (See the full list of FCC Registered Commercial Land Mobile Towers in Danville, IL)
FCC Registered Private Land Mobile Towers: 4 (See the full list of FCC Registered Private Land Mobile Towers)
FCC Registered Broadcast Land Mobile Towers: 53 (See the full list of FCC Registered Broadcast Land Mobile Towers)
FCC Registered Microwave Towers: 21 (See the full list of FCC Registered Microwave Towers in this town)
FCC Registered Paging Towers: 4 (See the full list of FCC Registered Paging Towers)
FCC Registered Maritime Coast & Aviation Ground Towers: 3 (See the full list of FCC Registered Maritime Coast & Aviation Ground Towers)
FCC Registered Amateur Radio Licenses: 217 (See the full list of FCC Registered Amateur Radio Licenses in Danville)
FAA Registered Aircraft: 40 (See the full list of FAA Registered Aircraft in Danville)
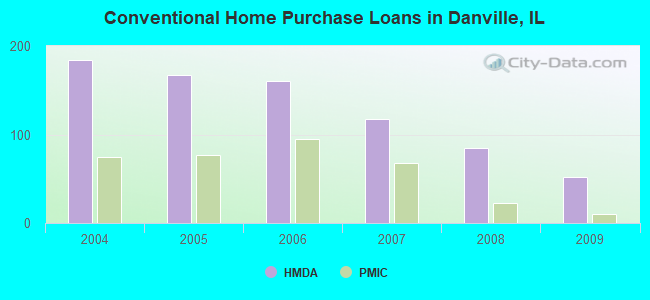
| Home Mortgage Disclosure Act Aggregated Statistics For Year 2009 (Based on 4 full and 9 partial tracts) | ||||||||||||||
| A) FHA, FSA/RHS & VA Home Purchase Loans | B) Conventional Home Purchase Loans | C) Refinancings | D) Home Improvement Loans | E) Loans on Dwellings For 5+ Families | F) Non-occupant Loans on < 5 Family Dwellings (A B C & D) | G) Loans On Manufactured Home Dwelling (A B C & D) | ||||||||
|---|---|---|---|---|---|---|---|---|---|---|---|---|---|---|
| Number | Average Value | Number | Average Value | Number | Average Value | Number | Average Value | Number | Average Value | Number | Average Value | Number | Average Value | |
| LOANS ORIGINATED | 30 | $73,431 | 52 | $58,952 | 119 | $71,611 | 27 | $24,629 | 4 | $178,908 | 43 | $43,319 | 2 | $18,985 |
| APPLICATIONS APPROVED, NOT ACCEPTED | 0 | $0 | 1 | $182,420 | 11 | $91,395 | 2 | $27,310 | 0 | $0 | 1 | $51,330 | 0 | $0 |
| APPLICATIONS DENIED | 8 | $58,031 | 13 | $63,526 | 58 | $75,022 | 26 | $20,932 | 1 | $68,000 | 11 | $40,768 | 1 | $40,940 |
| APPLICATIONS WITHDRAWN | 3 | $113,867 | 3 | $90,677 | 35 | $103,963 | 3 | $32,420 | 0 | $0 | 0 | $0 | 0 | $0 |
| FILES CLOSED FOR INCOMPLETENESS | 1 | $53,900 | 1 | $38,450 | 6 | $120,917 | 1 | $96,710 | 0 | $0 | 0 | $0 | 0 | $0 |
Detailed mortgage data for all 12 tracts in Danville, IL
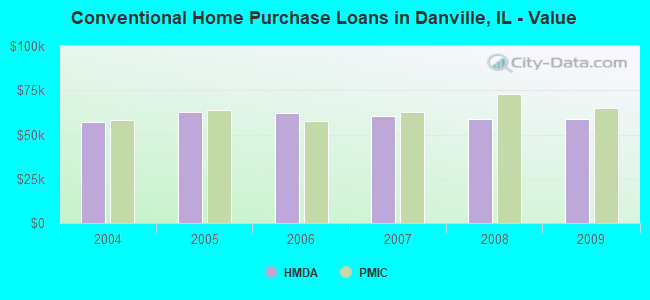
| Private Mortgage Insurance Companies Aggregated Statistics For Year 2009 (Based on 3 full and 8 partial tracts) | ||||
| A) Conventional Home Purchase Loans | B) Refinancings | |||
|---|---|---|---|---|
| Number | Average Value | Number | Average Value | |
| LOANS ORIGINATED | 10 | $64,906 | 7 | $95,841 |
| APPLICATIONS APPROVED, NOT ACCEPTED | 3 | $109,590 | 2 | $96,500 |
| APPLICATIONS DENIED | 1 | $59,530 | 2 | $164,330 |
| APPLICATIONS WITHDRAWN | 0 | $0 | 0 | $0 |
| FILES CLOSED FOR INCOMPLETENESS | 0 | $0 | 0 | $0 |
2002 - 2018 National Fire Incident Reporting System (NFIRS) incidents
- Fire incident types reported to NFIRS in Danville, IL
- 1,82145.8%Structure Fires
- 1,45836.7%Outside Fires
- 54613.7%Mobile Property/Vehicle Fires
- 1503.8%Other
 Based on the data from the years 2002 - 2018 the average number of fire incidents per year is 234. The highest number of fire incidents - 310 took place in 2005, and the least - 106 in 2002. The data has an increasing trend.
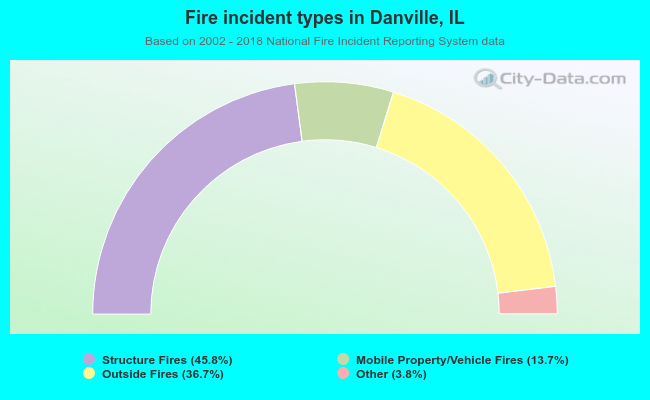 When looking into fire subcategories, the most incidents belonged to: Structure Fires (45.8%), and Outside Fires (36.7%).
Fire-safe hotels and motels in Danville, Illinois:
- Red Roof Inn & Suites, 389 Lynch Dr, Danville, Illinois 61832 , Phone: (217) 443-3388
- Harwal Hotel, 101 W Harrison St, Danville, Illinois 61832 , Phone: (217) 446-7784
- Best Western Riverside Inn, 57 S Gilbert St, Danville, Illinois 61832 , Phone: (217) 431-0020, Fax: (217) 431-8980
- Sleep Inn & Suites, 361 Lynch Dr, Danville, Illinois 61834 , Phone: (217) 442-6600, Fax: (217) 442-1350
- Danville Super 8, 377 Lynch Dr, Danville, Illinois 61834 , Phone: (217) 443-4499, Fax: (217) 443-4499
- Holiday Inn Express & Suits, 310 Eastgate Dr, Danville, Illinois 61834 , Phone: (217) 442-2500, Fax: (217) 442-2525
- Hampton Inn & Suites, 370 Eastgate Dr, Danville, Illinois 61834 , Phone: (217) 442-3300, Fax: (217) 442-3303
| Most common first names in Danville, IL among deceased individuals | ||
| Name | Count | Lived (average) |
|---|---|---|
| John | 533 | 73.2 years |
| William | 527 | 72.4 years |
| Mary | 495 | 78.4 years |
| Robert | 444 | 69.3 years |
| James | 382 | 70.5 years |
| Charles | 355 | 71.1 years |
| Helen | 293 | 79.3 years |
| George | 271 | 73.6 years |
| Ruth | 223 | 80.1 years |
| Joseph | 200 | 72.6 years |
| Most common last names in Danville, IL among deceased individuals | ||
| Last name | Count | Lived (average) |
|---|---|---|
| Smith | 281 | 75.4 years |
| Johnson | 217 | 73.5 years |
| Miller | 179 | 74.1 years |
| Jones | 158 | 76.2 years |
| Brown | 142 | 73.4 years |
| Williams | 137 | 73.6 years |
| Davis | 117 | 73.6 years |
| Martin | 105 | 72.5 years |
| Wilson | 100 | 75.1 years |
| Taylor | 85 | 75.1 years |
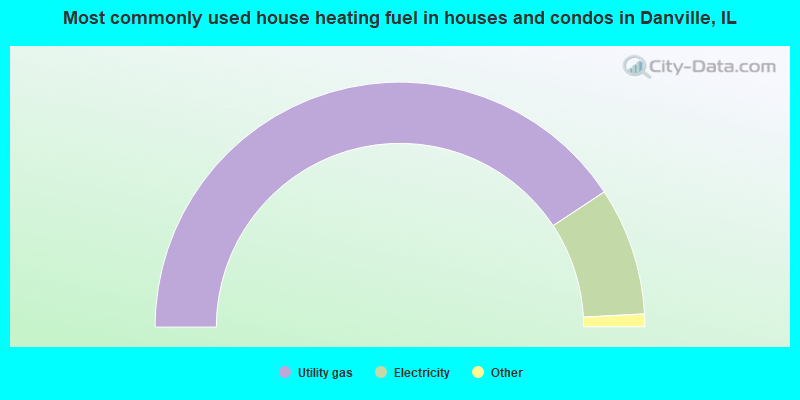
- 81.4%Utility gas
- 16.9%Electricity
- 0.6%Wood
- 0.5%No fuel used
- 0.5%Bottled, tank, or LP gas
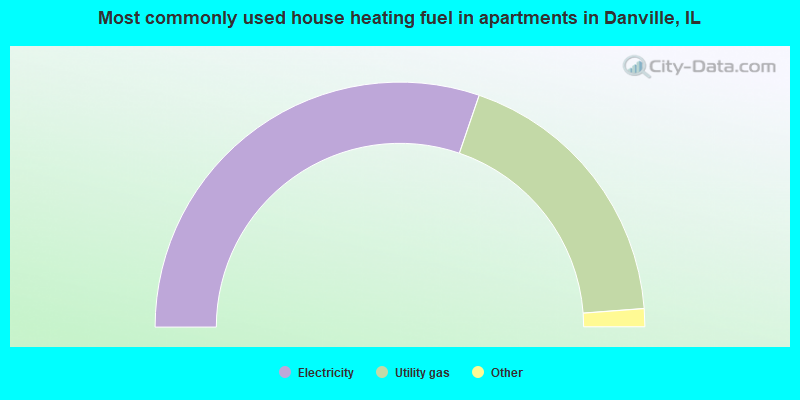
- 60.5%Electricity
- 37.1%Utility gas
- 1.5%No fuel used
- 0.5%Bottled, tank, or LP gas
- 0.4%Other fuel
Danville compared to Illinois state average:
- Median household income below state average.
- Median house value significantly below state average.
- Black race population percentage above state average.
- Hispanic race population percentage below state average.
- Foreign-born population percentage significantly below state average.
- House age above state average.
- Institutionalized population percentage significantly above state average.
- Number of college students below state average.
- Percentage of population with a bachelor's degree or higher below state average.
Danville on our top lists:
- #85 on the list of "Top 101 cities with the highest number of rapes per 100,000 residents, excludes tourist destinations and others with a lot of outsiders visiting based on city industries data (population 5,000+)"
- #88 on the list of "Top 100 cities with lowest ratio of median house value to median household income (pop. 5,000+)"
- #89 on the list of "Top 101 cities with the lowest cost per building permit(population 5,000+)"
- #44 on the list of "Top 101 counties with the lowest percentage of residents relocating to foreign countries in 2011"
- #57 on the list of "Top 101 counties with the lowest percentage of residents relocating from other counties between 2010 and 2011 (pop. 50,000+)"
- #78 on the list of "Top 101 counties with the lowest percentage of residents relocating to other counties in 2011 (pop. 50,000+)"
- #93 on the list of "Top 101 counties with the highest number of deaths per 1000 residents 2007-2013 (pop. 50,000+)"

|
|
Total of 27 patent applications in 2008-2024.