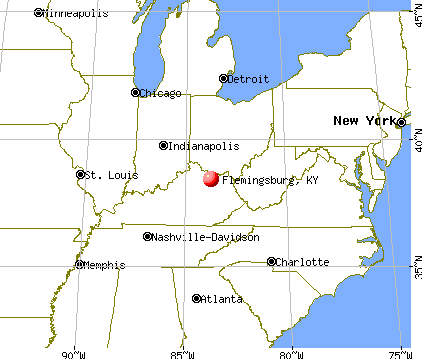
Flemingsburg, Kentucky
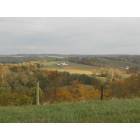
Submit your own pictures of this city and show them to the world
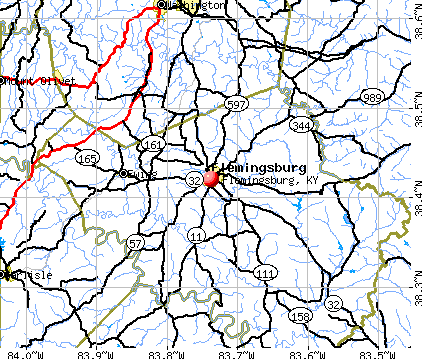
- OSM Map
- General Map
- Google Map
- MSN Map
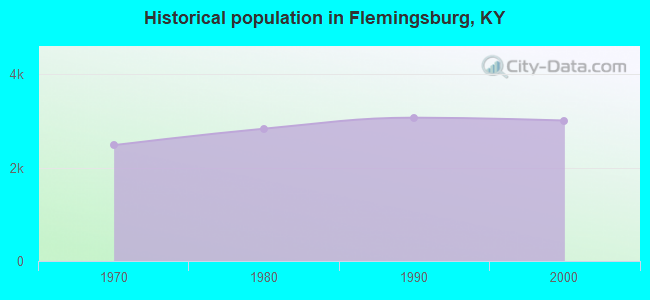
Population change since 2000: -1.4%
| Males: 1,542 | |
| Females: 1,427 |
| Median resident age: | 32.4 years |
| Kentucky median age: | 39.4 years |
Zip codes: 41041.
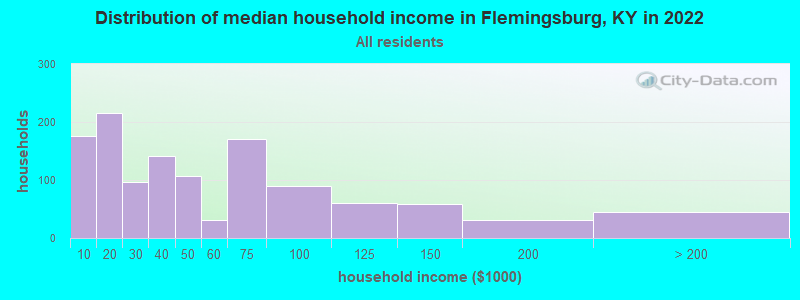
| Flemingsburg: | $37,327 |
| KY: | $59,341 |
Estimated per capita income in 2022: $25,237 (it was $14,914 in 2000)
Flemingsburg city income, earnings, and wages data
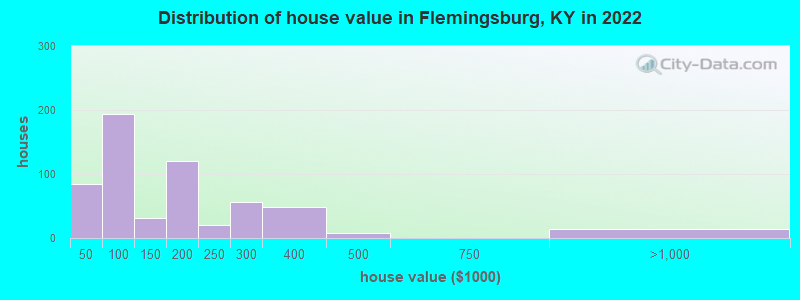
Estimated median house or condo value in 2022: $115,118 (it was $58,200 in 2000)
| Flemingsburg: | $115,118 |
| KY: | $196,300 |
Mean prices in 2022: all housing units: $161,584; detached houses: $190,087; mobile homes: $60,343
Median gross rent in 2022: $628.
(41.2% for White Non-Hispanic residents, 42.9% for Black residents, 0.5% for Hispanic or Latino residents)
Detailed information about poverty and poor residents in Flemingsburg, KY
Compare current foreclosures near Flemingsburg, KY:
| Photo | Address | Area | Beds / Baths | Price | Details |
|---|---|---|---|---|---|

|
#1
Mills Ave
Flemingsburg, KY 41041
|
1,588 sq. feet
|
2 baths 4 beds |
show details | |

|
#2
Marys Ave
Flemingsburg, KY 41041
|
960 sq. feet
|
1 baths 3 beds |
show details | |

|
#3
Bradley Dr
Flemingsburg, KY 41041
|
1,568 sq. feet
|
2 baths 3 beds |
show details | |

|
#4
Wallingford Rd
Flemingsburg, KY 41041
|
1,456 sq. feet
|
2 baths 3 beds |
show details | |

|
#5
High Ridge Dr
Flemingsburg, KY 41041
|
880 sq. feet
|
2 baths 3 beds |
show details | |

|
#6
Poplar Plains Rd
Flemingsburg, KY 41041
|
- sq. feet
|
- baths - beds |
show details | |

|
#7
Stacy Ln
Flemingsburg, KY 41041
|
- sq. feet
|
- baths - beds |
show details | |

|
#8
W Elm St
Flemingsburg, KY 41041
|
- sq. feet
|
- baths - beds |
show details | |

|
#9
Glascock Dr
Flemingsburg, KY 41041
|
- sq. feet
|
- baths - beds |
show details | |

|
#10
Annadd Dr
Flemingsburg, KY 41041
|
- sq. feet
|
- baths - beds |
show details |
| Photo | Address | Area | Beds / Baths | Price | Details |
|---|---|---|---|---|---|

|
#11
Cullen St
Flemingsburg, KY 41041
|
- sq. feet
|
- baths - beds |
show details | |

|
#12
Hart Ln
Flemingsburg, KY 41041
|
- sq. feet
|
- baths - beds |
show details | |

|
#13
Ky Hwy 1234 S
Maysville, KY 41056
|
1,800 sq. feet
|
2 baths 3 beds |
$305,900
|
show details |

|
#14
Ash St
Maysville, KY 41056
|
832 sq. feet
|
1 baths 2 beds |
show details | |

|
#15
Orangeburg Rd
Maysville, KY 41056
|
1,328 sq. feet
|
2 baths 2 beds |
show details | |

|
#16
Mason Lewis Rd
Maysville, KY 41056
|
1,426 sq. feet
|
1 baths 3 beds |
show details | |

|
#17
Canebrake Dr
Maysville, KY 41056
|
1,050 sq. feet
|
1 baths 3 beds |
show details | |

|
#18
Cedarwood Dr
Maysville, KY 41056
|
1,377 sq. feet
|
2 baths 3 beds |
show details | |

|
#19
Us Highway 62
Maysville, KY 41056
|
1,794 sq. feet
|
2 baths 3 beds |
show details | |

|
#20
Joyce Ann Cir
Maysville, KY 41056
|
1,128 sq. feet
|
1 baths 3 beds |
show details |
| Photo | Address | Area | Beds / Baths | Price | Details |
|---|---|---|---|---|---|

|
#21
Florence St
Maysville, KY 41056
|
870 sq. feet
|
1 baths 2 beds |
show details | |

|
#22
Lexington Pike
Maysville, KY 41056
|
2,388 sq. feet
|
2 baths 4 beds |
show details | |

|
#23
Ash St
Maysville, KY 41056
|
1,320 sq. feet
|
1 baths 2 beds |
show details | |

|
#24
Cottage St
Maysville, KY 41056
|
1,148 sq. feet
|
1 baths 3 beds |
show details | |

|
#25
Bridge St
Maysville, KY 41056
|
1,870 sq. feet
|
1 baths 3 beds |
show details | |

|
#26
Walnut Ln
Maysville, KY 41056
|
2,016 sq. feet
|
2 baths 4 beds |
show details | |

|
#27
Mason Lewis Rd
Maysville, KY 41056
|
1,500 sq. feet
|
2 baths 4 beds |
show details | |

|
#28
Scrubgrass Rd
Carlisle, KY 40311
|
974 sq. feet
|
1 baths 3 beds |
show details | |

|
#29
Jersey Ridge Rd
Maysville, KY 41056
|
10,000 sq. feet
|
1 baths 2 beds |
show details | |

|
#30
Hinton Dr
Maysville, KY 41056
|
1,456 sq. feet
|
1 baths 3 beds |
show details |
| Photo | Address | Area | Beds / Baths | Price | Details |
|---|---|---|---|---|---|

|
#31
Hinton Dr
Maysville, KY 41056
|
1,640 sq. feet
|
2 baths 3 beds |
show details | |

|
#32
Mason Lewis Rd
Maysville, KY 41056
|
1,848 sq. feet
|
1 baths 3 beds |
show details | |

|
#33
Moorefield Rd
Carlisle, KY 40311
|
992 sq. feet
|
1 baths 2 beds |
show details | |

|
#34
Muses Mill Rd
Wallingford, KY 41093
|
976 sq. feet
|
1 baths 2 beds |
show details | |

|
#35
Murphysville Rd
Maysville, KY 41056
|
913 sq. feet
|
1 baths 2 beds |
show details | |

|
#36
Owen Davis Dr
Ewing, KY 41039
|
1,232 sq. feet
|
1 baths 3 beds |
show details | |

|
#37
Elizaville Rd
Ewing, KY 41039
|
2,356 sq. feet
|
1 baths 4 beds |
show details | |

|
#38
Sunset Rd
Hillsboro, KY 41049
|
1,344 sq. feet
|
2 baths 3 beds |
show details | |

|
#39
Helena Rd
Mayslick, KY 41055
|
7,344 sq. feet
|
2 baths 3 beds |
show details | |

|
#40
Old Sardis Pike
Mayslick, KY 41055
|
1,770 sq. feet
|
2 baths 3 beds |
show details |
| Photo | Address | Area | Beds / Baths | Price | Details |
|---|---|---|---|---|---|

|
#41
Ky Highway 11
Mayslick, KY 41055
|
2,652 sq. feet
|
2 baths 3 beds |
show details | |

|
#42
Mudsock Rd
Hillsboro, KY 41049
|
2,240 sq. feet
|
- baths 4 beds |
show details | |

|
#43
Washington St
Aberdeen, OH 45101
|
1,032 sq. feet
|
1 baths - beds |
show details | |

|
#44
Ky 57
Tollesboro, KY 41189
|
- sq. feet
|
1 baths 2 beds |
show details | |

|
#45
Polecat Pike
Maysville, KY 41056
|
- sq. feet
|
- baths - beds |
show details | |

|
#46
Wilder Loop Rd
Wallingford, KY 41093
|
980 sq. feet
|
- baths - beds |
show details | |

|
#47
Pumpelly Ln
Mayslick, KY 41055
|
- sq. feet
|
- baths - beds |
show details | |

|
#48
Nepton Rd
Ewing, KY 41039
|
- sq. feet
|
- baths - beds |
show details | |

|
#49
Pumpelly Ln
Mayslick, KY 41055
|
- sq. feet
|
- baths - beds |
show details | |

|
Check over 1 million property listings on Foreclosure.com!
|
browse all offers | |||


- 2,55486.3%White alone
- 2227.5%Hispanic
- 1163.9%Two or more races
- 672.3%Black alone
- 110.4%Other race alone
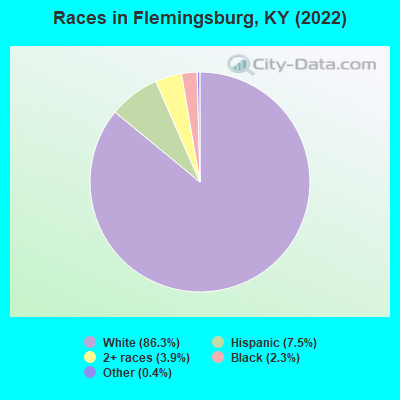
Races in Flemingsburg detailed stats: ancestries, foreign born residents, place of birth
According to our research of Kentucky and other state lists, there were 15 registered sex offenders living in Flemingsburg, Kentucky as of June 10, 2024.
The ratio of all residents to sex offenders in Flemingsburg is 193 to 1.
Type |
2009 |
2010 |
2011 |
2012 |
2013 |
2014 |
2015 |
2016 |
2017 |
2018 |
2019 |
2020 |
2021 |
2022 |
|---|---|---|---|---|---|---|---|---|---|---|---|---|---|---|
| Murders (per 100,000) | 0 (0.0) | 0 (0.0) | 0 (0.0) | 0 (0.0) | 0 (0.0) | 0 (0.0) | 0 (0.0) | 0 (0.0) | 0 (0.0) | 0 (0.0) | 0 (0.0) | 0 (0.0) | 0 (0.0) | 0 (0.0) |
| Rapes (per 100,000) | 0 (0.0) | 0 (0.0) | 0 (0.0) | 0 (0.0) | 0 (0.0) | 0 (0.0) | 0 (0.0) | 1 (34.5) | 0 (0.0) | 2 (70.9) | 1 (35.7) | 1 (35.7) | 1 (35.7) | 1 (34.0) |
| Robberies (per 100,000) | 0 (0.0) | 0 (0.0) | 1 (37.4) | 0 (0.0) | 0 (0.0) | 1 (37.1) | 0 (0.0) | 0 (0.0) | 0 (0.0) | 0 (0.0) | 0 (0.0) | 0 (0.0) | 0 (0.0) | 0 (0.0) |
| Assaults (per 100,000) | 1 (37.3) | 0 (0.0) | 1 (37.4) | 1 (37.1) | 0 (0.0) | 0 (0.0) | 0 (0.0) | 1 (34.5) | 1 (34.9) | 1 (35.4) | 1 (35.7) | 1 (35.7) | 2 (71.4) | 2 (68.0) |
| Burglaries (per 100,000) | 21 (783.0) | 16 (602.0) | 14 (523.2) | 12 (445.6) | 6 (222.1) | 15 (555.8) | 8 (295.3) | 14 (482.4) | 7 (244.2) | 5 (177.2) | 7 (249.9) | 15 (535.7) | 7 (250.0) | 18 (611.6) |
| Thefts (per 100,000) | 39 (1,454) | 23 (865.3) | 20 (747.4) | 42 (1,560) | 37 (1,369) | 14 (518.7) | 20 (738.3) | 25 (861.5) | 29 (1,012) | 32 (1,134) | 32 (1,142) | 30 (1,071) | 33 (1,179) | 20 (679.6) |
| Auto thefts (per 100,000) | 6 (223.7) | 0 (0.0) | 1 (37.4) | 2 (74.3) | 4 (148.0) | 1 (37.1) | 2 (73.8) | 4 (137.8) | 2 (69.8) | 8 (283.5) | 2 (71.4) | 6 (214.3) | 3 (107.1) | 3 (101.9) |
| Arson (per 100,000) | 0 (0.0) | 0 (0.0) | 0 (0.0) | 1 (37.1) | 0 (0.0) | 0 (0.0) | 0 (0.0) | 0 (0.0) | 0 (0.0) | 0 (0.0) | 0 (0.0) | 2 (71.4) | 0 (0.0) | 1 (34.0) |
| City-Data.com crime index | 138.3 | 76.7 | 88.2 | 106.9 | 82.2 | 73.7 | 56.1 | 113.7 | 70.1 | 144.2 | 104.6 | 133.2 | 116.1 | 118.9 |
The City-Data.com crime index weighs serious crimes and violent crimes more heavily. Higher means more crime, U.S. average is 246.1. It adjusts for the number of visitors and daily workers commuting into cities.
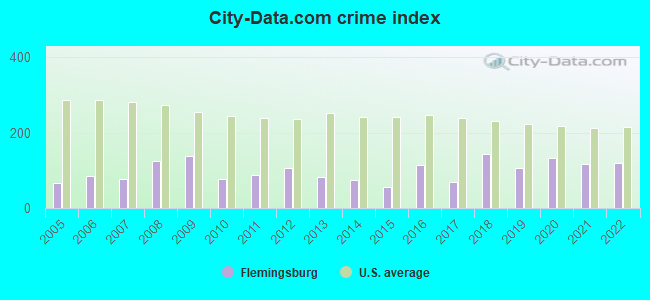
Crime rate in Flemingsburg detailed stats: murders, rapes, robberies, assaults, burglaries, thefts, arson
Full-time law enforcement employees in 2021, including police officers: 11 (11 officers - 10 male; 1 female).
| Officers per 1,000 residents here: | 3.93 |
| Kentucky average: | 1.89 |
 Recent articles from our blog. Our writers, many of them Ph.D. graduates or candidates, create easy-to-read articles on a wide variety of topics.

 | Beshear in Kentucky Governor’s Race (214 replies) |
| Eastern Kentucky (260 replies) |
| I'm here in Eastern KY for 2 days- anywhere specific I should looknat houses? (25 replies) |
| Should I live in Louisville or Covington? Really looking for a rural town near one of Kentucky’s larger cities (16 replies) |
| Back from my NE Kentucky Adventure (15 replies) |
| Which Airport for NE KY? (3 replies) |
Latest news from Flemingsburg, KY collected exclusively by city-data.com from local newspapers, TV, and radio stations
Ancestries: American (35.8%), English (12.1%), German (7.9%), Irish (5.9%), Scottish (5.3%), Italian (3.6%).
Current Local Time: EST time zone
Incorporated on 01/31/1912
Elevation: 823 feet
Land area: 2.55 square miles.
Population density: 1,162 people per square mile (low).
52 residents are foreign born
| This city: | 1.8% |
| Kentucky: | 4.1% |
Median real estate property taxes paid for housing units with mortgages in 2022: $991 (1.0%)
Median real estate property taxes paid for housing units with no mortgage in 2022: $559 (0.4%)
Nearest city with pop. 50,000+: Fayette, KY  (49.2 miles , pop. 260,512).
Nearest city with pop. 1,000,000+: Chicago, IL (315.2 miles , pop. 2,896,016).
Nearest cities:
), ), ), ), )Latitude: 38.42 N, Longitude: 83.74 W
Daytime population change due to commuting: +969 (+32.7%)
Workers who live and work in this city: 530 (50.0%)
Area code: 606

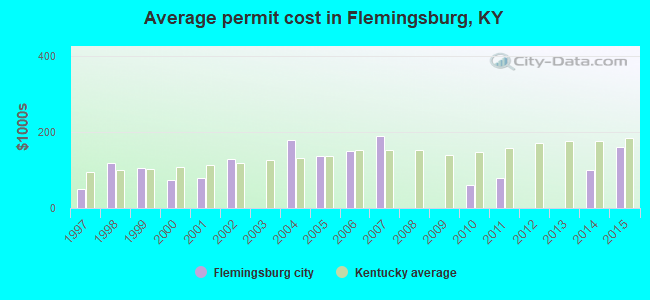
Flemingsburg, Kentucky accommodation & food services, waste management - Economy and Business Data
Single-family new house construction building permits:
- 2015: 1 building, cost: $160,000
- 2014: 1 building, cost: $100,000
- 2011: 1 building, cost: $80,000
- 2010: 2 buildings, average cost: $62,000
- 2007: 1 building, cost: $190,000
- 2006: 5 buildings, average cost: $150,000
- 2005: 3 buildings, average cost: $136,700
- 2004: 1 building, cost: $180,000
- 2002: 1 building, cost: $128,000
- 2001: 2 buildings, average cost: $80,000
- 2000: 2 buildings, average cost: $75,000
- 1999: 4 buildings, average cost: $105,000
- 1998: 1 building, cost: $120,000
- 1997: 7 buildings, average cost: $50,000
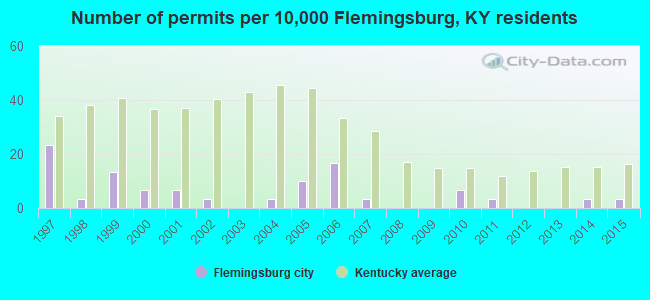
| Here: | 4.6% |
| Kentucky: | 3.8% |
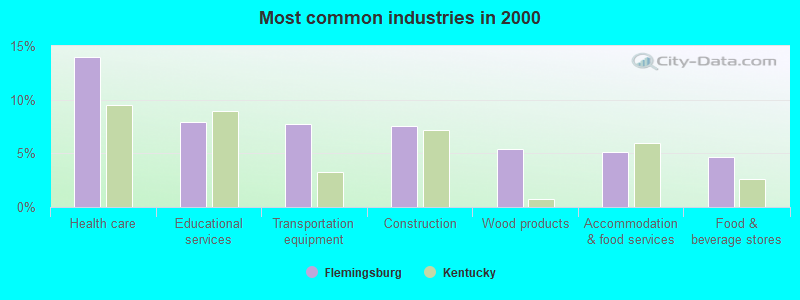
- Health care (13.9%)
- Educational services (7.9%)
- Transportation equipment (7.7%)
- Construction (7.6%)
- Wood products (5.4%)
- Accommodation & food services (5.1%)
- Food & beverage stores (4.7%)
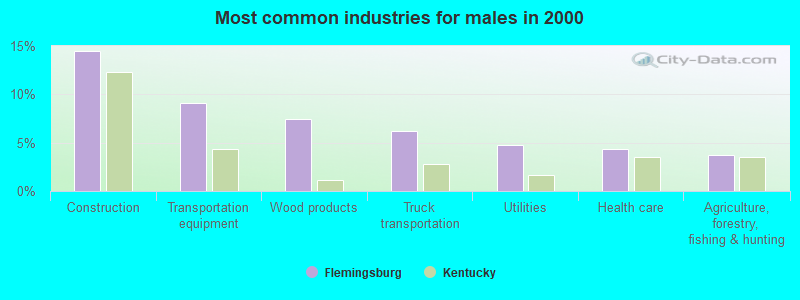
- Construction (14.5%)
- Transportation equipment (9.1%)
- Wood products (7.4%)
- Truck transportation (6.2%)
- Utilities (4.7%)
- Health care (4.4%)
- Agriculture, forestry, fishing & hunting (3.7%)
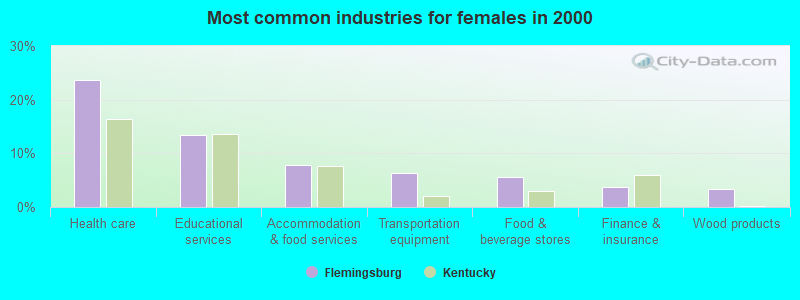
- Health care (23.7%)
- Educational services (13.4%)
- Accommodation & food services (7.9%)
- Transportation equipment (6.3%)
- Food & beverage stores (5.7%)
- Finance & insurance (3.8%)
- Wood products (3.4%)
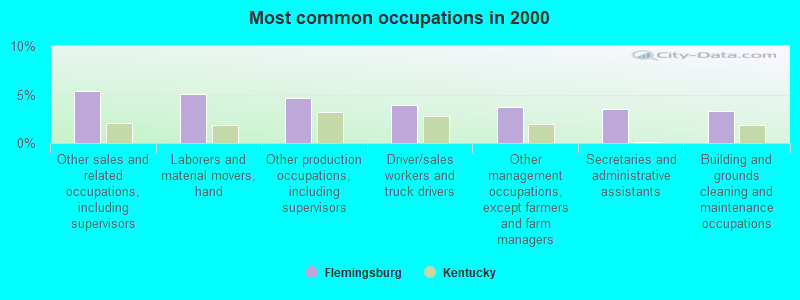
- Other sales and related occupations, including supervisors (5.4%)
- Laborers and material movers, hand (5.1%)
- Other production occupations, including supervisors (4.7%)
- Driver/sales workers and truck drivers (3.9%)
- Other management occupations, except farmers and farm managers (3.7%)
- Secretaries and administrative assistants (3.5%)
- Building and grounds cleaning and maintenance occupations (3.3%)
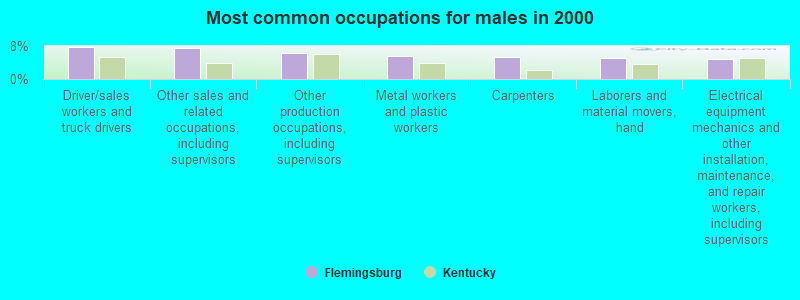
- Driver/sales workers and truck drivers (7.7%)
- Other sales and related occupations, including supervisors (7.6%)
- Other production occupations, including supervisors (6.2%)
- Metal workers and plastic workers (5.6%)
- Carpenters (5.2%)
- Laborers and material movers, hand (5.1%)
- Electrical equipment mechanics and other installation, maintenance, and repair workers, including supervisors (4.9%)

- Secretaries and administrative assistants (7.0%)
- Other management occupations, except farmers and farm managers (5.5%)
- Registered nurses (5.1%)
- Laborers and material movers, hand (5.1%)
- Cashiers (5.0%)
- Preschool, kindergarten, elementary, and middle school teachers (4.8%)
- Customer service representatives (4.6%)
Average climate in Flemingsburg, Kentucky
Based on data reported by over 4,000 weather stations


|
|


Tornado activity:
Flemingsburg-area historical tornado activity is slightly below Kentucky state average. It is 2% smaller than the overall U.S. average.
On 4/3/1974, a category F4 (max. wind speeds 207-260 mph) tornado 32.5 miles away from the Flemingsburg city center killed 7 people and injured 28 people.
On 5/7/1967, a category F3 (max. wind speeds 158-206 mph) tornado 12.6 miles away from the city center caused between $5000 and $50,000 in damages.
Earthquake activity:
Flemingsburg-area historical earthquake activity is significantly above Kentucky state average. It is 41% greater than the overall U.S. average.On 7/27/1980 at 18:52:21, a magnitude 5.2 (5.1 MB, 4.7 MS, 5.0 UK, 5.2 UK, Class: Moderate, Intensity: VI - VII) earthquake occurred 18.6 miles away from the city center
On 9/7/1988 at 02:28:09, a magnitude 4.6 (4.5 MB, 4.6 LG, Class: Light, Intensity: IV - V) earthquake occurred 20.7 miles away from Flemingsburg center
On 4/18/2008 at 09:36:59, a magnitude 5.4 (5.1 MB, 4.8 MS, 5.4 MW, 5.2 MW) earthquake occurred 224.7 miles away from the city center
On 8/23/2011 at 17:51:04, a magnitude 5.8 (5.8 MW, Depth: 3.7 mi) earthquake occurred 317.4 miles away from the city center
On 8/9/2020 at 12:07:37, a magnitude 5.1 (5.1 MW, Depth: 4.7 mi) earthquake occurred 197.9 miles away from Flemingsburg center
On 4/18/2008 at 09:36:59, a magnitude 5.2 (5.2 MW, Depth: 8.9 mi) earthquake occurred 224.8 miles away from Flemingsburg center
Magnitude types: regional Lg-wave magnitude (LG), body-wave magnitude (MB), surface-wave magnitude (MS), moment magnitude (MW)
Natural disasters:
The number of natural disasters in Fleming County (20) is greater than the US average (15).Major Disasters (Presidential) Declared: 16
Emergencies Declared: 3
Causes of natural disasters: Floods: 13, Storms: 11, Tornadoes: 6, Winter Storms: 6, Mudslides: 5, Landslides: 3, Blizzard: 1, Hurricane: 1, Snowfall: 1, Snowstorm: 1, Wind: 1, Other: 1 (Note: some incidents may be assigned to more than one category).

Hospitals and medical centers in Flemingsburg:
- FLEMING COUNTY HOSPITAL (Voluntary non-profit - Other, provides emergency services, 55 FOUNDATION DRIVE)
- PIONEER TRACE NURSING HOME (115 PIONEER TRACE)
Other hospitals and medical centers near Flemingsburg:
- DAVITA - MAYSVILLE (Dialysis Facility, about 15 miles away; MAYSVILLE, KY)
- HOSPICE OF HOPE INC (Hospital, about 16 miles away; MAYSVILLE, KY)
- MAYSVILLE EXTENDED CARE (Nursing Home, about 16 miles away; MAYSVILLE, KY)
- MAYSVILLE NURSING AND REHABILITATION FACILITY (Nursing Home, about 16 miles away; MAYSVILLE, KY)
- DCI - MAYSVILLE (Dialysis Facility, about 16 miles away; MAYSVILLE, KY)
Airports and heliports located in Flemingsburg:
- Fleming-Mason Airport (FGX) (Runways: 1, Itinerant Ops: 10,500, Local Ops: 6,320, Military Ops: 250)
- Fleming Co Hospital Heliport (0JY9)
Colleges/universities with over 2000 students nearest to Flemingsburg:
- Maysville Community and Technical College (about 15 miles; Maysville, KY; Full-time enrollment: 2,969)
- Morehead State University (about 24 miles; Morehead, KY; FT enrollment: 7,523)
- Shawnee State University (about 46 miles; Portsmouth, OH; FT enrollment: 4,160)
- Bluegrass Community and Technical College (about 50 miles; Lexington, KY; FT enrollment: 8,560)
- University of Kentucky (about 50 miles; Lexington, KY; FT enrollment: 23,517)
- University of Cincinnati-Clermont College (about 52 miles; Batavia, OH; FT enrollment: 2,739)
- Eastern Kentucky University (about 57 miles; Richmond, KY; FT enrollment: 13,525)
Public high school in Flemingsburg:
- FLEMING COUNTY HIGH SCHOOL (Students: 741, Location: 1658 ELIZAVILLE RD, Grades: 9-12)
Public elementary/middle schools in Flemingsburg:
- FLEMINGSBURG ELEMENTARY SCHOOL (Students: 657, Location: 245 W WATER ST, Grades: PK-6)
- SIMONS MIDDLE SCHOOL (Students: 406, Location: 242 W WATER ST, Grades: 7-8)
Points of interest:
Notable locations in Flemingsburg: Flemingsburg Volunteer Fire Department (A), Fleming County Emergency Medical Services (B). Display/hide their locations on the map
Hotels: Four Seasons Marketing LLC (334 Industrial Drive), Stockton Station Inn (129 West Water Street), Town Motel (Maysville Rd).
Courts: Kentucky Commonwealth - Circuit Court- District Court (Court Square), Kentucky Commonwealth - Circuit Clerk- District Court (Court Square).
Birthplace of: Joseph J. Reynolds - Union army general, Bill Graham (baseball) - College baseball player.
Drinking water stations with addresses in Flemingsburg and their reported violations in the past:
FLEMING CO WATER ASSOCIATION (Population served: 11,779, Purch surface water):Past monitoring violations:FLEMINGSBURG UTILITY SYSTEM (Population served: 4,604, Surface water):
- One minor monitoring violation
Past health violations:Past monitoring violations:
- MCL, Monthly (TCR) - In JUL-2012, Contaminant: Coliform. Follow-up actions: St Public Notif requested (AUG-31-2012), St Formal NOV issued (AUG-31-2012), St Compliance achieved (OCT-23-2012), St Public Notif received (OCT-31-2012)
- Monitoring and Reporting (DBP) - Between APR-2014 and JUN-2014, Contaminant: CARBON, TOTAL
- One minor monitoring violation
| This city: | 2.2 people |
| Kentucky: | 2.5 people |
| This city: | 60.4% |
| Whole state: | 66.9% |
| This city: | 4.8% |
| Whole state: | 6.4% |
Likely homosexual households (counted as self-reported same-sex unmarried-partner households)
- Lesbian couples: 0.2% of all households
- Gay men: 0.0% of all households
Banks with branches in Flemingsburg (2011 data):
- Peoples Bank of Kentucky, Inc.: Peoples Bank Of Kentucky, Inc., Drive-In Branch, Morehead Road Branch. Info updated 2007/06/06: Bank assets: $191.6 mil, Deposits: $158.5 mil, local headquarters, positive income, Agricultural Specialization, 6 total offices, Holding Company: Peoples Of Fleming County Bancorp, Inc.
- Community Trust Bank, Inc.: Flemingsburg South Ridge Branch at 108 Clark Street, branch established on 1978/09/18; Flemingsburg Branch at 36 Brookhaven Drive, branch established on 1939/01/01. Info updated 2011/03/25: Bank assets: $3,573.0 mil, Deposits: $2,890.4 mil, headquarters in Pikeville, KY, positive income, Commercial Lending Specialization, 80 total offices, Holding Company: Community Trust Bancorp, Inc.
- U.S. Bank National Association: Flemingsburg Branch at 288 A Windsor Road, branch established on 1997/08/11. Info updated 2012/01/30: Bank assets: $330,470.8 mil, Deposits: $236,091.5 mil, headquarters in Cincinnati, OH, positive income, 3121 total offices, Holding Company: U.S. Bancorp
For population 15 years and over in Flemingsburg:
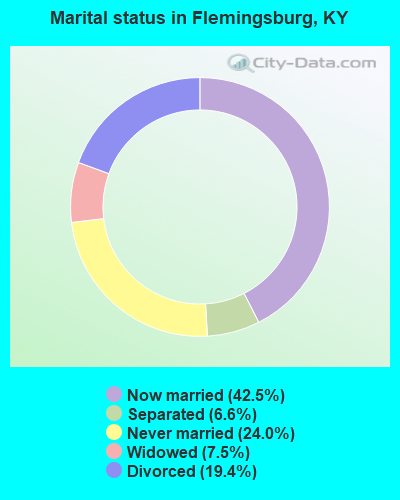
- Never married: 24.0%
- Now married: 42.5%
- Separated: 6.6%
- Widowed: 7.5%
- Divorced: 19.4%
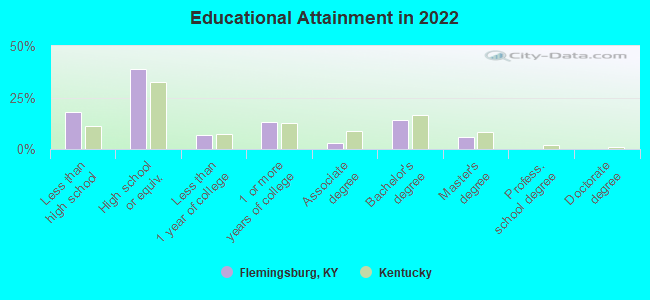
For population 25 years and over in Flemingsburg:
- High school or higher: 81.0%
- Bachelor's degree or higher: 18.8%
- Graduate or professional degree: 5.6%
- Unemployed: 8.2%
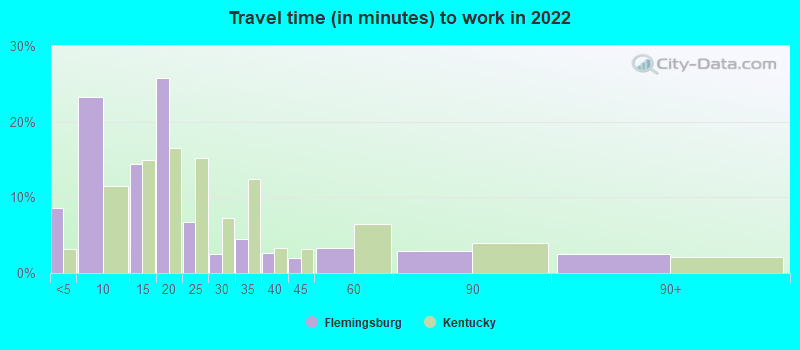
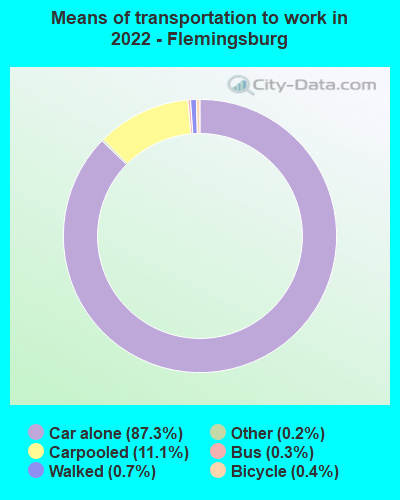
- Mean travel time to work (commute): 23.3 minutes
| Here: | 10.7 |
| Kentucky average: | 11.7 |
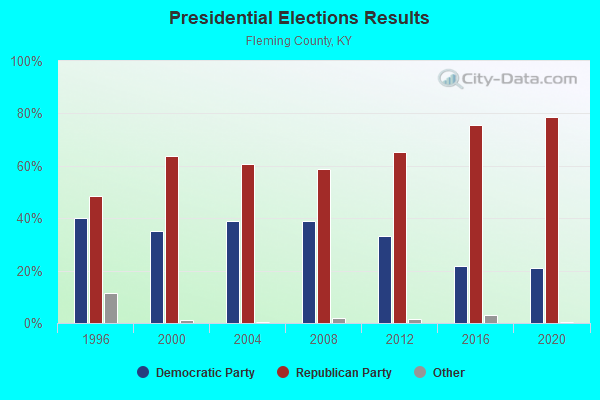
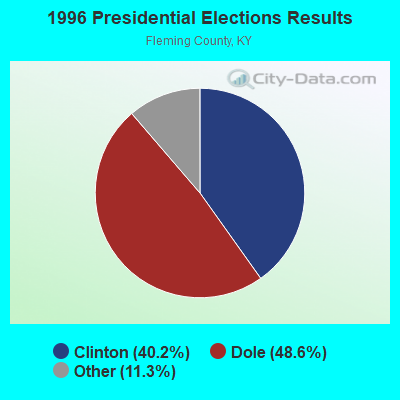
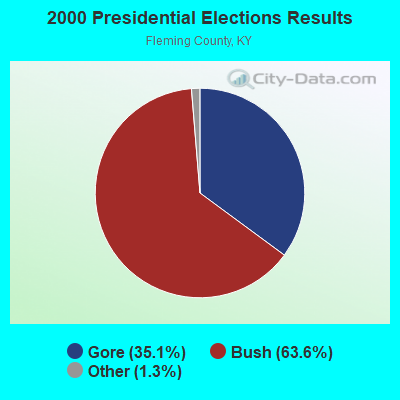
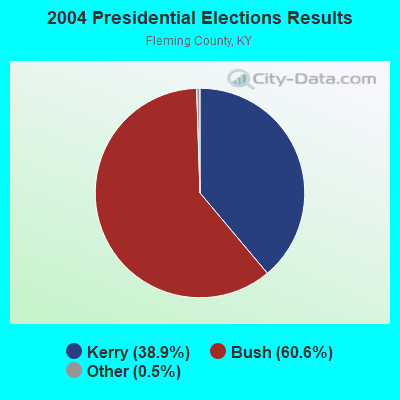
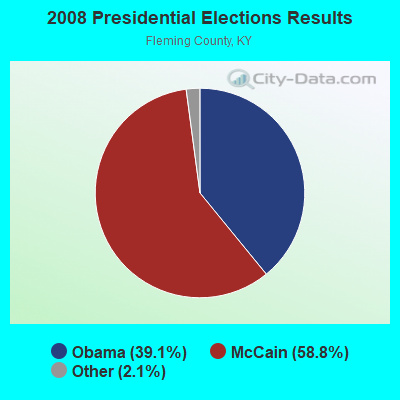
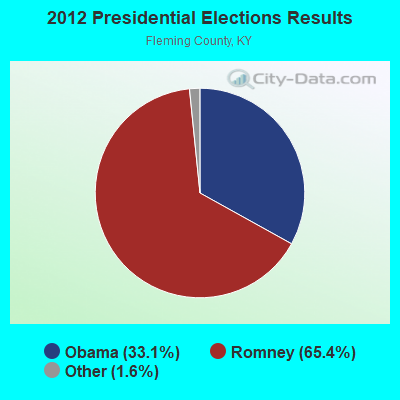
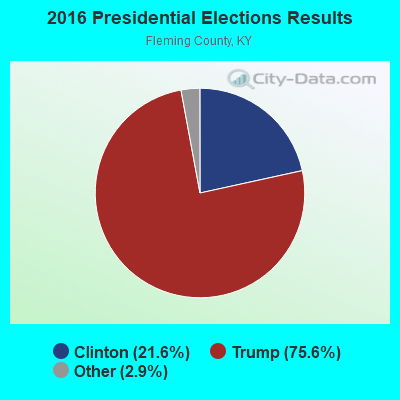
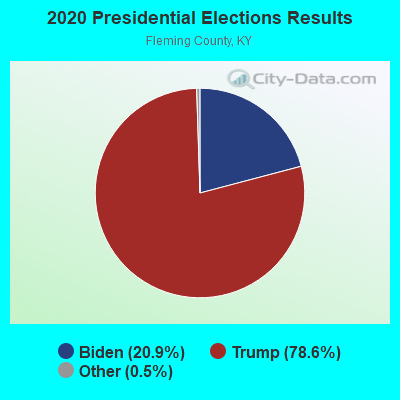
Graphs represent county-level data. Detailed 2008 Election Results
Religion statistics for Flemingsburg, KY (based on Fleming County data)
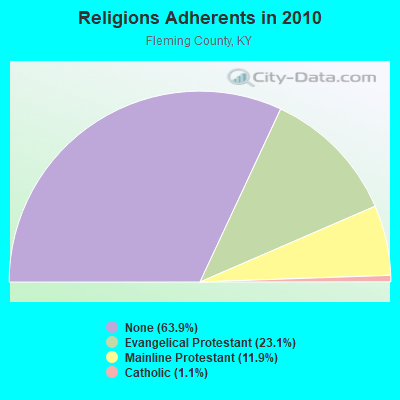
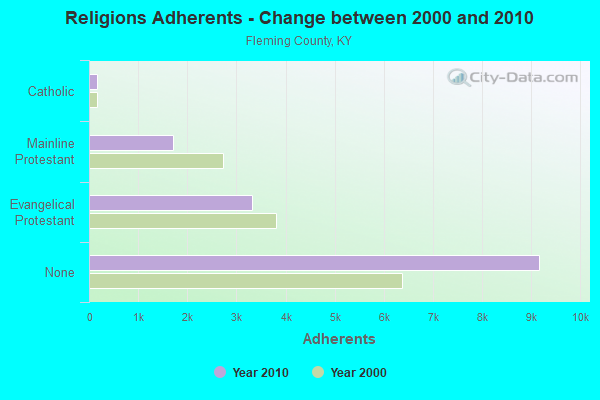
| Religion | Adherents | Congregations |
|---|---|---|
| Evangelical Protestant | 3,313 | 35 |
| Mainline Protestant | 1,708 | 16 |
| Catholic | 160 | 1 |
| None | 9,167 | - |
Food Environment Statistics:
| Fleming County: | 4.09 / 10,000 pop. |
| Kentucky: | 2.19 / 10,000 pop. |
| Fleming County: | 0.68 / 10,000 pop. |
| Kentucky: | 0.74 / 10,000 pop. |
| Here: | 5.46 / 10,000 pop. |
| Kentucky: | 4.36 / 10,000 pop. |
| Fleming County: | 2.05 / 10,000 pop. |
| Kentucky: | 5.74 / 10,000 pop. |
| Fleming County: | 10.3% |
| State: | 11.0% |
| Fleming County: | 28.0% |
| Kentucky: | 30.0% |
| Here: | 16.1% |
| State: | 15.9% |
Health and Nutrition:
| Flemingsburg: | 49.9% |
| State: | 49.9% |
| Flemingsburg: | 45.9% |
| State: | 47.0% |
| Flemingsburg: | 28.9 |
| Kentucky: | 28.6 |
| Flemingsburg: | 23.1% |
| Kentucky: | 21.0% |
| This city: | 6.4% |
| Kentucky: | 10.1% |
| This city: | 6.8 |
| State: | 6.8 |
| This city: | 32.8% |
| Kentucky: | 33.8% |
| This city: | 56.9% |
| State: | 56.8% |
| This city: | 76.2% |
| Kentucky: | 78.9% |
More about Health and Nutrition of Flemingsburg, KY Residents
| Local government employment and payroll (March 2022) | |||||
| Function | Full-time employees | Monthly full-time payroll | Average yearly full-time wage | Part-time employees | Monthly part-time payroll |
|---|---|---|---|---|---|
| Police Protection - Officers | 7 | $25,951 | $44,487 | 0 | $0 |
| Sewerage | 5 | $17,453 | $41,887 | 0 | $0 |
| Other Government Administration | 4 | $13,317 | $39,951 | 10 | $7,818 |
| Gas Supply | 4 | $11,891 | $35,673 | 0 | $0 |
| Solid Waste Management | 4 | $9,265 | $27,795 | 1 | $2,648 |
| Streets and Highways | 3 | $8,786 | $35,144 | 0 | $0 |
| Water Supply | 2 | $5,266 | $31,596 | 0 | $0 |
| Other and Unallocable | 1 | $3,534 | $42,408 | 2 | $3,822 |
| Firefighters | 0 | $0 | 1 | $581 | |
| Totals for Government | 30 | $95,462 | $38,185 | 14 | $14,869 |
Flemingsburg government finances - Expenditure in 2017 (per resident):
- Current Operations - Water Utilities: $853,000 ($287.30)
Sewerage: $841,000 ($283.26)
Gas Utilities: $656,000 ($220.95)
Central Staff Services: $523,000 ($176.15)
Police Protection: $320,000 ($107.78)
Regular Highways: $170,000 ($57.26)
Solid Waste Management: $170,000 ($57.26)
Housing and Community Development: $81,000 ($27.28)
Local Fire Protection: $51,000 ($17.18)
Financial Administration: $41,000 ($13.81)
Parks and Recreation: $31,000 ($10.44)
Protective Inspection and Regulation - Other: $31,000 ($10.44)
Miscellaneous Commercial Activities - Other: $16,000 ($5.39)
- General - Interest on Debt: $401,000 ($135.06)
- Other Capital Outlay - Local Fire Protection: $37,000 ($12.46)
Police Protection: $35,000 ($11.79)
Water Utilities: $27,000 ($9.09)
Gas Utilities: $22,000 ($7.41)
Sewerage: $22,000 ($7.41)
Regular Highways: $9,000 ($3.03)
Solid Waste Management: $9,000 ($3.03)
- Total Salaries and Wages: $1,015,000 ($341.87)
Flemingsburg government finances - Revenue in 2017 (per resident):
- Charges - Sewerage: $771,000 ($259.68)
Solid Waste Management: $306,000 ($103.07)
Other: $94,000 ($31.66)
- Federal Intergovernmental - Water Utilities: $39,000 ($13.14)
Other: $9,000 ($3.03)
- Miscellaneous - Interest Earnings: $8,000 ($2.69)
Rents: $5,000 ($1.68)
Sale of Property: $5,000 ($1.68)
- Revenue - Gas Utilities: $891,000 ($300.10)
Water Utilities: $785,000 ($264.40)
- State Intergovernmental - Water Utilities: $141,000 ($47.49)
Highways: $94,000 ($31.66)
Other: $41,000 ($13.81)
- Tax - Individual Income: $618,000 ($208.15)
Property: $311,000 ($104.75)
Insurance Premiums Sales: $290,000 ($97.68)
Public Utilities Sales: $150,000 ($50.52)
Corporation Net Income: $127,000 ($42.78)
Occupation and Business License - Other: $29,000 ($9.77)
Other License: $2,000 ($0.67)
Flemingsburg government finances - Debt in 2017 (per resident):
- Long Term Debt - Beginning Outstanding - Unspecified Public Purpose: $10,034,000 ($3379.59)
Outstanding Unspecified Public Purpose: $9,362,000 ($3153.25)
Retired Unspecified Public Purpose: $673,000 ($226.68)
Flemingsburg government finances - Cash and Securities in 2017 (per resident):
- Other Funds - Cash and Securities: $3,535,000 ($1190.64)
- Sinking Funds - Cash and Securities: $157,000 ($52.88)
| Businesses in Flemingsburg, KY | ||||
| Name | Count | Name | Count | |
|---|---|---|---|---|
| AT&T | 1 | H&R Block | 1 | |
| Ace Hardware | 1 | Lane Furniture | 1 | |
| Arby's | 1 | McDonald's | 1 | |
| Chevrolet | 1 | Pizza Hut | 1 | |
| Curves | 1 | RadioShack | 1 | |
| Dairy Queen | 1 | Subway | 1 | |
| Ford | 1 | U-Haul | 1 | |
Strongest AM radio stations in Flemingsburg:
- WFLE (1060 AM; daytime; 0 kW; FLEMINGSBURG, KY; Owner: FLEMING COUNTY BROADCASTING CO., INC)
- WLW (700 AM; 50 kW; CINCINNATI, OH; Owner: JACOR BROADCASTING CORPORATION)
- WTVN (610 AM; 50 kW; COLUMBUS, OH; Owner: CITICASTERS LICENSES, L.P.)
- WSAI (1530 AM; 50 kW; CINCINNATI, OH; Owner: JACOR BROADCASTING CORPORATION)
- WHAS (840 AM; 50 kW; LOUISVILLE, KY; Owner: CLEAR CHANNEL BROADCASTING LICENSES, INC.)
- WLAP (630 AM; 5 kW; LEXINGTON, KY; Owner: CITICASTERS LICENSES, L.P.)
- WFTM (1240 AM; 1 kW; MAYSVILLE, KY; Owner: STANDARD TABACCO CO.)
- WVLK (590 AM; 5 kW; LEXINGTON, KY; Owner: CUMULUS LICENSING CORP.)
- WKRC (550 AM; 5 kW; CINCINNATI, OH; Owner: JACOR BROADCASTING CORPORATION)
- WXRA (1580 AM; 10 kW; GEORGETOWN, KY; Owner: CITICASTERS LICENSES, L.P.)
- WKVL (850 AM; daytime; 50 kW; KNOXVILLE, TN; Owner: HORNE RADIO, LLC)
- WGOH (1370 AM; 5 kW; GRAYSON, KY; Owner: CARTER COUNTY BROADCASTING CO., INC.)
- WRFD (880 AM; daytime; 23 kW; COLUMBUS-WORTHINGTON, OH; Owner: SALEM MEDIA OF OHIO, INC.)
Strongest FM radio stations in Flemingsburg:
- WFLE-FM (95.1 FM; FLEMINGSBURG, KY; Owner: FLEMING COUNTY BROADCASTING CO., INC)
- WBVX (92.1 FM; CARLISLE, KY; Owner: L.M. COMMUNICATIONS OF KENTUCKY, LLC)
- WMKY (90.3 FM; MOREHEAD, KY; Owner: MOREHEAD STATE UNIVERSITY)
- WAGX (101.3 FM; MANCHESTER, OH; Owner: JEWELL SCHAEFFER BROADCASTING CO.)
- WPAY-FM (104.1 FM; PORTSMOUTH, OH; Owner: RADIO STATIONS WPAY/WPFB, INC.)
- WKCA (107.7 FM; OWINGSVILLE, KY; Owner: GATEWAY RADIO WORKS, INC.)
- WFTM-FM (95.9 FM; MAYSVILLE, KY; Owner: STANDARD TOBACCO COMPANY, INC.)
- WOSP (91.5 FM; PORTSMOUTH, OH; Owner: THE OHIO STATE UNIVERSITY)
- WAOL (99.5 FM; RIPLEY, OH; Owner: RICHARD L. PLESSINGER, SR.)
- WBMK (88.5 FM; MOREHEAD, KY; Owner: AMERICAN FAMILY ASSOCIATION)
- WQXX (106.1 FM; MOREHEAD, KY; Owner: MORGAN COUNTY INDUSTRIES, INC.)
- WIOK (107.5 FM; FALMOUTH, KY; Owner: HAMMOND BROADCASTING, INC.)
- WIVY (96.3 FM; MOREHEAD, KY; Owner: GATEWAY RADIO WORKS, INC.)
- WMKJ (105.5 FM; MOUNT STERLING, KY; Owner: CITICASTERS LICENSES, INC.)
TV broadcast stations around Flemingsburg:
- WUPX-TV (Channel 67; MOREHEAD, KY; Owner: PAXSON LEXINGTON LICENSE, INC.)
- WKMR (Channel 38; MOREHEAD, KY; Owner: KENTUCKY AUTHORITY FOR EDUCATIONAL TV)
- WLEX-TV (Channel 18; LEXINGTON, KY; Owner: WLEX COMMUNICATIONS, L.L.C.)
- National Bridge Inventory (NBI) Statistics
- 32Number of bridges
- 226ft / 68.8mTotal length
- $223,000Total costs
- 51,618Total average daily traffic
- 5,464Total average daily truck traffic
- 49,762Total future (year 2026) average daily traffic
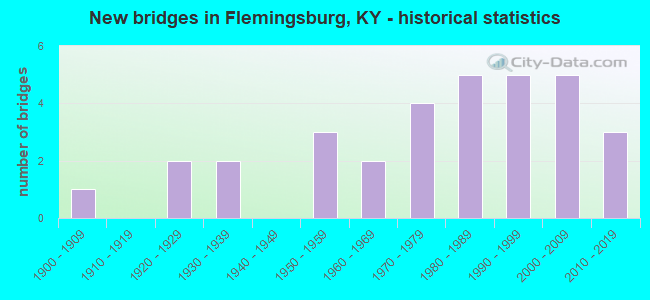
- New bridges - historical statistics
- 11900-1909
- 21920-1929
- 21930-1939
- 31950-1959
- 21960-1969
- 41970-1979
- 51980-1989
- 51990-1999
- 52000-2009
- 32010-2019
FCC Registered Cell Phone Towers:
1 (See the full list of FCC Registered Cell Phone Towers in Flemingsburg)FCC Registered Antenna Towers:
70 (See the full list of FCC Registered Antenna Towers)FCC Registered Commercial Land Mobile Towers:
1 (See the full list of FCC Registered Commercial Land Mobile Towers in Flemingsburg, KY)FCC Registered Broadcast Land Mobile Towers:
13 (See the full list of FCC Registered Broadcast Land Mobile Towers)FCC Registered Microwave Towers:
13 (See the full list of FCC Registered Microwave Towers in this town)FCC Registered Maritime Coast & Aviation Ground Towers:
3 (See the full list of FCC Registered Maritime Coast & Aviation Ground Towers)FCC Registered Amateur Radio Licenses:
31 (See the full list of FCC Registered Amateur Radio Licenses in Flemingsburg)FAA Registered Aircraft:
3- Aircraft: BEECH 23 (Category: Land, Seats: 4, Weight: Up to 12,499 Pounds, Speed: 113 mph), Engine: LYCOMING 0-320 SERIES (180 HP) (Reciprocating)
N-Number: 2370L, N2370L, N-2370L, Serial Number: M-211, Year manufactured: 1963, Airworthiness Date: 02/07/1963, Certificate Issue Date: 09/21/2020
Registrant (Individual): Stephen Watson, 379 Ashley St, Flemingsburg, KY 41041 - Aircraft: PIPER PA-28-181 (Category: Land, Seats: 4, Weight: Up to 12,499 Pounds, Speed: 105 mph), Engine: Reciprocating
N-Number: 2917T, N2917T, N-2917T, Serial Number: 28-7990553, Airworthiness Date: 06/20/1979, Certificate Issue Date: 10/24/2005
Registrant (Individual): John H Sims, 3361 Maysville Rd, Flemingsburg, KY 41041 - Aircraft: BEECH 35-A33 (Category: Land, Seats: 4, Weight: Up to 12,499 Pounds, Speed: 138 mph), Engine: CONT MOTOR I0-470 SERIES (260 HP) (Reciprocating)
N-Number: 358Z, N358Z, N-358Z, Serial Number: CD-240, Year manufactured: 1960, Airworthiness Date: 12/23/1960, Certificate Issue Date: 11/05/2020
Registrant (Individual): Kent W Kalb, 813 Elizaville Ave, Flemingsburg, KY 41041
2004 - 2018 National Fire Incident Reporting System (NFIRS) incidents
- Fire incident types reported to NFIRS in Flemingsburg, KY
- 18145.7%Structure Fires
- 10626.8%Outside Fires
- 6817.2%Mobile Property/Vehicle Fires
- 4110.4%Other
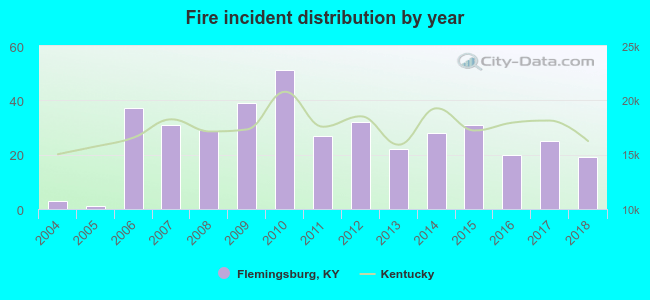 According to the data from the years 2004 - 2018 the average number of fire incidents per year is 26. The highest number of fire incidents - 51 took place in 2010, and the least - 1 in 2005. The data has an increasing trend.
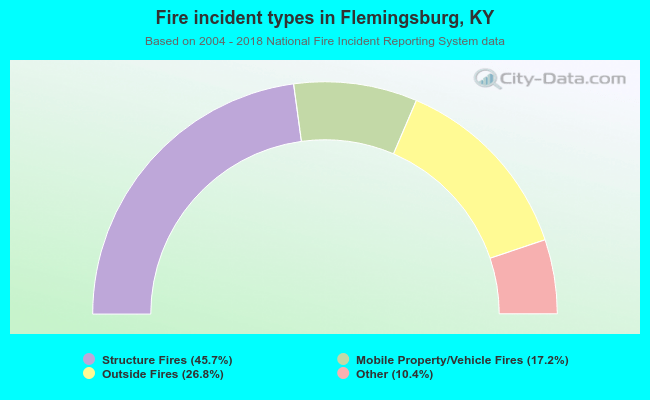 When looking into fire subcategories, the most reports belonged to: Structure Fires (45.7%), and Outside Fires (26.8%).
| Most common first names in Flemingsburg, KY among deceased individuals | ||
| Name | Count | Lived (average) |
|---|---|---|
| Mary | 79 | 81.5 years |
| James | 73 | 72.9 years |
| William | 65 | 74.1 years |
| John | 49 | 77.9 years |
| Charles | 49 | 74.2 years |
| Robert | 35 | 70.2 years |
| George | 25 | 73.9 years |
| Elizabeth | 25 | 80.2 years |
| Anna | 24 | 80.5 years |
| Thomas | 24 | 78.1 years |
| Most common last names in Flemingsburg, KY among deceased individuals | ||
| Last name | Count | Lived (average) |
|---|---|---|
| Jones | 33 | 75.3 years |
| Mckee | 31 | 79.6 years |
| Emmons | 29 | 77.2 years |
| Smith | 27 | 82.3 years |
| Harmon | 26 | 76.8 years |
| Williams | 25 | 78.4 years |
| Hamm | 24 | 72.9 years |
| Story | 24 | 79.1 years |
| Hinton | 24 | 81.4 years |
| Hunt | 23 | 74.1 years |
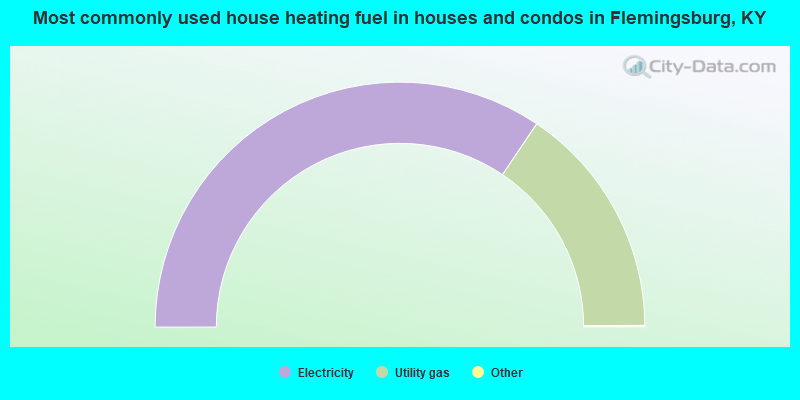
- 69.0%Electricity
- 31.0%Utility gas
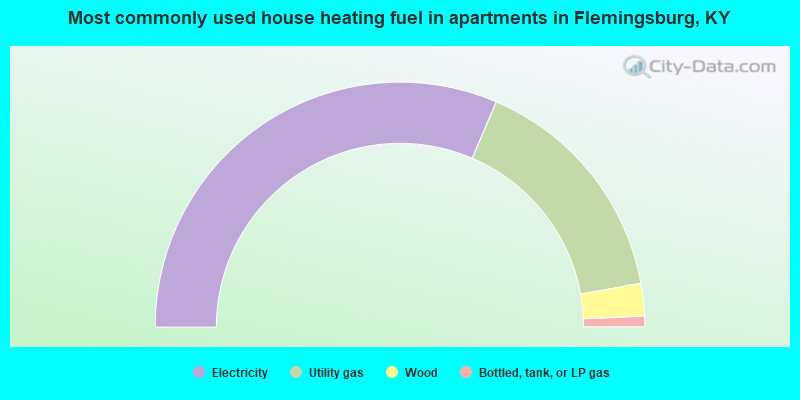
- 62.9%Electricity
- 31.4%Utility gas
- 4.3%Wood
- 1.4%Bottled, tank, or LP gas
Flemingsburg compared to Kentucky state average:
- Median household income below state average.
- Median house value below state average.
- Unemployed percentage below state average.
- Black race population percentage significantly below state average.
- Hispanic race population percentage above state average.
- Foreign-born population percentage significantly below state average.
- Length of stay since moving in significantly below state average.
- Institutionalized population percentage above state average.

|
Total of 2 patent applications in 2008-2024.