Palmyra, Pennsylvania Submit your own pictures of this borough and show them to the world
OSM Map
General Map
Google Map
MSN Map
OSM Map
General Map
Google Map
MSN Map
OSM Map
General Map
Google Map
MSN Map
OSM Map
General Map
Google Map
MSN Map
Please wait while loading the map...
Population in 2022: 7,730 (100% urban, 0% rural). Population change since 2000: +8.9%Males: 3,443 Females: 4,287
March 2022 cost of living index in Palmyra: 95.1 (less than average, U.S. average is 100) Percentage of residents living in poverty in 2022: 15.7%for White Non-Hispanic residents , 53.8% for Hispanic or Latino residents , 43.4% for other race residents , 51.0% for two or more races residents )
Profiles of local businesses
Business Search - 14 Million verified businesses
Data:
Median household income ($)
Median household income (% change since 2000)
Household income diversity
Ratio of average income to average house value (%)
Ratio of average income to average rent
Median household income ($) - White
Median household income ($) - Black or African American
Median household income ($) - Asian
Median household income ($) - Hispanic or Latino
Median household income ($) - American Indian and Alaska Native
Median household income ($) - Multirace
Median household income ($) - Other Race
Median household income for houses/condos with a mortgage ($)
Median household income for apartments without a mortgage ($)
Races - White alone (%)
Races - White alone (% change since 2000)
Races - Black alone (%)
Races - Black alone (% change since 2000)
Races - American Indian alone (%)
Races - American Indian alone (% change since 2000)
Races - Asian alone (%)
Races - Asian alone (% change since 2000)
Races - Hispanic (%)
Races - Hispanic (% change since 2000)
Races - Native Hawaiian and Other Pacific Islander alone (%)
Races - Native Hawaiian and Other Pacific Islander alone (% change since 2000)
Races - Two or more races (%)
Races - Two or more races (% change since 2000)
Races - Other race alone (%)
Races - Other race alone (% change since 2000)
Racial diversity
Unemployment (%)
Unemployment (% change since 2000)
Unemployment (%) - White
Unemployment (%) - Black or African American
Unemployment (%) - Asian
Unemployment (%) - Hispanic or Latino
Unemployment (%) - American Indian and Alaska Native
Unemployment (%) - Multirace
Unemployment (%) - Other Race
Population density (people per square mile)
Population - Males (%)
Population - Females (%)
Population - Males (%) - White
Population - Males (%) - Black or African American
Population - Males (%) - Asian
Population - Males (%) - Hispanic or Latino
Population - Males (%) - American Indian and Alaska Native
Population - Males (%) - Multirace
Population - Males (%) - Other Race
Population - Females (%) - White
Population - Females (%) - Black or African American
Population - Females (%) - Asian
Population - Females (%) - Hispanic or Latino
Population - Females (%) - American Indian and Alaska Native
Population - Females (%) - Multirace
Population - Females (%) - Other Race
Coronavirus confirmed cases (Jun 10, 2024)
Deaths caused by coronavirus (Jun 10, 2024)
Coronavirus confirmed cases (per 100k population) (Jun 10, 2024)
Deaths caused by coronavirus (per 100k population) (Jun 10, 2024)
Daily increase in number of cases (Jun 10, 2024)
Weekly increase in number of cases (Jun 10, 2024)
Cases doubled (in days) (Jun 10, 2024)
Hospitalized patients (Apr 18, 2022)
Negative test results (Apr 18, 2022)
Total test results (Apr 18, 2022)
COVID Vaccine doses distributed (per 100k population) (Sep 19, 2023)
COVID Vaccine doses administered (per 100k population) (Sep 19, 2023)
COVID Vaccine doses distributed (Sep 19, 2023)
COVID Vaccine doses administered (Sep 19, 2023)
Likely homosexual households (%)
Likely homosexual households (% change since 2000)
Likely homosexual households - Lesbian couples (%)
Likely homosexual households - Lesbian couples (% change since 2000)
Likely homosexual households - Gay men (%)
Likely homosexual households - Gay men (% change since 2000)
Cost of living index
Median gross rent ($)
Median contract rent ($)
Median monthly housing costs ($)
Median house or condo value ($)
Median house or condo value ($ change since 2000)
Mean house or condo value by units in structure - 1, detached ($)
Mean house or condo value by units in structure - 1, attached ($)
Mean house or condo value by units in structure - 2 ($)
Mean house or condo value by units in structure by units in structure - 3 or 4 ($)
Mean house or condo value by units in structure - 5 or more ($)
Mean house or condo value by units in structure - Boat, RV, van, etc. ($)
Mean house or condo value by units in structure - Mobile home ($)
Median house or condo value ($) - White
Median house or condo value ($) - Black or African American
Median house or condo value ($) - Asian
Median house or condo value ($) - Hispanic or Latino
Median house or condo value ($) - American Indian and Alaska Native
Median house or condo value ($) - Multirace
Median house or condo value ($) - Other Race
Median resident age
Resident age diversity
Median resident age - Males
Median resident age - Females
Median resident age - White
Median resident age - Black or African American
Median resident age - Asian
Median resident age - Hispanic or Latino
Median resident age - American Indian and Alaska Native
Median resident age - Multirace
Median resident age - Other Race
Median resident age - Males - White
Median resident age - Males - Black or African American
Median resident age - Males - Asian
Median resident age - Males - Hispanic or Latino
Median resident age - Males - American Indian and Alaska Native
Median resident age - Males - Multirace
Median resident age - Males - Other Race
Median resident age - Females - White
Median resident age - Females - Black or African American
Median resident age - Females - Asian
Median resident age - Females - Hispanic or Latino
Median resident age - Females - American Indian and Alaska Native
Median resident age - Females - Multirace
Median resident age - Females - Other Race
Commute - mean travel time to work (minutes)
Travel time to work - Less than 5 minutes (%)
Travel time to work - Less than 5 minutes (% change since 2000)
Travel time to work - 5 to 9 minutes (%)
Travel time to work - 5 to 9 minutes (% change since 2000)
Travel time to work - 10 to 19 minutes (%)
Travel time to work - 10 to 19 minutes (% change since 2000)
Travel time to work - 20 to 29 minutes (%)
Travel time to work - 20 to 29 minutes (% change since 2000)
Travel time to work - 30 to 39 minutes (%)
Travel time to work - 30 to 39 minutes (% change since 2000)
Travel time to work - 40 to 59 minutes (%)
Travel time to work - 40 to 59 minutes (% change since 2000)
Travel time to work - 60 to 89 minutes (%)
Travel time to work - 60 to 89 minutes (% change since 2000)
Travel time to work - 90 or more minutes (%)
Travel time to work - 90 or more minutes (% change since 2000)
Marital status - Never married (%)
Marital status - Now married (%)
Marital status - Separated (%)
Marital status - Widowed (%)
Marital status - Divorced (%)
Median family income ($)
Median family income (% change since 2000)
Median non-family income ($)
Median non-family income (% change since 2000)
Median per capita income ($)
Median per capita income (% change since 2000)
Median family income ($) - White
Median family income ($) - Black or African American
Median family income ($) - Asian
Median family income ($) - Hispanic or Latino
Median family income ($) - American Indian and Alaska Native
Median family income ($) - Multirace
Median family income ($) - Other Race
Median year house/condo built
Median year apartment built
Year house built - Built 2005 or later (%)
Year house built - Built 2000 to 2004 (%)
Year house built - Built 1990 to 1999 (%)
Year house built - Built 1980 to 1989 (%)
Year house built - Built 1970 to 1979 (%)
Year house built - Built 1960 to 1969 (%)
Year house built - Built 1950 to 1959 (%)
Year house built - Built 1940 to 1949 (%)
Year house built - Built 1939 or earlier (%)
Average household size
Household density (households per square mile)
Average household size - White
Average household size - Black or African American
Average household size - Asian
Average household size - Hispanic or Latino
Average household size - American Indian and Alaska Native
Average household size - Multirace
Average household size - Other Race
Occupied housing units (%)
Vacant housing units (%)
Owner occupied housing units (%)
Renter occupied housing units (%)
Vacancy status - For rent (%)
Vacancy status - For sale only (%)
Vacancy status - Rented or sold, not occupied (%)
Vacancy status - For seasonal, recreational, or occasional use (%)
Vacancy status - For migrant workers (%)
Vacancy status - Other vacant (%)
Residents with income below the poverty level (%)
Residents with income below 50% of the poverty level (%)
Children below poverty level (%)
Poor families by family type - Married-couple family (%)
Poor families by family type - Male, no wife present (%)
Poor families by family type - Female, no husband present (%)
Poverty status for native-born residents (%)
Poverty status for foreign-born residents (%)
Poverty among high school graduates not in families (%)
Poverty among people who did not graduate high school not in families (%)
Residents with income below the poverty level (%) - White
Residents with income below the poverty level (%) - Black or African American
Residents with income below the poverty level (%) - Asian
Residents with income below the poverty level (%) - Hispanic or Latino
Residents with income below the poverty level (%) - American Indian and Alaska Native
Residents with income below the poverty level (%) - Multirace
Residents with income below the poverty level (%) - Other Race
Air pollution - Air Quality Index (AQI)
Air pollution - CO
Air pollution - NO2
Air pollution - SO2
Air pollution - Ozone
Air pollution - PM10
Air pollution - PM25
Air pollution - Pb
Crime - Murders per 100,000 population
Crime - Rapes per 100,000 population
Crime - Robberies per 100,000 population
Crime - Assaults per 100,000 population
Crime - Burglaries per 100,000 population
Crime - Thefts per 100,000 population
Crime - Auto thefts per 100,000 population
Crime - Arson per 100,000 population
Crime - City-data.com crime index
Crime - Violent crime index
Crime - Property crime index
Crime - Murders per 100,000 population (5 year average)
Crime - Rapes per 100,000 population (5 year average)
Crime - Robberies per 100,000 population (5 year average)
Crime - Assaults per 100,000 population (5 year average)
Crime - Burglaries per 100,000 population (5 year average)
Crime - Thefts per 100,000 population (5 year average)
Crime - Auto thefts per 100,000 population (5 year average)
Crime - Arson per 100,000 population (5 year average)
Crime - City-data.com crime index (5 year average)
Crime - Violent crime index (5 year average)
Crime - Property crime index (5 year average)
1996 Presidential Elections Results (%) - Democratic Party (Clinton)
1996 Presidential Elections Results (%) - Republican Party (Dole)
1996 Presidential Elections Results (%) - Other
2000 Presidential Elections Results (%) - Democratic Party (Gore)
2000 Presidential Elections Results (%) - Republican Party (Bush)
2000 Presidential Elections Results (%) - Other
2004 Presidential Elections Results (%) - Democratic Party (Kerry)
2004 Presidential Elections Results (%) - Republican Party (Bush)
2004 Presidential Elections Results (%) - Other
2008 Presidential Elections Results (%) - Democratic Party (Obama)
2008 Presidential Elections Results (%) - Republican Party (McCain)
2008 Presidential Elections Results (%) - Other
2012 Presidential Elections Results (%) - Democratic Party (Obama)
2012 Presidential Elections Results (%) - Republican Party (Romney)
2012 Presidential Elections Results (%) - Other
2016 Presidential Elections Results (%) - Democratic Party (Clinton)
2016 Presidential Elections Results (%) - Republican Party (Trump)
2016 Presidential Elections Results (%) - Other
2020 Presidential Elections Results (%) - Democratic Party (Biden)
2020 Presidential Elections Results (%) - Republican Party (Trump)
2020 Presidential Elections Results (%) - Other
Ancestries Reported - Arab (%)
Ancestries Reported - Czech (%)
Ancestries Reported - Danish (%)
Ancestries Reported - Dutch (%)
Ancestries Reported - English (%)
Ancestries Reported - French (%)
Ancestries Reported - French Canadian (%)
Ancestries Reported - German (%)
Ancestries Reported - Greek (%)
Ancestries Reported - Hungarian (%)
Ancestries Reported - Irish (%)
Ancestries Reported - Italian (%)
Ancestries Reported - Lithuanian (%)
Ancestries Reported - Norwegian (%)
Ancestries Reported - Polish (%)
Ancestries Reported - Portuguese (%)
Ancestries Reported - Russian (%)
Ancestries Reported - Scotch-Irish (%)
Ancestries Reported - Scottish (%)
Ancestries Reported - Slovak (%)
Ancestries Reported - Subsaharan African (%)
Ancestries Reported - Swedish (%)
Ancestries Reported - Swiss (%)
Ancestries Reported - Ukrainian (%)
Ancestries Reported - United States (%)
Ancestries Reported - Welsh (%)
Ancestries Reported - West Indian (%)
Ancestries Reported - Other (%)
Educational Attainment - No schooling completed (%)
Educational Attainment - Less than high school (%)
Educational Attainment - High school or equivalent (%)
Educational Attainment - Less than 1 year of college (%)
Educational Attainment - 1 or more years of college (%)
Educational Attainment - Associate degree (%)
Educational Attainment - Bachelor's degree (%)
Educational Attainment - Master's degree (%)
Educational Attainment - Professional school degree (%)
Educational Attainment - Doctorate degree (%)
School Enrollment - Nursery, preschool (%)
School Enrollment - Kindergarten (%)
School Enrollment - Grade 1 to 4 (%)
School Enrollment - Grade 5 to 8 (%)
School Enrollment - Grade 9 to 12 (%)
School Enrollment - College undergrad (%)
School Enrollment - Graduate or professional (%)
School Enrollment - Not enrolled in school (%)
School enrollment - Public schools (%)
School enrollment - Private schools (%)
School enrollment - Not enrolled (%)
Median number of rooms in houses and condos
Median number of rooms in apartments
Housing units lacking complete plumbing facilities (%)
Housing units lacking complete kitchen facilities (%)
Density of houses
Urban houses (%)
Rural houses (%)
Households with people 60 years and over (%)
Households with people 65 years and over (%)
Households with people 75 years and over (%)
Households with one or more nonrelatives (%)
Households with no nonrelatives (%)
Population in households (%)
Family households (%)
Nonfamily households (%)
Population in families (%)
Family households with own children (%)
Median number of bedrooms in owner occupied houses
Mean number of bedrooms in owner occupied houses
Median number of bedrooms in renter occupied houses
Mean number of bedrooms in renter occupied houses
Median number of vehichles in owner occupied houses
Mean number of vehichles in owner occupied houses
Median number of vehichles in renter occupied houses
Mean number of vehichles in renter occupied houses
Mortgage status - with mortgage (%)
Mortgage status - with second mortgage (%)
Mortgage status - with home equity loan (%)
Mortgage status - with both second mortgage and home equity loan (%)
Mortgage status - without a mortgage (%)
Average family size
Average family size - White
Average family size - Black or African American
Average family size - Asian
Average family size - Hispanic or Latino
Average family size - American Indian and Alaska Native
Average family size - Multirace
Average family size - Other Race
Geographical mobility - Same house 1 year ago (%)
Geographical mobility - Moved within same county (%)
Geographical mobility - Moved from different county within same state (%)
Geographical mobility - Moved from different state (%)
Geographical mobility - Moved from abroad (%)
Place of birth - Born in state of residence (%)
Place of birth - Born in other state (%)
Place of birth - Native, outside of US (%)
Place of birth - Foreign born (%)
Housing units in structures - 1, detached (%)
Housing units in structures - 1, attached (%)
Housing units in structures - 2 (%)
Housing units in structures - 3 or 4 (%)
Housing units in structures - 5 to 9 (%)
Housing units in structures - 10 to 19 (%)
Housing units in structures - 20 to 49 (%)
Housing units in structures - 50 or more (%)
Housing units in structures - Mobile home (%)
Housing units in structures - Boat, RV, van, etc. (%)
House/condo owner moved in on average (years ago)
Renter moved in on average (years ago)
Year householder moved into unit - Moved in 1999 to March 2000 (%)
Year householder moved into unit - Moved in 1995 to 1998 (%)
Year householder moved into unit - Moved in 1990 to 1994 (%)
Year householder moved into unit - Moved in 1980 to 1989 (%)
Year householder moved into unit - Moved in 1970 to 1979 (%)
Year householder moved into unit - Moved in 1969 or earlier (%)
Means of transportation to work - Drove car alone (%)
Means of transportation to work - Carpooled (%)
Means of transportation to work - Public transportation (%)
Means of transportation to work - Bus or trolley bus (%)
Means of transportation to work - Streetcar or trolley car (%)
Means of transportation to work - Subway or elevated (%)
Means of transportation to work - Railroad (%)
Means of transportation to work - Ferryboat (%)
Means of transportation to work - Taxicab (%)
Means of transportation to work - Motorcycle (%)
Means of transportation to work - Bicycle (%)
Means of transportation to work - Walked (%)
Means of transportation to work - Other means (%)
Working at home (%)
Industry diversity
Most Common Industries - Agriculture, forestry, fishing and hunting, and mining (%)
Most Common Industries - Agriculture, forestry, fishing and hunting (%)
Most Common Industries - Mining, quarrying, and oil and gas extraction (%)
Most Common Industries - Construction (%)
Most Common Industries - Manufacturing (%)
Most Common Industries - Wholesale trade (%)
Most Common Industries - Retail trade (%)
Most Common Industries - Transportation and warehousing, and utilities (%)
Most Common Industries - Transportation and warehousing (%)
Most Common Industries - Utilities (%)
Most Common Industries - Information (%)
Most Common Industries - Finance and insurance, and real estate and rental and leasing (%)
Most Common Industries - Finance and insurance (%)
Most Common Industries - Real estate and rental and leasing (%)
Most Common Industries - Professional, scientific, and management, and administrative and waste management services (%)
Most Common Industries - Professional, scientific, and technical services (%)
Most Common Industries - Management of companies and enterprises (%)
Most Common Industries - Administrative and support and waste management services (%)
Most Common Industries - Educational services, and health care and social assistance (%)
Most Common Industries - Educational services (%)
Most Common Industries - Health care and social assistance (%)
Most Common Industries - Arts, entertainment, and recreation, and accommodation and food services (%)
Most Common Industries - Arts, entertainment, and recreation (%)
Most Common Industries - Accommodation and food services (%)
Most Common Industries - Other services, except public administration (%)
Most Common Industries - Public administration (%)
Occupation diversity
Most Common Occupations - Management, business, science, and arts occupations (%)
Most Common Occupations - Management, business, and financial occupations (%)
Most Common Occupations - Management occupations (%)
Most Common Occupations - Business and financial operations occupations (%)
Most Common Occupations - Computer, engineering, and science occupations (%)
Most Common Occupations - Computer and mathematical occupations (%)
Most Common Occupations - Architecture and engineering occupations (%)
Most Common Occupations - Life, physical, and social science occupations (%)
Most Common Occupations - Education, legal, community service, arts, and media occupations (%)
Most Common Occupations - Community and social service occupations (%)
Most Common Occupations - Legal occupations (%)
Most Common Occupations - Education, training, and library occupations (%)
Most Common Occupations - Arts, design, entertainment, sports, and media occupations (%)
Most Common Occupations - Healthcare practitioners and technical occupations (%)
Most Common Occupations - Health diagnosing and treating practitioners and other technical occupations (%)
Most Common Occupations - Health technologists and technicians (%)
Most Common Occupations - Service occupations (%)
Most Common Occupations - Healthcare support occupations (%)
Most Common Occupations - Protective service occupations (%)
Most Common Occupations - Fire fighting and prevention, and other protective service workers including supervisors (%)
Most Common Occupations - Law enforcement workers including supervisors (%)
Most Common Occupations - Food preparation and serving related occupations (%)
Most Common Occupations - Building and grounds cleaning and maintenance occupations (%)
Most Common Occupations - Personal care and service occupations (%)
Most Common Occupations - Sales and office occupations (%)
Most Common Occupations - Sales and related occupations (%)
Most Common Occupations - Office and administrative support occupations (%)
Most Common Occupations - Natural resources, construction, and maintenance occupations (%)
Most Common Occupations - Farming, fishing, and forestry occupations (%)
Most Common Occupations - Construction and extraction occupations (%)
Most Common Occupations - Installation, maintenance, and repair occupations (%)
Most Common Occupations - Production, transportation, and material moving occupations (%)
Most Common Occupations - Production occupations (%)
Most Common Occupations - Transportation occupations (%)
Most Common Occupations - Material moving occupations (%)
People in Group quarters - Institutionalized population (%)
People in Group quarters - Correctional institutions (%)
People in Group quarters - Federal prisons and detention centers (%)
People in Group quarters - Halfway houses (%)
People in Group quarters - Local jails and other confinement facilities (including police lockups) (%)
People in Group quarters - Military disciplinary barracks (%)
People in Group quarters - State prisons (%)
People in Group quarters - Other types of correctional institutions (%)
People in Group quarters - Nursing homes (%)
People in Group quarters - Hospitals/wards, hospices, and schools for the handicapped (%)
People in Group quarters - Hospitals/wards and hospices for chronically ill (%)
People in Group quarters - Hospices or homes for chronically ill (%)
People in Group quarters - Military hospitals or wards for chronically ill (%)
People in Group quarters - Other hospitals or wards for chronically ill (%)
People in Group quarters - Hospitals or wards for drug/alcohol abuse (%)
People in Group quarters - Mental (Psychiatric) hospitals or wards (%)
People in Group quarters - Schools, hospitals, or wards for the mentally retarded (%)
People in Group quarters - Schools, hospitals, or wards for the physically handicapped (%)
People in Group quarters - Institutions for the deaf (%)
People in Group quarters - Institutions for the blind (%)
People in Group quarters - Orthopedic wards and institutions for the physically handicapped (%)
People in Group quarters - Wards in general hospitals for patients who have no usual home elsewhere (%)
People in Group quarters - Wards in military hospitals for patients who have no usual home elsewhere (%)
People in Group quarters - Juvenile institutions (%)
People in Group quarters - Long-term care (%)
People in Group quarters - Homes for abused, dependent, and neglected children (%)
People in Group quarters - Residential treatment centers for emotionally disturbed children (%)
People in Group quarters - Training schools for juvenile delinquents (%)
People in Group quarters - Short-term care, detention or diagnostic centers for delinquent children (%)
People in Group quarters - Type of juvenile institution unknown (%)
People in Group quarters - Noninstitutionalized population (%)
People in Group quarters - College dormitories (includes college quarters off campus) (%)
People in Group quarters - Military quarters (%)
People in Group quarters - On base (%)
People in Group quarters - Barracks, unaccompanied personnel housing (UPH), (Enlisted/Officer), ;and similar group living quarters for military personnel (%)
People in Group quarters - Transient quarters for temporary residents (%)
People in Group quarters - Military ships (%)
People in Group quarters - Group homes (%)
People in Group quarters - Homes or halfway houses for drug/alcohol abuse (%)
People in Group quarters - Homes for the mentally ill (%)
People in Group quarters - Homes for the mentally retarded (%)
People in Group quarters - Homes for the physically handicapped (%)
People in Group quarters - Other group homes (%)
People in Group quarters - Religious group quarters (%)
People in Group quarters - Dormitories (%)
People in Group quarters - Agriculture workers' dormitories on farms (%)
People in Group quarters - Job Corps and vocational training facilities (%)
People in Group quarters - Other workers' dormitories (%)
People in Group quarters - Crews of maritime vessels (%)
People in Group quarters - Other nonhousehold living situations (%)
People in Group quarters - Other noninstitutional group quarters (%)
Residents speaking English at home (%)
Residents speaking English at home - Born in the United States (%)
Residents speaking English at home - Native, born elsewhere (%)
Residents speaking English at home - Foreign born (%)
Residents speaking Spanish at home (%)
Residents speaking Spanish at home - Born in the United States (%)
Residents speaking Spanish at home - Native, born elsewhere (%)
Residents speaking Spanish at home - Foreign born (%)
Residents speaking other language at home (%)
Residents speaking other language at home - Born in the United States (%)
Residents speaking other language at home - Native, born elsewhere (%)
Residents speaking other language at home - Foreign born (%)
Class of Workers - Employee of private company (%)
Class of Workers - Self-employed in own incorporated business (%)
Class of Workers - Private not-for-profit wage and salary workers (%)
Class of Workers - Local government workers (%)
Class of Workers - State government workers (%)
Class of Workers - Federal government workers (%)
Class of Workers - Self-employed workers in own not incorporated business and Unpaid family workers (%)
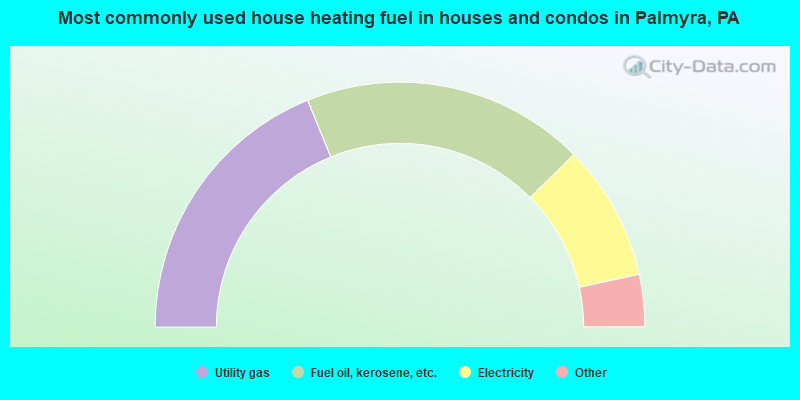
House heating fuel used in houses and condos - Utility gas (%)
House heating fuel used in houses and condos - Bottled, tank, or LP gas (%)
House heating fuel used in houses and condos - Electricity (%)
House heating fuel used in houses and condos - Fuel oil, kerosene, etc. (%)
House heating fuel used in houses and condos - Coal or coke (%)
House heating fuel used in houses and condos - Wood (%)
House heating fuel used in houses and condos - Solar energy (%)
House heating fuel used in houses and condos - Other fuel (%)
House heating fuel used in houses and condos - No fuel used (%)
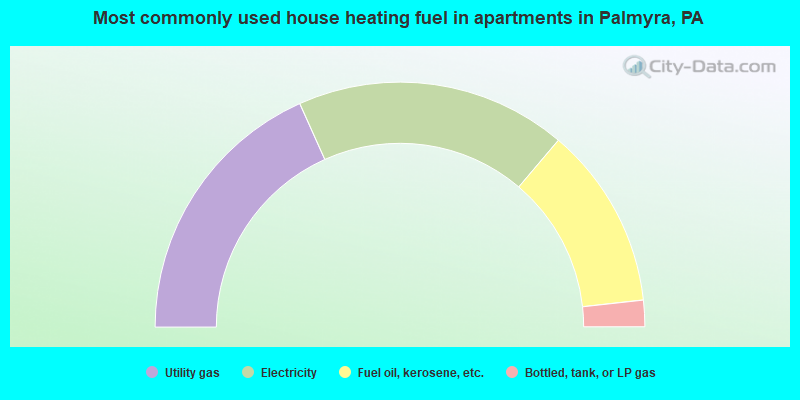
House heating fuel used in apartments - Utility gas (%)
House heating fuel used in apartments - Bottled, tank, or LP gas (%)
House heating fuel used in apartments - Electricity (%)
House heating fuel used in apartments - Fuel oil, kerosene, etc. (%)
House heating fuel used in apartments - Coal or coke (%)
House heating fuel used in apartments - Wood (%)
House heating fuel used in apartments - Solar energy (%)
House heating fuel used in apartments - Other fuel (%)
House heating fuel used in apartments - No fuel used (%)
Armed forces status - In Armed Forces (%)
Armed forces status - Civilian (%)
Armed forces status - Civilian - Veteran (%)
Armed forces status - Civilian - Nonveteran (%)
Fatal accidents locations in years 2005-2021
Fatal accidents locations in 2005
Fatal accidents locations in 2006
Fatal accidents locations in 2007
Fatal accidents locations in 2008
Fatal accidents locations in 2009
Fatal accidents locations in 2010
Fatal accidents locations in 2011
Fatal accidents locations in 2012
Fatal accidents locations in 2013
Fatal accidents locations in 2014
Fatal accidents locations in 2015
Fatal accidents locations in 2016
Fatal accidents locations in 2017
Fatal accidents locations in 2018
Fatal accidents locations in 2019
Fatal accidents locations in 2020
Fatal accidents locations in 2021
Alcohol use - People drinking some alcohol every month (%)
Alcohol use - People not drinking at all (%)
Alcohol use - Average days/month drinking alcohol
Alcohol use - Average drinks/week
Alcohol use - Average days/year people drink much
Audiometry - Average condition of hearing (%)
Audiometry - People that can hear a whisper from across a quiet room (%)
Audiometry - People that can hear normal voice from across a quiet room (%)
Audiometry - Ears ringing, roaring, buzzing (%)
Audiometry - Had a job exposure to loud noise (%)
Audiometry - Had off-work exposure to loud noise (%)
Blood Pressure & Cholesterol - Has high blood pressure (%)
Blood Pressure & Cholesterol - Checking blood pressure at home (%)
Blood Pressure & Cholesterol - Frequently checking blood cholesterol (%)
Blood Pressure & Cholesterol - Has high cholesterol level (%)
Consumer Behavior - Money monthly spent on food at supermarket/grocery store
Consumer Behavior - Money monthly spent on food at other stores
Consumer Behavior - Money monthly spent on eating out
Consumer Behavior - Money monthly spent on carryout/delivered foods
Consumer Behavior - Income spent on food at supermarket/grocery store (%)
Consumer Behavior - Income spent on food at other stores (%)
Consumer Behavior - Income spent on eating out (%)
Consumer Behavior - Income spent on carryout/delivered foods (%)
Current Health Status - General health condition (%)
Current Health Status - Blood donors (%)
Current Health Status - Has blood ever tested for HIV virus (%)
Current Health Status - Left-handed people (%)
Dermatology - People using sunscreen (%)
Diabetes - Diabetics (%)
Diabetes - Had a blood test for high blood sugar (%)
Diabetes - People taking insulin (%)
Diet Behavior & Nutrition - Diet health (%)
Diet Behavior & Nutrition - Milk product consumption (# of products/month)
Diet Behavior & Nutrition - Meals not home prepared (#/week)
Diet Behavior & Nutrition - Meals from fast food or pizza place (#/week)
Diet Behavior & Nutrition - Ready-to-eat foods (#/month)
Diet Behavior & Nutrition - Frozen meals/pizza (#/month)
Drug Use - People that ever used marijuana or hashish (%)
Drug Use - Ever used hard drugs (%)
Drug Use - Ever used any form of cocaine (%)
Drug Use - Ever used heroin (%)
Drug Use - Ever used methamphetamine (%)
Health Insurance - People covered by health insurance (%)
Kidney Conditions-Urology - Avg. # of times urinating at night
Medical Conditions - People with asthma (%)
Medical Conditions - People with anemia (%)
Medical Conditions - People with psoriasis (%)
Medical Conditions - People with overweight (%)
Medical Conditions - Elderly people having difficulties in thinking or remembering (%)
Medical Conditions - People who ever received blood transfusion (%)
Medical Conditions - People having trouble seeing even with glass/contacts (%)
Medical Conditions - People with arthritis (%)
Medical Conditions - People with gout (%)
Medical Conditions - People with congestive heart failure (%)
Medical Conditions - People with coronary heart disease (%)
Medical Conditions - People with angina pectoris (%)
Medical Conditions - People who ever had heart attack (%)
Medical Conditions - People who ever had stroke (%)
Medical Conditions - People with emphysema (%)
Medical Conditions - People with thyroid problem (%)
Medical Conditions - People with chronic bronchitis (%)
Medical Conditions - People with any liver condition (%)
Medical Conditions - People who ever had cancer or malignancy (%)
Mental Health - People who have little interest in doing things (%)
Mental Health - People feeling down, depressed, or hopeless (%)
Mental Health - People who have trouble sleeping or sleeping too much (%)
Mental Health - People feeling tired or having little energy (%)
Mental Health - People with poor appetite or overeating (%)
Mental Health - People feeling bad about themself (%)
Mental Health - People who have trouble concentrating on things (%)
Mental Health - People moving or speaking slowly or too fast (%)
Mental Health - People having thoughts they would be better off dead (%)
Oral Health - Average years since last visit a dentist
Oral Health - People embarrassed because of mouth (%)
Oral Health - People with gum disease (%)
Oral Health - General health of teeth and gums (%)
Oral Health - Average days a week using dental floss/device
Oral Health - Average days a week using mouthwash for dental problem
Oral Health - Average number of teeth
Pesticide Use - Households using pesticides to control insects (%)
Pesticide Use - Households using pesticides to kill weeds (%)
Physical Activity - People doing vigorous-intensity work activities (%)
Physical Activity - People doing moderate-intensity work activities (%)
Physical Activity - People walking or bicycling (%)
Physical Activity - People doing vigorous-intensity recreational activities (%)
Physical Activity - People doing moderate-intensity recreational activities (%)
Physical Activity - Average hours a day doing sedentary activities
Physical Activity - Average hours a day watching TV or videos
Physical Activity - Average hours a day using computer
Physical Functioning - People having limitations keeping them from working (%)
Physical Functioning - People limited in amount of work they can do (%)
Physical Functioning - People that need special equipment to walk (%)
Physical Functioning - People experiencing confusion/memory problems (%)
Physical Functioning - People requiring special healthcare equipment (%)
Prescription Medications - Average number of prescription medicines taking
Preventive Aspirin Use - Adults 40+ taking low-dose aspirin (%)
Reproductive Health - Vaginal deliveries (%)
Reproductive Health - Cesarean deliveries (%)
Reproductive Health - Deliveries resulted in a live birth (%)
Reproductive Health - Pregnancies resulted in a delivery (%)
Reproductive Health - Women breastfeeding newborns (%)
Reproductive Health - Women that had a hysterectomy (%)
Reproductive Health - Women that had both ovaries removed (%)
Reproductive Health - Women that have ever taken birth control pills (%)
Reproductive Health - Women taking birth control pills (%)
Reproductive Health - Women that have ever used Depo-Provera or injectables (%)
Reproductive Health - Women that have ever used female hormones (%)
Sexual Behavior - People 18+ that ever had sex (vaginal, anal, or oral) (%)
Sexual Behavior - Males 18+ that ever had vaginal sex with a woman (%)
Sexual Behavior - Males 18+ that ever performed oral sex on a woman (%)
Sexual Behavior - Males 18+ that ever had anal sex with a woman (%)
Sexual Behavior - Males 18+ that ever had any sex with a man (%)
Sexual Behavior - Females 18+ that ever had vaginal sex with a man (%)
Sexual Behavior - Females 18+ that ever performed oral sex on a man (%)
Sexual Behavior - Females 18+ that ever had anal sex with a man (%)
Sexual Behavior - Females 18+ that ever had any kind of sex with a woman (%)
Sexual Behavior - Average age people first had sex
Sexual Behavior - Average number of female sex partners in lifetime (males 18+)
Sexual Behavior - Average number of female vaginal sex partners in lifetime (males 18+)
Sexual Behavior - Average age people first performed oral sex on a woman (18+)
Sexual Behavior - Average number of woman performed oral sex on in lifetime (18+)
Sexual Behavior - Average number of male sex partners in lifetime (males 18+)
Sexual Behavior - Average number of male anal sex partners in lifetime (males 18+)
Sexual Behavior - Average age people first performed oral sex on a man (18+)
Sexual Behavior - Average number of male oral sex partners in lifetime (18+)
Sexual Behavior - People using protection when performing oral sex (%)
Sexual Behavior - Average number of times people have vaginal or anal sex a year
Sexual Behavior - People having sex without condom (%)
Sexual Behavior - Average number of male sex partners in lifetime (females 18+)
Sexual Behavior - Average number of male vaginal sex partners in lifetime (females 18+)
Sexual Behavior - Average number of female sex partners in lifetime (females 18+)
Sexual Behavior - Circumcised males 18+ (%)
Sleep Disorders - Average hours sleeping at night
Sleep Disorders - People that has trouble sleeping (%)
Smoking-Cigarette Use - People smoking cigarettes (%)
Taste & Smell - People 40+ having problems with smell (%)
Taste & Smell - People 40+ having problems with taste (%)
Taste & Smell - People 40+ that ever had wisdom teeth removed (%)
Taste & Smell - People 40+ that ever had tonsils teeth removed (%)
Taste & Smell - People 40+ that ever had a loss of consciousness because of a head injury (%)
Taste & Smell - People 40+ that ever had a broken nose or other serious injury to face or skull (%)
Taste & Smell - People 40+ that ever had two or more sinus infections (%)
Weight - Average height (inches)
Weight - Average weight (pounds)
Weight - Average BMI
Weight - People that are obese (%)
Weight - People that ever were obese (%)
Weight - People trying to lose weight (%)
Officers per 1,000 residents here:
1.46Pennsylvania average:
2.55
Latest news from Palmyra, PA collected exclusively by city-data.com from local newspapers, TV, and radio stations
Ancestries: German (33.6%), American (9.6%), Italian (9.6%), Irish (4.9%), English (4.1%), Polish (2.6%).
Current Local Time:
Incorporated on 11/10/1913
Land area: 1.86 square miles.
Population density: 4,155 people per square mile (average).
372 residents are foreign born (3.3% Asia , 0.7% Latin America , 0.6% Europe ).
This borough:
4.8%Pennsylvania:
7.3%
Median real estate property taxes paid for housing units with mortgages in 2022: $3,282 (1.4%)Median real estate property taxes paid for housing units with no mortgage in 2022: $2,652 (1.5%)
Nearest city with pop. 50,000+: Lancaster, PA
Nearest city with pop. 200,000+: Baltimore, MD
Nearest city with pop. 1,000,000+: Philadelphia, PA
Nearest cities:
Latitude: 40.31 N, Longitude: 76.59 W
Daytime population change due to commuting: -900 (-11.5%)Workers who live and work in this borough: 1,243 (29.7%)
Unemployment in December 2023: Here:
2.3%Pennsylvania:
2.9%
Population change in the 1990s: +125 (+1.8%).
Most common occupations in Palmyra, PA (%)
Both Males Females
Other production occupations, including supervisors (6.7%)
Building and grounds cleaning and maintenance occupations (5.8%)
Other office and administrative support workers, including supervisors (5.0%)
Laborers and material movers, hand (3.5%)
Other sales and related occupations, including supervisors (3.5%)
Other management occupations, except farmers and farm managers (3.3%)
Electrical equipment mechanics and other installation, maintenance, and repair workers, including supervisors (3.2%)
Other production occupations, including supervisors (8.3%)
Laborers and material movers, hand (6.5%)
Electrical equipment mechanics and other installation, maintenance, and repair workers, including supervisors (6.2%)
Building and grounds cleaning and maintenance occupations (4.7%)
Other sales and related occupations, including supervisors (4.7%)
Material recording, scheduling, dispatching, and distributing workers (4.4%)
Driver/sales workers and truck drivers (3.9%)
Building and grounds cleaning and maintenance occupations (7.0%)
Other office and administrative support workers, including supervisors (6.8%)
Other production occupations, including supervisors (5.1%)
Waiters and waitresses (4.9%)
Secretaries and administrative assistants (4.4%)
Other management occupations, except farmers and farm managers (4.1%)
Health technologists and technicians (4.1%)
Tornado activity:
Palmyra-area historical tornado activity is slightly above Pennsylvania state average. It is 11% greater than the overall U.S. average.
On 7/14/2004, a category F3 (max. wind speeds 158-206 mph) tornado 2.1 miles away from the Palmyra borough center caused $18 million in damages.
On 6/18/1970, a category F3 tornado 16.7 miles away from the borough center killed one person and injured 5 people and caused between $500,000 and $5,000,000 in damages.
Earthquake activity:
Palmyra-area historical earthquake activity is significantly above Pennsylvania state average. It is 64% smaller than the overall U.S. average. On 8/23/2011 at 17:51:04, a magnitude 5.8 (5.8 MW, Depth: 3.7 mi, Class: Moderate, Intensity: VI - VII) earthquake occurred 180.9 miles away from Palmyra center On 1/16/1994 at 01:49:16, a magnitude 4.6 (4.6 MB, 4.6 LG, Depth: 3.1 mi, Class: Light, Intensity: IV - V) earthquake occurred 29.4 miles away from the city center On 9/25/1998 at 19:52:52, a magnitude 5.2 (4.8 MB, 4.3 MS, 5.2 LG, 4.5 MW, Depth: 3.1 mi) earthquake occurred 214.9 miles away from Palmyra center On 1/16/1994 at 00:42:43, a magnitude 4.2 (4.2 MB, 4.0 LG, Depth: 3.1 mi) earthquake occurred 31.0 miles away from Palmyra center On 10/7/1983 at 10:18:46, a magnitude 5.3 (5.1 MB, 5.3 LG, 5.1 ML) earthquake occurred 277.3 miles away from Palmyra center On 1/31/1986 at 16:46:43, a magnitude 5.0 (5.0 MB) earthquake occurred 254.7 miles away from the city center Magnitude types: regional Lg-wave magnitude (LG), body-wave magnitude (MB), local magnitude (ML), surface-wave magnitude (MS), moment magnitude (MW) Natural disasters: The number of natural disasters in Lebanon County (17) is near the US average (15).Major Disasters (Presidential) Declared: 13Emergencies Declared: 4Floods: 4, Storms: 4, Winter Storms: 4, Snowstorms: 3, Tropical Storms: 3, Hurricanes: 2, Blizzard: 1, Heavy Rain: 1, Mudslide: 1, Snowfall: 1, Tropical Depression: 1, Other: 1 (Note: some incidents may be assigned to more than one category). Hospitals and medical centers in Palmyra: LEBANON VALLEY BRETHREN HOME (1200 GRUBB STREET)
PALMYRA HEALTH AND REHABILITATION CENTER (341 NORTH RAILROAD ST)
TWIN OAKS HEALTH AND REHABILITATION CENTER (2880 HORSESHOE PIKE PO BOX 137)
FRESENIUS MEDICAL CARE PALMYRA/LEBANON COUNTY (38-42 N. LONDONDERRY SQUARE)
Airports located in Palmyra: Amtrak stations near Palmyra: 12 miles: ELIZABETHTOWN (WILSON AVE.) Services: public payphones, free short-term parking, free long-term parking, call for taxi service.
15 miles: MOUNT JOY (DELTA & HENRY STS.) Services: public payphones, free short-term parking, call for taxi service, public transit connection.
16 miles: HARRISBURG (4TH & CHESTNUT STS.) Services: ticket office, fully wheelchair accessible, enclosed waiting area, public restrooms, public payphones, snack bar, ATM, paid short-term parking, paid long-term parking, call for car rental service, taxi stand, intercity bus service, public transit connection.
Colleges/universities with over 2000 students nearest to Palmyra:
Pennsylvania State University-Penn State Harrisburg (about 11 miles; Middletown, PA ; Full-time enrollment: 3,797)
Harrisburg Area Community College-Harrisburg (about 16 miles; Harrisburg, PA ; FT enrollment: 13,276)
YTI Career Institute-York (about 23 miles; York, PA ; FT enrollment: 2,212)
Franklin and Marshall College (about 24 miles; Lancaster, PA ; FT enrollment: 2,585)
Messiah College (about 24 miles; Mechanicsburg, PA ; FT enrollment: 3,035)
Millersville University of Pennsylvania (about 25 miles; Millersville, PA ; FT enrollment: 7,743)
York College Pennsylvania (about 26 miles; York, PA ; FT enrollment: 5,140)
Public high school in Palmyra:
Public elementary/middle schools in Palmyra: PALMYRA AREA MS Students: 727, Location: 50 W CHERRY ST, Grades: 6-8)PINE STREET EL SCH Students: 471, Location: 50 W PINE ST, Grades: 1-5)FORGE ROAD EL SCH Students: 411, Location: 400 S FORGE RD, Grades: 1-5)NORTHSIDE EL SCH Location: 301 E SPRUCE ST, Grades: 1-5)LINGLE AVENUE EL SCH Location: 600 S LINGLE AVE, Grades: KG-5)
See full list of schools located in Palmyra Library in Palmyra: PALMYRA PUBLIC LIBRARY Operating income: $260,464; Location: 325 SOUTH RAILROAD STREET; 51,302 books ; 3,442 audio materials ; 3,331 video materials ; 2 local licensed databases ; 41 state licensed databases ; 4 other licensed databases ; 55 print serial subscriptions ; 58 electronic serial subscriptions )
Birthplace of: Tom Brandt - Footballer.
Lebanon County has a predicted average indoor radon screening level greater than 4 pCi/L (pico curies per liter) - Highest Potential Drinking water stations with addresses in Palmyra and their reported violations in the past:
CRALEY MHP (Population served: 35, Groundwater):
Past health violations:
MCL, Single Sample - Between OCT-2009 and DEC-2009, Contaminant: Nitrate. Follow-up actions: St Public Notif requested (FEB-05-2010), St Violation/Reminder Notice (FEB-05-2010), St Compliance achieved (MAR-16-2010), St Public Notif received (MAR-16-2010)
Past monitoring violations:
Monitoring of Treatment (SWTR-Unfilt/GWR) - In JUN-2014, Contaminant: GROUNDWATER RULE. Follow-up actions: St Violation/Reminder Notice (AUG-19-2014), St Compliance achieved (AUG-19-2014)
Monitoring of Treatment (SWTR-Unfilt/GWR) - In MAY-2014, Contaminant: GROUNDWATER RULE. Follow-up actions: St Violation/Reminder Notice (AUG-19-2014), St Compliance achieved (AUG-19-2014)
Monitoring and Reporting (DBP) - Between APR-2014 and JUN-2014, Contaminant: Total Haloacetic Acids (HAA5). Follow-up actions: St Violation/Reminder Notice (AUG-19-2014)
Monitoring of Treatment (SWTR-Unfilt/GWR) - In JUN-2013, Contaminant: GROUNDWATER RULE. Follow-up actions: St Compliance achieved (AUG-22-2013)
Monitoring of Treatment (SWTR-Unfilt/GWR) - In MAY-2013, Contaminant: GROUNDWATER RULE. Follow-up actions: St Violation/Reminder Notice (JUL-11-2013), St Compliance achieved (JUL-11-2013)
One routine major monitoring violation
One regular monitoring violation
4 other older monitoring violations
Drinking water stations with addresses in Palmyra that have no violations reported:
IN THE NET SPORTS COMPLEX (Population served: 200, Primary Water Source Type: Groundwater)
Average household size: This borough:
2.2 peoplePennsylvania:
2.5 people
Percentage of family households: This borough:
59.4%Whole state:
65.0%
Percentage of households with unmarried partners: This borough:
7.4%Whole state:
6.6%
Likely homosexual households (counted as self-reported same-sex unmarried-partner households)
Lesbian couples: 0.3% of all households Gay men: 0.4% of all households
38 people in nursing facilities/skilled-nursing facilities in 2010people in nursing homes in 2000people in homes for the mentally ill in 2000
Banks with branches in Palmyra (2011 data):
Jonestown Bank and Trust Company, of Jonestown, Pennsylvania: Northside Commons Branch, Palmyra Branch, Lebanon Valley Brethren Home Office. Info updated 2006/11/03: Bank assets: $378.3 mil, Deposits: $332.8 mil, headquarters in Jonestown, PA, positive income , Consumer Lending Specialization, 11 total offices
Fulton Bank, National Association: Palmyra Shopping Center Branch at 901 East Main Street, branch established on 1961/12/26; Palmyra Branch at 1 West Main Street, branch established on 1956/11/01. Info updated 2010/12/30: Bank assets: $9,041.7 mil, Deposits: $6,700.3 mil, headquarters in Lancaster, PA, positive income , Commercial Lending Specialization, 122 total offices , Holding Company: Fulton Financial Corporation
Metro Bank: Palmyra Branch at 903 East Main Street, branch established on 2000/10/28. Info updated 2009/09/09: Bank assets: $2,417.8 mil, Deposits: $2,091.3 mil, headquarters in Lemoyne, PA, positive income , Commercial Lending Specialization, 33 total offices , Holding Company: Metro Bancorp, Inc.
Wells Fargo Bank, National Association: East Palmyra Branch at 840 East Main Street, branch established on 1964/07/23. Info updated 2011/04/05: Bank assets: $1,161,490.0 mil, Deposits: $905,653.0 mil, headquarters in Sioux Falls, SD, positive income , 6395 total offices , Holding Company: Wells Fargo & Company
Woodforest National Bank: Palmyra Wal-Mart Branch at 100 N Londonderry Sq., branch established on 2007/05/05. Info updated 2011/05/10: Bank assets: $3,488.9 mil, Deposits: $3,097.6 mil, headquarters in Houston, TX, positive income , Commercial Lending Specialization, 766 total offices , Holding Company: Woodforest Financial Group Employee Stock Ownership Plan (With 401(K) Provisions)
Northwest Savings Bank: Palmyra Branch at 1044 East Main Street, branch established on 1923/01/01. Info updated 2009/11/23: Bank assets: $7,975.9 mil, Deposits: $5,985.6 mil, headquarters in Warren, PA, positive income , Mortgage Lending Specialization, 172 total offices
For population 15 years and over in Palmyra:
Never married: 38.1%Now married: 41.4%Separated: 2.1%Widowed: 7.4%Divorced: 10.9% For population 25 years and over in Palmyra:
High school or higher: 92.7%Bachelor's degree or higher: 23.1%Graduate or professional degree: 9.4%Unemployed: 3.7%Mean travel time to work (commute): 17.8 minutes
Education Gini index (Inequality in education) Here:
9.1Pennsylvania average:
11.4
Religion statistics for Palmyra, PA (based on Lebanon County data)
Religion Adherents Congregations Mainline Protestant 29,373 80 Evangelical Protestant 13,839 97 Catholic 12,218 8 Other 1,294 5 Orthodox 228 2 Black Protestant 55 1 None 76,561 -
Source: Clifford Grammich, Kirk Hadaway, Richard Houseal, Dale E.Jones, Alexei Krindatch, Richie Stanley and Richard H.Taylor. 2012. 2010 U.S.Religion Census: Religious Congregations & Membership Study. Association of Statisticians of American Religious Bodies. Jones, Dale E., et al. 2002. Congregations and Membership in the United States 2000. Nashville, TN: Glenmary Research Center. Graphs represent county-level data
Food Environment Statistics: Number of grocery stores : 31This county :
2.42 / 10,000 pop.State :
2.04 / 10,000 pop.
Number of supercenters and club stores : 2This county :
0.16 / 10,000 pop.Pennsylvania :
0.09 / 10,000 pop.
Number of convenience stores (no gas) : 7Lebanon County :
0.55 / 10,000 pop.State :
0.88 / 10,000 pop.
Number of convenience stores (with gas) : 40Here :
3.13 / 10,000 pop.Pennsylvania :
2.52 / 10,000 pop.
Number of full-service restaurants : 81Here :
6.34 / 10,000 pop.Pennsylvania :
7.12 / 10,000 pop.
Adult diabetes rate : This county :
8.4%State :
9.1%
Adult obesity rate : Lebanon County :
28.9%Pennsylvania :
27.2%
Low-income preschool obesity rate : This county :
14.0%Pennsylvania :
11.5%
Health and Nutrition: Healthy diet rate : Palmyra:
47.8%Pennsylvania:
50.2%
Average overall health of teeth and gums : Average BMI : Palmyra:
29.1Pennsylvania:
28.7
People feeling badly about themselves : Here:
23.9%Pennsylvania:
20.8%
People not drinking alcohol at all : Palmyra:
12.0%Pennsylvania:
10.9%
Average hours sleeping at night : Palmyra:
6.9Pennsylvania:
6.8
General health condition : This city:
54.0%Pennsylvania:
56.2%
Average condition of hearing : More about Health and Nutrition of Palmyra, PA Residents
Local government employment and payroll (March 2022)
Function
Full-time employees
Monthly full-time payroll
Average yearly full-time wage
Part-time employees
Monthly part-time payroll
Streets and Highways
10 $48,127 $57,752 0 $0 Police Protection - Officers
9 $82,608 $110,144 0 $0 Financial Administration
7 $34,698 $59,482 1 $3,277 Sewerage
6 $36,228 $72,456 0 $0 Other Government Administration
0 $0 9 $9,157 Police - Other
0 $0 14 $14,358
Totals for Government
32 $201,661 $75,623 24 $26,792
Palmyra government finances - Expenditure in 2017 (per resident):
Construction - Parks and Recreation: $417,000 ($53.95)
General Public Buildings: $211,000 ($27.30)Current Operations - Natural Resources - Other: $1,911,000 ($247.22)
Sewerage: $1,595,000 ($206.34)Police Protection: $1,139,000 ($147.35)Solid Waste Management: $1,138,000 ($147.22)Regular Highways: $1,090,000 ($141.01)Parks and Recreation: $454,000 ($58.73)Central Staff Services: $292,000 ($37.77)General Public Buildings: $220,000 ($28.46)Local Fire Protection: $193,000 ($24.97)General - Other: $116,000 ($15.01)Libraries: $80,000 ($10.35)Judicial and Legal Services: $24,000 ($3.10)Financial Administration: $8,000 ($1.03)Protective Inspection and Regulation - Other: $8,000 ($1.03)General - Interest on Debt: $174,000 ($22.51)
Other Capital Outlay - Police Protection: $33,000 ($4.27)
Regular Highways: $14,000 ($1.81)Parks and Recreation: $11,000 ($1.42)Central Staff Services: $7,000 ($0.91)Total Salaries and Wages: $1,276,000 ($165.07)
Palmyra government finances - Revenue in 2017 (per resident):
Charges - Sewerage: $1,438,000 ($186.03)
Solid Waste Management: $814,000 ($105.30)Other: $31,000 ($4.01)Federal Intergovernmental - Other: $14,000 ($1.81)
Local Intergovernmental - Other: $13,000 ($1.68)
Miscellaneous - General Revenue - Other: $179,000 ($23.16)
Fines and Forfeits: $50,000 ($6.47)Interest Earnings: $33,000 ($4.27)Rents: $24,000 ($3.10)Donations From Private Sources: $19,000 ($2.46)Sale of Property: $2,000 ($0.26)State Intergovernmental - Other: $336,000 ($43.47)
Highways: $206,000 ($26.65)General Local Government Support: $8,000 ($1.03)Tax - Property: $1,420,000 ($183.70)
Individual Income: $839,000 ($108.54)Public Utility License: $145,000 ($18.76)Documentary and Stock Transfer: $122,000 ($15.78)Occupation and Business License - Other: $119,000 ($15.39)
Palmyra government finances - Debt in 2017 (per resident):
Long Term Debt - Outstanding Unspecified Public Purpose: $6,606,000 ($854.59)
Beginning Outstanding - Unspecified Public Purpose: $4,357,000 ($563.65)Issue, Unspecified Public Purpose: $2,534,000 ($327.81)Retired Unspecified Public Purpose: $285,000 ($36.87)
Palmyra government finances - Cash and Securities in 2017 (per resident):
Bond Funds - Cash and Securities: $1,556,000 ($201.29)
Other Funds - Cash and Securities: $9,083,000 ($1175.03)
5.22% of this county's 2021 resident taxpayers lived in other counties in 2020 ($56,632 average adjusted gross income )
Here:
5.22%Pennsylvania average:
5.27%
0.04% of residents moved from foreign countries ($241 average AGI )Lebanon County:
0.04%Pennsylvania average:
0.01%
Top counties from which taxpayers relocated into this county between 2020 and 2021:
5.18% of this county's 2020 resident taxpayers moved to other counties in 2021 ($56,825 average adjusted gross income )
Here:
5.18%Pennsylvania average:
5.44%
0.04% of residents moved to foreign countries ($110 average AGI )Lebanon County:
0.04%Pennsylvania average:
0.01%
Top counties to which taxpayers relocated from this county between 2020 and 2021:
Businesses in Palmyra, PA
Name Count Name Count
Advance Auto Parts 1 MasterBrand Cabinets 4 Arby's 1 McDonald's 1 Burger King 1 Pizza Hut 1 Chevrolet 1 Rite Aid 2 Dairy Queen 1 SONIC Drive-In 1 Decora Cabinetry 3 Sprint Nextel 1 Dunkin Donuts 1 Subway 2 FedEx 1 T-Mobile 1 Ford 1 U-Haul 1 H&R Block 1 UPS 2 Knights Inn 1 Walmart 1 Kroger 1 Wendy's 1 Lowe's 1
Strongest AM radio stations in Palmyra:
WWSM (1510 AM; daytime; 5 kW; ANNVILLE-CLEONA, PA; Owner: PATRICK H. SICKAFUS)
WLBR (1270 AM; 5 kW; LEBANON, PA; Owner: LEBANON BROADCASTING COMPANY)
WHP (580 AM; 5 kW; HARRISBURG, PA; Owner: CLEAR CHANNEL BROADCASTING LICENSES, INC.)
WEEU (830 AM; 20 kW; READING, PA; Owner: WEEU BROADCASTING COMPANY)
WCBM (680 AM; 50 kW; BALTIMORE, MD; Owner: WCBM MARYLAND, INC.)
WWJZ (640 AM; 50 kW; MOUNT HOLLY, NJ; Owner: ABC, INC.)
WVCH (740 AM; 50 kW; CHESTER, PA; Owner: WVCH COMMUNICATIONS, INC.)
WTKT (1460 AM; 5 kW; HARRISBURG, PA; Owner: CLEAR CHANNEL BROADCASTING LICENSES, INC.)
WBAL (1090 AM; 50 kW; BALTIMORE, MD; Owner: HEARST RADIO, INC.)
WSBA (910 AM; 5 kW; YORK, PA; Owner: WSBA LICO, INC.)
WZZD (990 AM; 50 kW; PHILADELPHIA, PA; Owner: PENNSYLVANIA MEDIA ASSOCIATES, INC.)
WPEN (950 AM; 50 kW; PHILADELPHIA, PA; Owner: GREATER PHILADELPHIA RADIO, INC.)
KYW (1060 AM; 50 kW; PHILADELPHIA, PA; Owner: INFINITY BROADCASTING OPERATIONS, INC.)
Strongest FM radio stations in Palmyra:
WWKL (92.1 FM; PALMYRA, PA; Owner: CUMULUS LICENSING CORP.)
WCAT-FM (106.7 FM; HERSHEY, PA; Owner: CITADEL BROADCASTING COMPANY)
WITF-FM (89.5 FM; HARRISBURG, PA; Owner: WITF, INC.)
WROZ (101.3 FM; LANCASTER, PA; Owner: HALL COMMUNICATIONS, INC.)
WARM-FM (103.3 FM; YORK, PA; Owner: WSBA LICO, INC.)
WRVV (97.3 FM; HARRISBURG, PA; Owner: CLEAR CHANNEL BROADCASTING LICENSES, INC.)
WHBO (92.7 FM; STARVIEW, PA; Owner: HALL COMMUNICATIONS, INC.)
WQIC (100.1 FM; LEBANON, PA; Owner: LEBANON BROADCASTING CO.)
WTPA (93.5 FM; MECHANICSBURG, PA; Owner: CUMULUS LICENSING CORP.)
WHKF (99.3 FM; HARRISBURG, PA; Owner: CLEAR CHANNEL BROADCASTING LICENSES, INC.)
WRTL (90.7 FM; EPHRATA, PA; Owner: TEMPLE UNIV OF COMMONWEALTH SYSTEM)
WNNK-FM (104.1 FM; HARRISBURG, PA; Owner: CUMULUS LICENSING CORP.)
WIOV-FM (105.1 FM; EPHRATA, PA; Owner: REGENT BROADCASTING OF LANCASTER, INC.)
WRBT (94.9 FM; HARRISBURG, PA; Owner: CLEAR CHANNEL BROADCASTING LICENSES, INC.)
W220BX (91.9 FM; MARIETTA, PA; Owner: CALVARY CHAPEL OF TWIN FALLS, INC.)
WQXA-FM (105.7 FM; YORK, PA; Owner: CITADEL BROADCASTING COMPANY)
WJAZ (91.7 FM; SUMMERDALE, PA; Owner: TEMPLE UNIV. COMMWEALTH SYS. HGHR ED)
WSOX (96.1 FM; RED LION, PA; Owner: LANCASTER-YORK BROADCASTING, LLC)
WLAN-FM (96.9 FM; LANCASTER, PA; Owner: CLEAR CHANNEL BROADCASTING LICENSES, INC.)
WQLV (98.9 FM; MILLERSBURG, PA; Owner: HEPCO COMMUNICATIONS, INC.)
TV broadcast stations around Palmyra:
WLYH-TV (Channel 15; LANCASTER, PA; Owner: TELEVISION STATION GROUP LICENSE SUBSIDIARY, LLC)
WITF-TV (Channel 33; HARRISBURG, PA; Owner: WITF, INC.)
WPMT (Channel 43; YORK, PA; Owner: TRIBUNE TELEVISION COMPANY)
WGAL (Channel 8; LANCASTER, PA; Owner: WGAL HEARST-ARGYLE TELEVISION, INC.)
WHP-TV (Channel 21; HARRISBURG, PA; Owner: CLEAR CHANNEL BROADCASTING LICENSES, INC.)
WHTM-TV (Channel 27; HARRISBURG, PA; Owner: HARRISBURG TELEVISION, INC.)
WTVE (Channel 51; READING, PA; Owner: READING BROADCASTING, INC.)
National Bridge Inventory (NBI) Statistics 8 Number of bridges89ft / 26.8m Total length $1,545,000 Total costs11,979 Total average daily traffic576 Total average daily truck traffic15,822 Total future (year 2030) average daily traffic
Home Mortgage Disclosure Act Aggregated Statistics For Year 2009(Based on 1 full tract) A) FHA, FSA/RHS & VA B) Conventional C) Refinancings D) Home Improvement Loans E) Loans on Dwellings For 5+ Families F) Non-occupant Loans on G) Loans On Manufactured Number Average Value Number Average Value Number Average Value Number Average Value Number Average Value Number Average Value Number Average Value
LOANS ORIGINATED 39 $143,821 52 $133,750 125 $121,680 12 $52,750 1 $240,000 18 $120,722 5 $49,600 APPLICATIONS APPROVED, NOT ACCEPTED 1 $218,000 4 $78,500 19 $123,000 1 $8,000 0 $0 3 $103,667 3 $73,333 APPLICATIONS DENIED 3 $120,333 6 $124,167 60 $128,000 10 $21,900 0 $0 6 $88,333 5 $49,800 APPLICATIONS WITHDRAWN 3 $147,667 4 $159,500 44 $132,636 0 $0 2 $292,000 3 $122,333 0 $0 FILES CLOSED FOR INCOMPLETENESS 0 $0 3 $94,333 8 $171,000 0 $0 0 $0 0 $0 1 $65,000
Aggregated Statistics For Year 2008(Based on 1 full tract) A) FHA, FSA/RHS & VA B) Conventional C) Refinancings D) Home Improvement Loans E) Loans on Dwellings For 5+ Families F) Non-occupant Loans on G) Loans On Manufactured Number Average Value Number Average Value Number Average Value Number Average Value Number Average Value Number Average Value Number Average Value
LOANS ORIGINATED 29 $158,690 79 $148,722 129 $113,271 49 $45,531 1 $720,000 24 $114,042 8 $53,500 APPLICATIONS APPROVED, NOT ACCEPTED 0 $0 8 $116,375 25 $110,000 6 $52,167 0 $0 4 $121,500 2 $28,500 APPLICATIONS DENIED 5 $146,200 14 $81,000 103 $140,223 32 $50,312 0 $0 7 $93,714 7 $46,714 APPLICATIONS WITHDRAWN 4 $165,750 4 $193,000 30 $141,000 4 $34,500 0 $0 3 $172,667 0 $0 FILES CLOSED FOR INCOMPLETENESS 2 $130,500 3 $70,667 5 $185,200 1 $138,000 0 $0 0 $0 1 $85,000
Aggregated Statistics For Year 2007(Based on 1 full tract) A) FHA, FSA/RHS & VA B) Conventional C) Refinancings D) Home Improvement Loans E) Loans on Dwellings For 5+ Families F) Non-occupant Loans on G) Loans On Manufactured Number Average Value Number Average Value Number Average Value Number Average Value Number Average Value Number Average Value Number Average Value
LOANS ORIGINATED 13 $136,462 131 $133,595 161 $94,180 55 $38,782 3 $297,333 29 $106,655 3 $50,333 APPLICATIONS APPROVED, NOT ACCEPTED 1 $103,000 9 $159,667 33 $74,788 7 $91,714 0 $0 4 $234,000 3 $49,333 APPLICATIONS DENIED 1 $290,000 16 $121,562 106 $130,717 32 $48,656 0 $0 10 $125,600 1 $20,000 APPLICATIONS WITHDRAWN 0 $0 14 $179,714 28 $113,286 4 $70,500 0 $0 4 $134,500 2 $57,000 FILES CLOSED FOR INCOMPLETENESS 0 $0 7 $99,571 17 $161,706 0 $0 0 $0 2 $152,000 1 $43,000
Aggregated Statistics For Year 2006(Based on 1 full tract) A) FHA, FSA/RHS & VA B) Conventional C) Refinancings D) Home Improvement Loans E) Loans on Dwellings For 5+ Families F) Non-occupant Loans on G) Loans On Manufactured Number Average Value Number Average Value Number Average Value Number Average Value Number Average Value Number Average Value Number Average Value
LOANS ORIGINATED 16 $147,438 184 $120,880 128 $90,234 56 $30,161 2 $182,500 31 $112,806 10 $55,300 APPLICATIONS APPROVED, NOT ACCEPTED 0 $0 13 $82,846 29 $105,310 3 $65,667 1 $240,000 7 $99,000 0 $0 APPLICATIONS DENIED 1 $160,000 28 $81,821 109 $108,193 30 $56,533 0 $0 7 $122,000 5 $44,200 APPLICATIONS WITHDRAWN 1 $76,000 10 $80,300 45 $119,333 3 $54,333 0 $0 1 $16,000 1 $24,000 FILES CLOSED FOR INCOMPLETENESS 0 $0 5 $125,000 18 $112,278 0 $0 0 $0 3 $116,667 0 $0
Aggregated Statistics For Year 2005(Based on 1 full tract) A) FHA, FSA/RHS & VA B) Conventional C) Refinancings D) Home Improvement Loans E) Loans on Dwellings For 5+ Families F) Non-occupant Loans on G) Loans On Manufactured Number Average Value Number Average Value Number Average Value Number Average Value Number Average Value Number Average Value Number Average Value
LOANS ORIGINATED 10 $142,900 171 $106,801 161 $100,093 51 $27,235 2 $203,000 26 $94,654 8 $32,500 APPLICATIONS APPROVED, NOT ACCEPTED 1 $79,000 18 $114,500 29 $95,897 10 $30,800 0 $0 7 $96,714 1 $40,000 APPLICATIONS DENIED 0 $0 27 $84,889 118 $100,907 33 $29,970 0 $0 9 $67,778 9 $38,111 APPLICATIONS WITHDRAWN 0 $0 8 $97,625 77 $111,429 10 $50,500 0 $0 3 $183,000 3 $59,000 FILES CLOSED FOR INCOMPLETENESS 0 $0 5 $75,200 19 $104,789 0 $0 0 $0 2 $119,000 0 $0
Aggregated Statistics For Year 2004(Based on 1 full tract) A) FHA, FSA/RHS & VA B) Conventional C) Refinancings D) Home Improvement Loans E) Loans on Dwellings For 5+ Families F) Non-occupant Loans on G) Loans On Manufactured Number Average Value Number Average Value Number Average Value Number Average Value Number Average Value Number Average Value Number Average Value
LOANS ORIGINATED 15 $109,000 131 $114,580 144 $89,042 60 $30,250 2 $1,575,500 42 $90,429 5 $56,000 APPLICATIONS APPROVED, NOT ACCEPTED 1 $131,000 10 $101,100 42 $78,524 3 $44,000 0 $0 9 $76,111 1 $55,000 APPLICATIONS DENIED 0 $0 17 $82,765 90 $92,156 16 $15,500 0 $0 5 $122,600 9 $40,111 APPLICATIONS WITHDRAWN 2 $129,000 10 $124,200 47 $103,298 5 $80,000 0 $0 2 $102,000 0 $0 FILES CLOSED FOR INCOMPLETENESS 0 $0 8 $96,125 24 $110,417 3 $28,333 0 $0 1 $144,000 0 $0
Aggregated Statistics For Year 2003(Based on 1 full tract) A) FHA, FSA/RHS & VA B) Conventional C) Refinancings D) Home Improvement Loans E) Loans on Dwellings For 5+ Families F) Non-occupant Loans on Number Average Value Number Average Value Number Average Value Number Average Value Number Average Value Number Average Value
LOANS ORIGINATED 20 $110,000 142 $102,810 293 $85,020 37 $23,757 3 $264,333 26 $81,385 APPLICATIONS APPROVED, NOT ACCEPTED 3 $91,333 20 $81,600 44 $81,886 5 $32,400 0 $0 3 $64,333 APPLICATIONS DENIED 2 $113,500 25 $75,600 107 $103,710 17 $18,353 0 $0 11 $61,455 APPLICATIONS WITHDRAWN 2 $151,500 10 $85,700 71 $90,606 8 $30,375 0 $0 6 $79,667 FILES CLOSED FOR INCOMPLETENESS 0 $0 2 $93,000 14 $81,929 1 $25,000 0 $0 1 $75,000
Aggregated Statistics For Year 2002(Based on 1 full tract) A) FHA, FSA/RHS & VA B) Conventional C) Refinancings D) Home Improvement Loans E) Loans on Dwellings For 5+ Families F) Non-occupant Loans on Number Average Value Number Average Value Number Average Value Number Average Value Number Average Value Number Average Value
LOANS ORIGINATED 26 $105,000 111 $99,018 193 $84,684 29 $27,793 0 $0 25 $91,160 APPLICATIONS APPROVED, NOT ACCEPTED 1 $71,000 10 $93,700 38 $75,605 6 $12,667 0 $0 1 $88,000 APPLICATIONS DENIED 1 $127,000 13 $91,846 74 $82,203 15 $14,533 0 $0 2 $92,000 APPLICATIONS WITHDRAWN 2 $75,500 11 $73,818 69 $90,971 3 $17,667 1 $163,000 3 $55,000 FILES CLOSED FOR INCOMPLETENESS 1 $88,000 1 $111,000 11 $87,091 0 $0 0 $0 0 $0
Aggregated Statistics For Year 2001(Based on 1 full tract) A) FHA, FSA/RHS & VA B) Conventional C) Refinancings D) Home Improvement Loans E) Loans on Dwellings For 5+ Families F) Non-occupant Loans on Number Average Value Number Average Value Number Average Value Number Average Value Number Average Value Number Average Value
LOANS ORIGINATED 20 $98,000 66 $87,348 145 $72,434 47 $16,787 2 $187,000 28 $79,000 APPLICATIONS APPROVED, NOT ACCEPTED 0 $0 5 $39,600 26 $74,923 6 $21,500 0 $0 0 $0 APPLICATIONS DENIED 4 $98,250 9 $77,667 81 $70,852 14 $17,500 1 $110,000 1 $27,000 APPLICATIONS WITHDRAWN 5 $114,400 6 $77,000 56 $80,071 6 $37,167 0 $0 1 $70,000 FILES CLOSED FOR INCOMPLETENESS 0 $0 2 $87,000 16 $98,375 1 $20,000 0 $0 1 $52,000
Aggregated Statistics For Year 2000(Based on 1 full tract) A) FHA, FSA/RHS & VA B) Conventional C) Refinancings D) Home Improvement Loans E) Loans on Dwellings For 5+ Families F) Non-occupant Loans on Number Average Value Number Average Value Number Average Value Number Average Value Number Average Value Number Average Value
LOANS ORIGINATED 24 $95,750 91 $82,011 53 $50,358 37 $18,216 2 $199,000 7 $78,286 APPLICATIONS APPROVED, NOT ACCEPTED 0 $0 16 $66,688 26 $52,154 8 $31,750 0 $0 1 $49,000 APPLICATIONS DENIED 1 $83,000 26 $46,423 64 $61,312 16 $18,812 1 $180,000 4 $110,750 APPLICATIONS WITHDRAWN 2 $112,500 6 $98,667 27 $91,296 2 $41,000 1 $187,000 4 $131,250 FILES CLOSED FOR INCOMPLETENESS 1 $75,000 2 $55,500 11 $85,455 1 $30,000 0 $0 0 $0
Aggregated Statistics For Year 1999(Based on 1 full tract) A) FHA, FSA/RHS & VA B) Conventional C) Refinancings D) Home Improvement Loans F) Non-occupant Loans on Number Average Value Number Average Value Number Average Value Number Average Value Number Average Value
LOANS ORIGINATED 18 $90,889 88 $98,050 103 $62,714 38 $20,187 17 $59,526 APPLICATIONS APPROVED, NOT ACCEPTED 0 $0 12 $52,806 21 $72,876 6 $9,922 1 $129,610 APPLICATIONS DENIED 0 $0 15 $68,231 41 $57,161 10 $23,330 4 $68,648 APPLICATIONS WITHDRAWN 3 $104,330 5 $90,442 30 $56,006 7 $36,210 3 $66,567 FILES CLOSED FOR INCOMPLETENESS 0 $0 3 $94,730 12 $99,930 1 $89,290 0 $0
Detailed HMDA statistics for the following Tracts:
0039.00
Private Mortgage Insurance Companies Aggregated Statistics For Year 2009(Based on 1 full tract) A) Conventional B) Refinancings Number Average Value Number Average Value
LOANS ORIGINATED 9 $135,778 3 $150,667 APPLICATIONS APPROVED, NOT ACCEPTED 2 $119,500 1 $150,000 APPLICATIONS DENIED 1 $159,000 1 $213,000 APPLICATIONS WITHDRAWN 0 $0 2 $117,500 FILES CLOSED FOR INCOMPLETENESS 0 $0 0 $0
Aggregated Statistics For Year 2008(Based on 1 full tract) A) Conventional B) Refinancings C) Non-occupant Loans on Number Average Value Number Average Value Number Average Value
LOANS ORIGINATED 28 $177,714 5 $239,000 0 $0 APPLICATIONS APPROVED, NOT ACCEPTED 6 $186,333 2 $114,500 0 $0 APPLICATIONS DENIED 1 $90,000 0 $0 1 $90,000 APPLICATIONS WITHDRAWN 0 $0 0 $0 0 $0 FILES CLOSED FOR INCOMPLETENESS 1 $181,000 0 $0 0 $0
Aggregated Statistics For Year 2007(Based on 1 full tract) A) Conventional B) Refinancings C) Non-occupant Loans on Number Average Value Number Average Value Number Average Value
LOANS ORIGINATED 41 $140,902 13 $167,154 1 $90,000 APPLICATIONS APPROVED, NOT ACCEPTED 5 $247,800 1 $180,000 2 $227,500 APPLICATIONS DENIED 1 $200,000 0 $0 0 $0 APPLICATIONS WITHDRAWN 1 $200,000 4 $145,750 0 $0 FILES CLOSED FOR INCOMPLETENESS 0 $0 0 $0 0 $0
Aggregated Statistics For Year 2006(Based on 1 full tract) A) Conventional B) Refinancings C) Non-occupant Loans on D) Loans On Manufactured Number Average Value Number Average Value Number Average Value Number Average Value
LOANS ORIGINATED 44 $153,159 4 $122,750 7 $128,714 1 $153,000 APPLICATIONS APPROVED, NOT ACCEPTED 7 $117,714 1 $167,000 1 $149,000 0 $0 APPLICATIONS DENIED 3 $203,000 0 $0 3 $203,000 0 $0 APPLICATIONS WITHDRAWN 3 $89,333 0 $0 0 $0 0 $0 FILES CLOSED FOR INCOMPLETENESS 1 $153,000 0 $0 0 $0 1 $153,000
Aggregated Statistics For Year 2005(Based on 1 full tract) A) Conventional B) Refinancings Number Average Value Number Average Value
LOANS ORIGINATED 22 $136,227 11 $119,364 APPLICATIONS APPROVED, NOT ACCEPTED 6 $123,000 1 $90,000 APPLICATIONS DENIED 0 $0 0 $0 APPLICATIONS WITHDRAWN 5 $269,000 0 $0 FILES CLOSED FOR INCOMPLETENESS 0 $0 0 $0
Aggregated Statistics For Year 2004(Based on 1 full tract) A) Conventional B) Refinancings C) Non-occupant Loans on Number Average Value Number Average Value Number Average Value
LOANS ORIGINATED 35 $123,629 11 $115,364 6 $92,667 APPLICATIONS APPROVED, NOT ACCEPTED 6 $164,667 2 $98,000 0 $0 APPLICATIONS DENIED 0 $0 0 $0 0 $0 APPLICATIONS WITHDRAWN 1 $73,000 1 $71,000 1 $71,000 FILES CLOSED FOR INCOMPLETENESS 0 $0 0 $0 0 $0
Aggregated Statistics For Year 2003(Based on 1 full tract) A) Conventional B) Refinancings C) Non-occupant Loans on Number Average Value Number Average Value Number Average Value
LOANS ORIGINATED 34 $121,853 33 $107,970 1 $86,000 APPLICATIONS APPROVED, NOT ACCEPTED 2 $139,500 8 $89,625 0 $0 APPLICATIONS DENIED 1 $47,000 0 $0 1 $47,000 APPLICATIONS WITHDRAWN 0 $0 0 $0 0 $0 FILES CLOSED FOR INCOMPLETENESS 0 $0 0 $0 0 $0
Aggregated Statistics For Year 2002(Based on 1 full tract) A) Conventional B) Refinancings C) Non-occupant Loans on Number Average Value Number Average Value Number Average Value
LOANS ORIGINATED 39 $109,564 20 $124,350 4 $103,250 APPLICATIONS APPROVED, NOT ACCEPTED 1 $95,000 5 $92,000 0 $0 APPLICATIONS DENIED 1 $108,000 0 $0 0 $0 APPLICATIONS WITHDRAWN 2 $140,000 0 $0 0 $0 FILES CLOSED FOR INCOMPLETENESS 1 $64,000 1 $117,000 0 $0
Aggregated Statistics For Year 2001(Based on 1 full tract) A) Conventional B) Refinancings C) Non-occupant Loans on Number Average Value Number Average Value Number Average Value
LOANS ORIGINATED 16 $105,188 15 $99,200 2 $53,000 APPLICATIONS APPROVED, NOT ACCEPTED 1 $50,000 2 $93,500 0 $0 APPLICATIONS DENIED 0 $0 1 $117,000 0 $0 APPLICATIONS WITHDRAWN 1 $63,000 0 $0 0 $0 FILES CLOSED FOR INCOMPLETENESS 0 $0 0 $0 0 $0
Aggregated Statistics For Year 2000(Based on 1 full tract) A) Conventional B) Refinancings C) Non-occupant Loans on Number Average Value Number Average Value Number Average Value
LOANS ORIGINATED 21 $100,571 6 $97,667 1 $50,000 APPLICATIONS APPROVED, NOT ACCEPTED 2 $165,500 0 $0 0 $0 APPLICATIONS DENIED 0 $0 0 $0 0 $0 APPLICATIONS WITHDRAWN 0 $0 0 $0 0 $0 FILES CLOSED FOR INCOMPLETENESS 0 $0 0 $0 0 $0
Aggregated Statistics For Year 1999(Based on 1 full tract) A) Conventional B) Refinancings C) Non-occupant Loans on Number Average Value Number Average Value Number Average Value
LOANS ORIGINATED 45 $103,371 9 $90,142 3 $85,770 APPLICATIONS APPROVED, NOT ACCEPTED 3 $78,087 1 $133,450 0 $0 APPLICATIONS DENIED 1 $136,330 0 $0 0 $0 APPLICATIONS WITHDRAWN 0 $0 0 $0 0 $0 FILES CLOSED FOR INCOMPLETENESS 0 $0 1 $129,610 1 $129,610
Detailed PMIC statistics for the following Tracts:
0039.00
Most common first names in Palmyra, PA among deceased individuals Name Count Lived (average)
John 158 76.0 years Mary 145 81.5 years Charles 92 76.7 years Robert 88 75.6 years William 78 77.2 years Ruth 68 79.2 years Harry 66 78.4 years Anna 63 81.8 years Paul 61 77.3 years George 61 76.9 years
Most common last names in Palmyra, PA among deceased individuals Last name Count Lived (average)
Miller 74 78.2 years Smith 66 76.8 years Gingrich 42 77.6 years Kreider 34 82.0 years Wagner 34 77.1 years Hetrick 25 79.2 years Light 25 80.2 years Lehman 23 77.2 years Bowman 22 81.0 years Long 21 75.1 years
Palmyra compared to Pennsylvania state average:
Unemployed percentage significantly below state average. Black race population percentage significantly below state average. Hispanic race population percentage above state average. Length of stay since moving in significantly below state average.
#42 on the list of "Top 101 cities with largest percentage of males in occupations: office and administrative support occupations (population 5,000+)"
#76 on the list of "Top 101 cities with the most residents born in Europe, n.e.c. (population 500+)"
#10 on the list of "Top 101 counties with the highest Particulate Matter (PM2.5 ) Annual air pollution readings in 2012 (µg/m3 )"
#29 on the list of "Top 101 counties with the largest increase in the number of births per 1000 residents 2000-2006 to 2007-2013 (pop 50,000+)"
#29 on the list of "Top 101 counties with the lowest total withdrawal of fresh water for public supply (pop. 50,000+)"
#51 on the list of "Top 101 counties with the lowest surface withdrawal of fresh water for public supply (pop. 50,000+)"
#61 on the list of "Top 101 counties with the lowest percentage of residents relocating to other counties in 2011 (pop. 50,000+)"
Top Patent Applicants
Attalee S. Taylor (10)
Sean Patrick Mccarthy (9)
Attalee Snarr Taylor (7)
Eric S. Mosser (5)
James Patrick Mosier (4)
Hong-Gang Wang (3)
Floyd A. Benko (3)
Todd Michael Hutchinson (2)
Joseph R. Woelfling (2)
Thomas M. Dunn (2)
Total of 93 patent applications in 2008-2024.
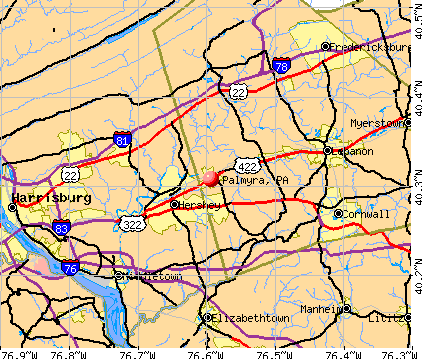


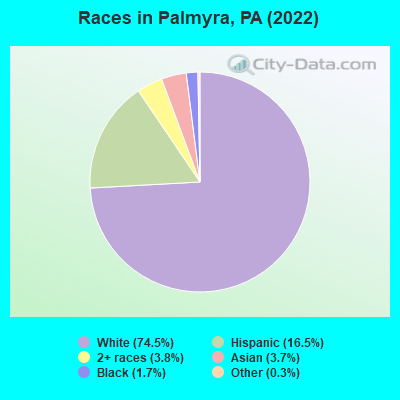
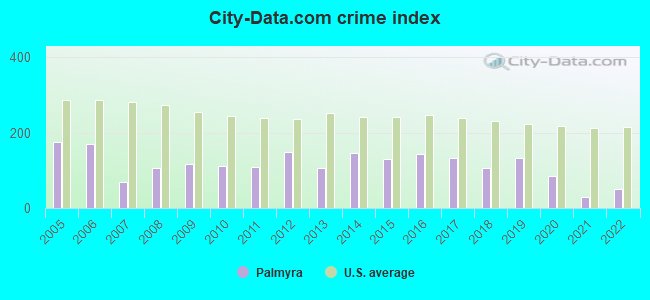
 Recent articles from our blog. Our writers, many of them Ph.D. graduates or candidates, create easy-to-read articles on a wide variety of topics.

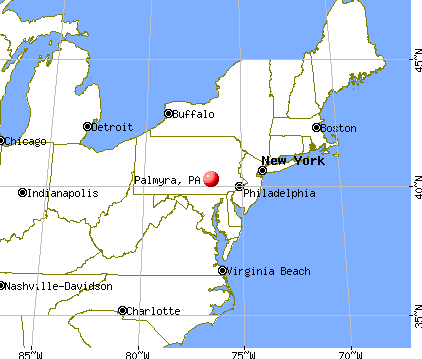
 (24.0 miles
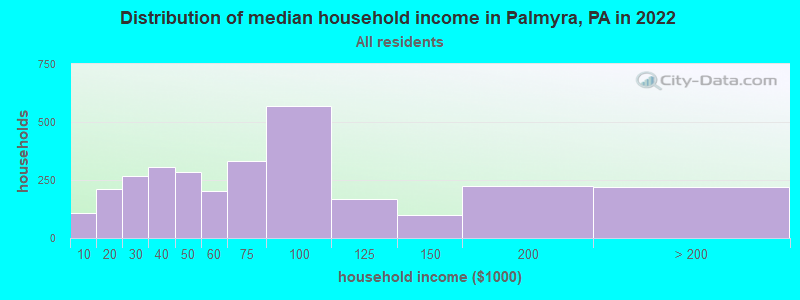
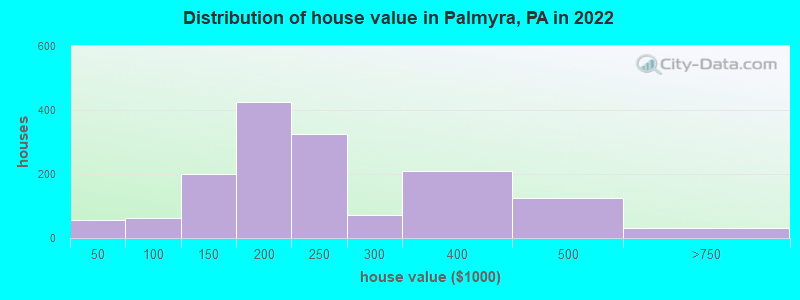
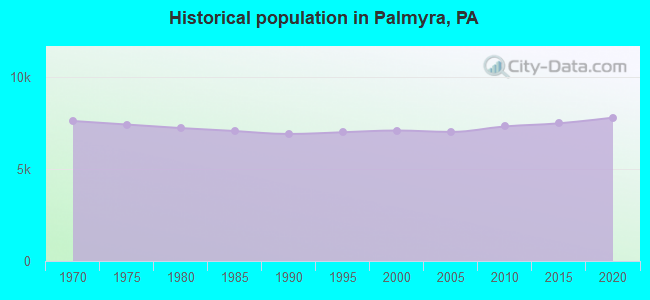
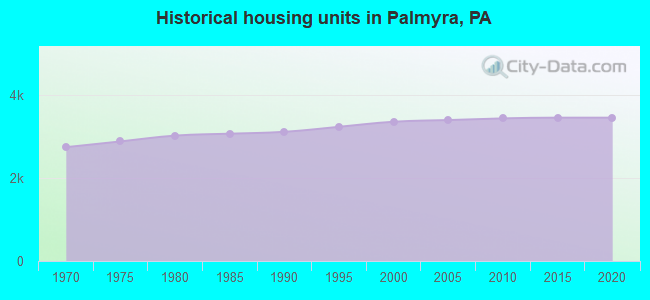
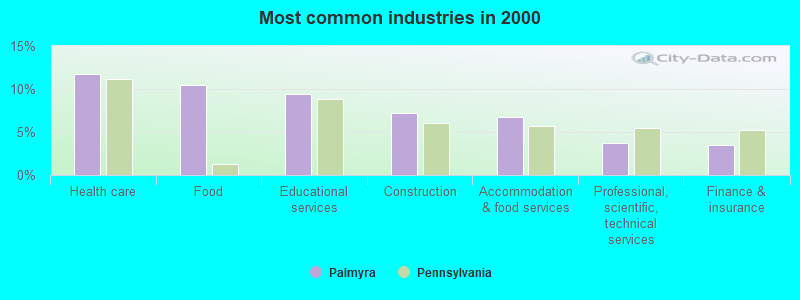
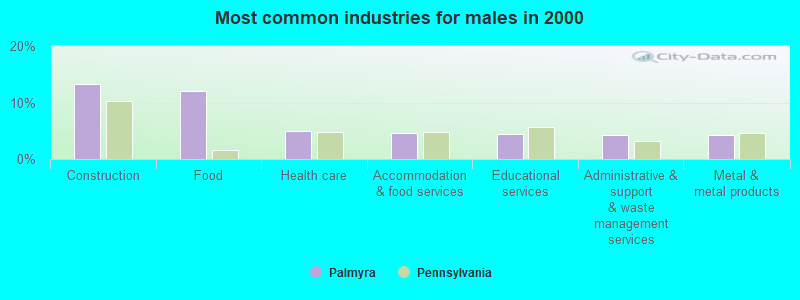
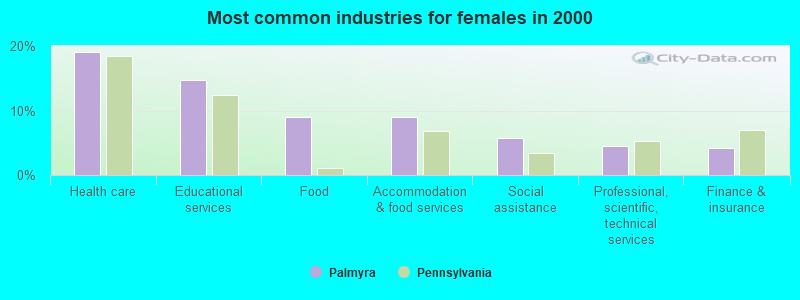
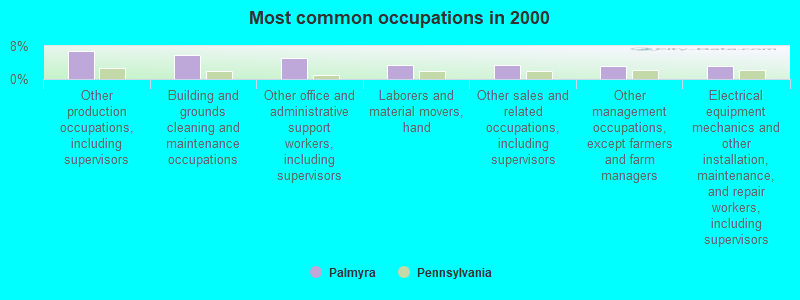
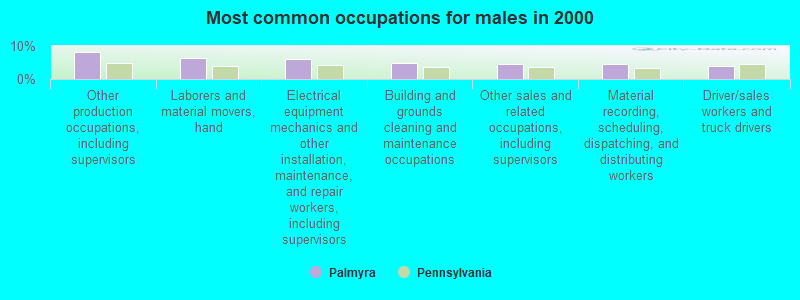
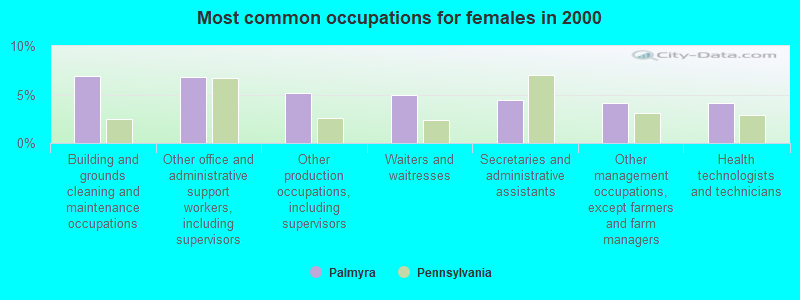


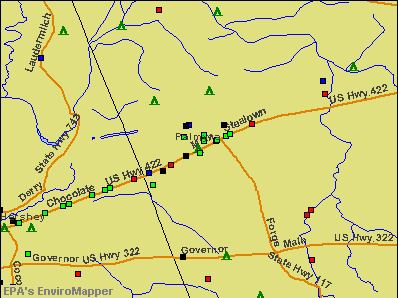

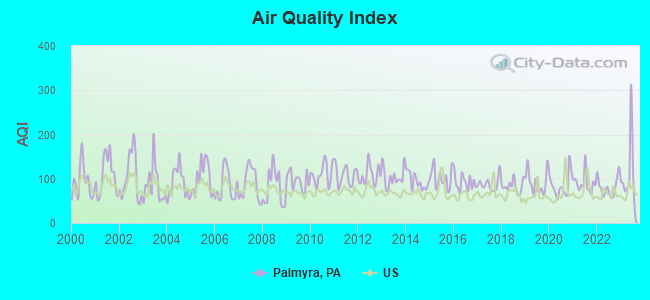
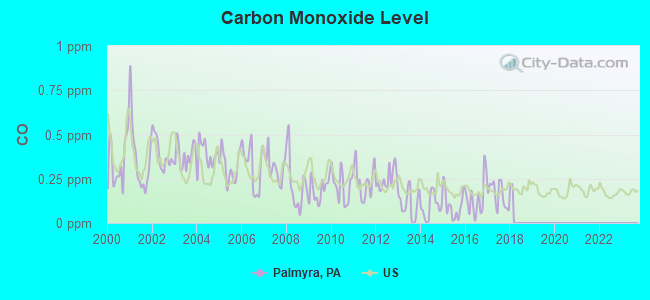
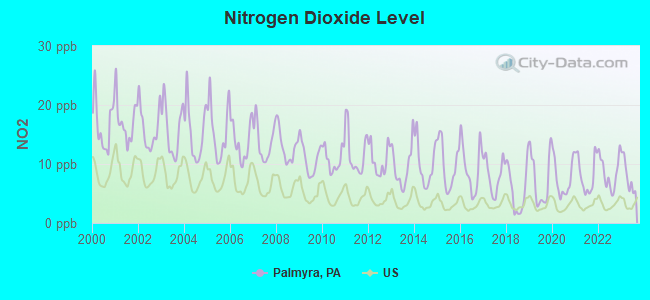
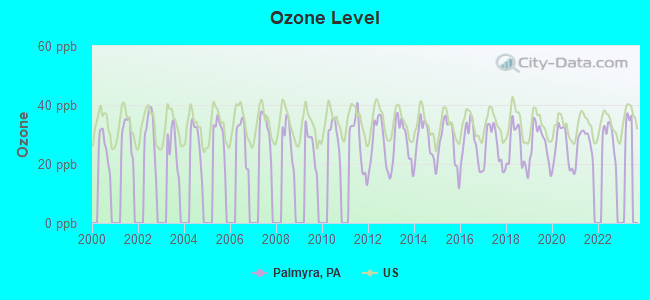
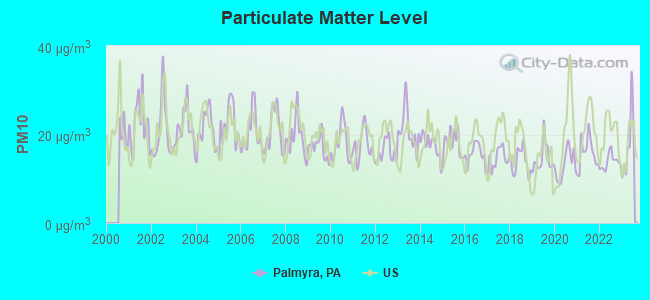
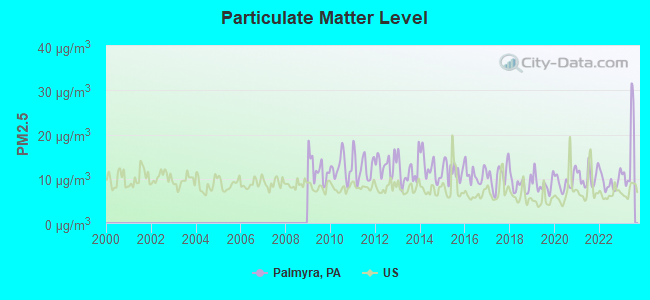
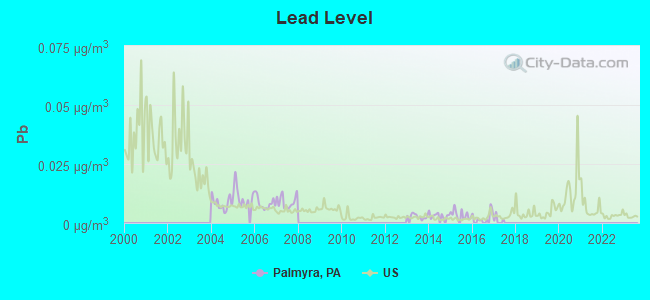
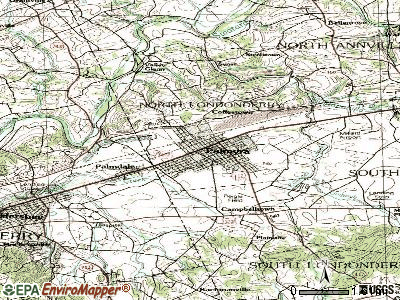
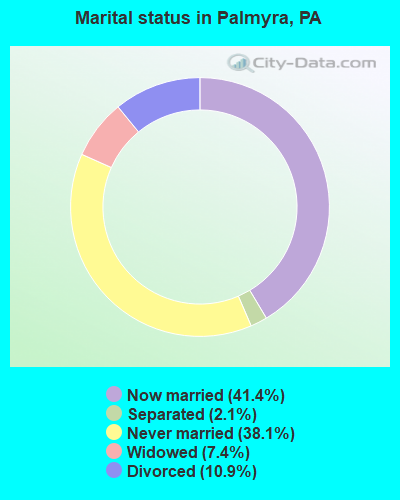
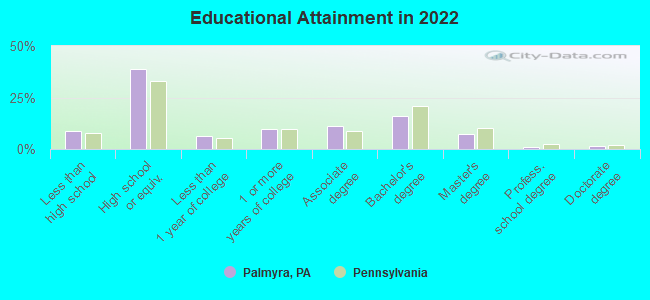
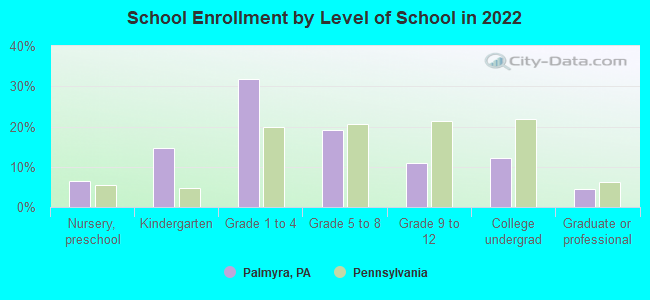
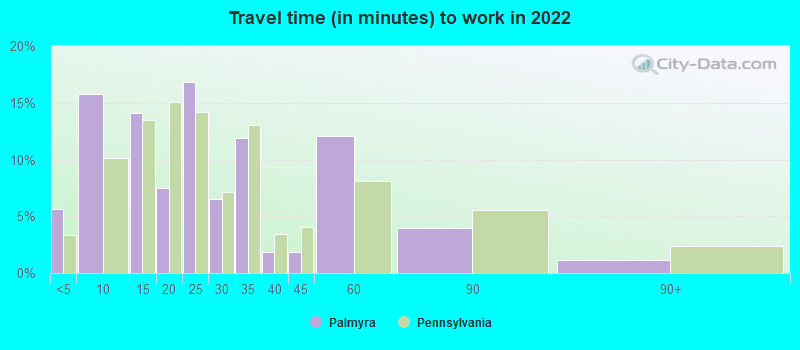
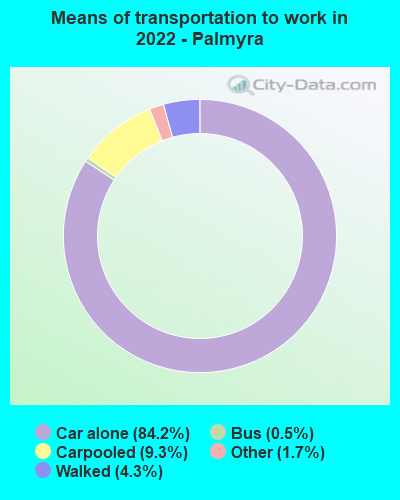
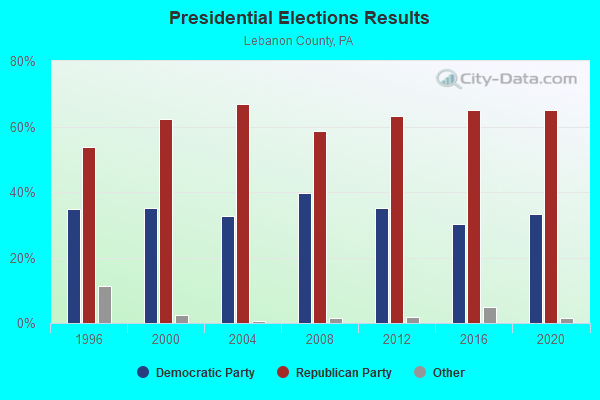
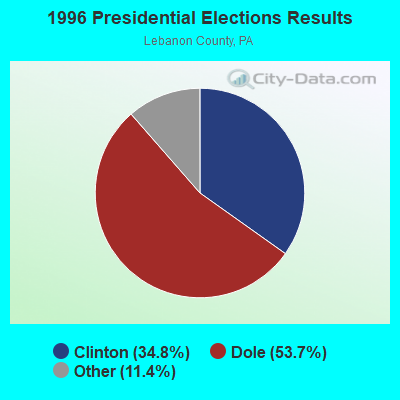

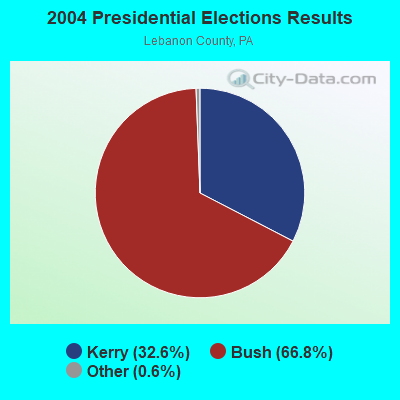
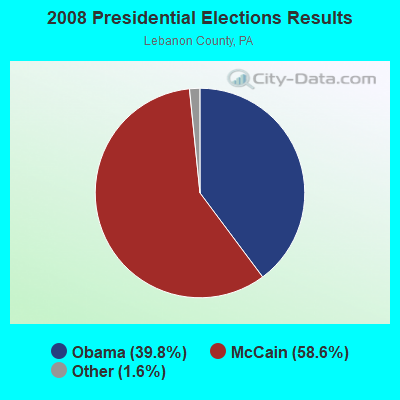

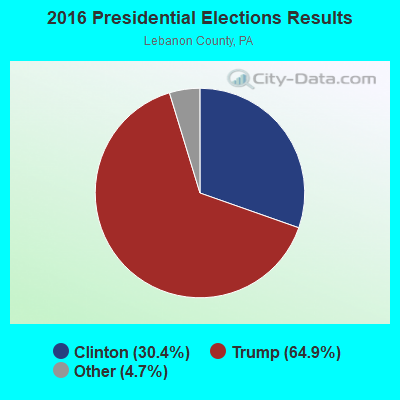
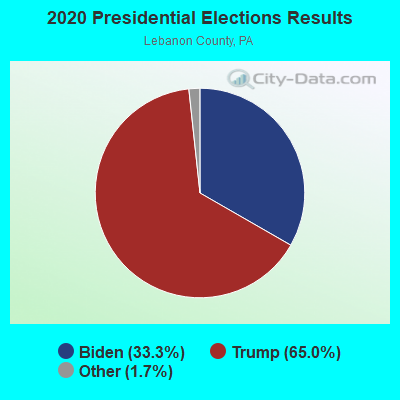
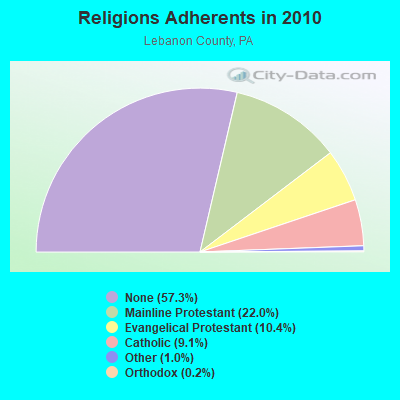
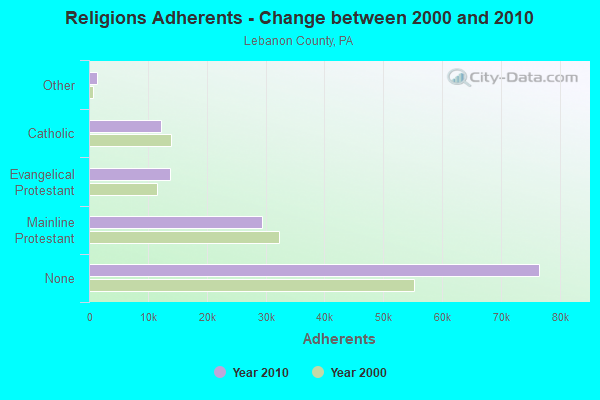
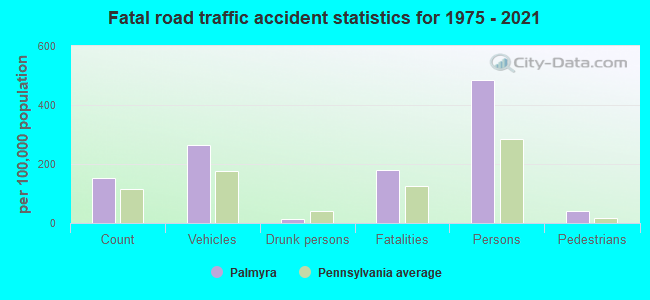
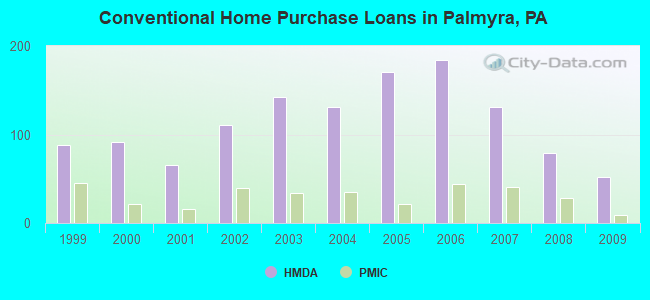
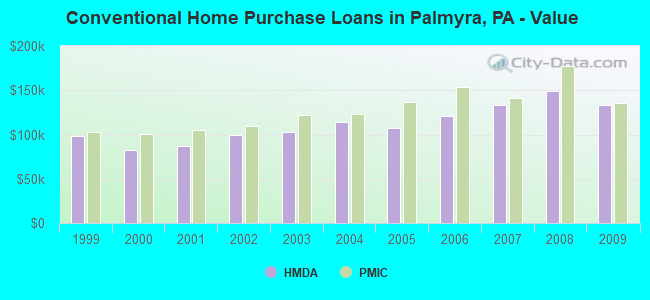
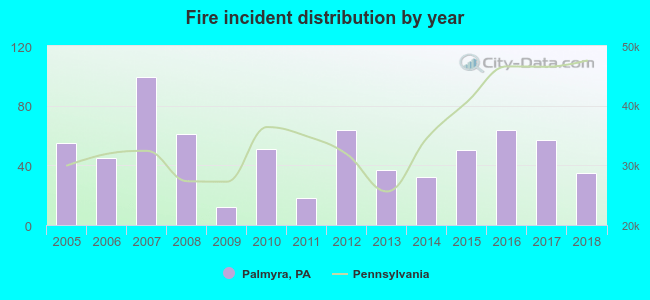 According to the data from the years 2005 - 2018 the average number of fires per year is 49. The highest number of reported fires - 99 took place in 2007, and the least - 12 in 2009. The data has a declining trend.
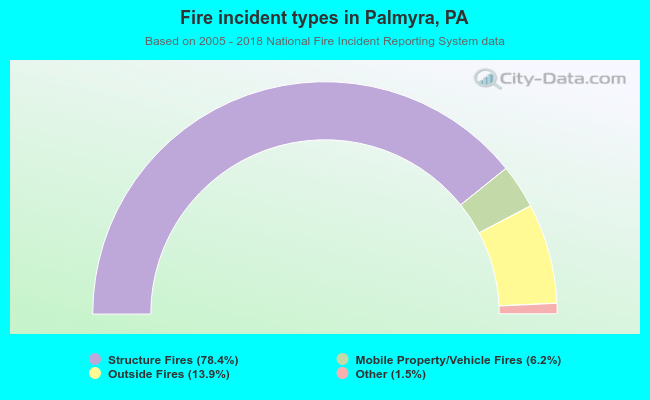 When looking into fire subcategories, the most reports belonged to: Structure Fires (78.4%), and Outside Fires (13.9%).