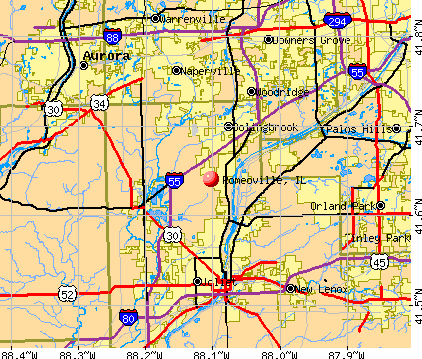
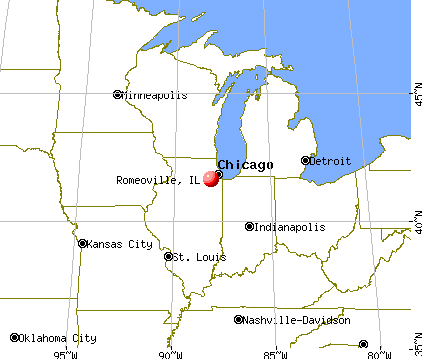
Romeoville, Illinois
Submit your own pictures of this village and show them to the world
- OSM Map
- General Map
- Google Map
- MSN Map
Population change since 2000: +89.7%
| Males: 20,195 | |
| Females: 19,922 |
| Median resident age: | 35.6 years |
| Illinois median age: | 39.1 years |
Zip codes: 60446.
| Romeoville: | $89,890 |
| IL: | $76,708 |
Estimated per capita income in 2022: $32,144 (it was $21,221 in 2000)
Romeoville village income, earnings, and wages data
Estimated median house or condo value in 2022: $248,168 (it was $117,900 in 2000)
| Romeoville: | $248,168 |
| IL: | $251,600 |
Mean prices in 2022: all housing units: $320,602; detached houses: $341,136; townhouses or other attached units: $239,631; in 2-unit structures: $239,357; in 3-to-4-unit structures: $200,351; in 5-or-more-unit structures: $168,162; mobile homes: $77,508; occupied boats, rvs, vans, etc.: over $1,000,000
Median gross rent in 2022: $1,773.
(5.6% for White Non-Hispanic residents, 1.9% for Black residents, 7.5% for Hispanic or Latino residents, 7.1% for American Indian residents, 4.9% for other race residents, 9.5% for two or more races residents)
Detailed information about poverty and poor residents in Romeoville, IL


Compare current foreclosures in Romeoville, IL:
| Photo | Address | Area | Beds / Baths | Price | Details |
|---|---|---|---|---|---|

|
#1
Fairfax Ave
Romeoville, IL 60446
|
- sq. feet
|
1 baths 3 beds |
$229,900
|
show details |

|
#2
Ponderosa Dr
Romeoville, IL 60446
|
1,786 sq. feet
|
2 baths 3 beds |
show details | |

|
#3
John Kirkham Dr
Romeoville, IL 60446
|
1,360 sq. feet
|
1 baths 3 beds |
show details | |

|
#4
Glen Ave
Romeoville, IL 60446
|
1,008 sq. feet
|
1 baths 3 beds |
show details | |

|
#5
Azalea Cir
Romeoville, IL 60446
|
1,104 sq. feet
|
1 baths 2 beds |
show details | |

|
#6
Belmont Dr
Romeoville, IL 60446
|
- sq. feet
|
2 baths - beds |
show details | |

|
#7
S Stone Brook Dr
Romeoville, IL 60446
|
- sq. feet
|
- baths - beds |
show details | |

|
#8
W Stillwater Ct
Romeoville, IL 60446
|
- sq. feet
|
- baths - beds |
show details | |

|
#9
Williamsburg Ct
Romeoville, IL 60446
|
- sq. feet
|
- baths - beds |
show details | |

|
#10
W Ludington Cir
Romeoville, IL 60446
|
- sq. feet
|
- baths - beds |
show details |
| Photo | Address | Area | Beds / Baths | Price | Details |
|---|---|---|---|---|---|

|
#11
N Sleepy Hollow Ln
Romeoville, IL 60446
|
- sq. feet
|
- baths - beds |
show details | |

|
#12
Highpoint Dr Apt 104
Romeoville, IL 60446
|
- sq. feet
|
- baths - beds |
show details | |

|
#13
Raleigh Trl
Romeoville, IL 60446
|
- sq. feet
|
- baths - beds |
show details | |

|
#14
Santa Fe Rd Apt 204
Romeoville, IL 60446
|
- sq. feet
|
- baths - beds |
show details | |

|
#15
S Weber Rd # Unit815
Romeoville, IL 60446
|
- sq. feet
|
- baths - beds |
show details | |

|
#16
S Stone Brook Dr
Romeoville, IL 60446
|
- sq. feet
|
- baths - beds |
show details | |

|
#17
Highpoint Dr Apt 104
Romeoville, IL 60446
|
- sq. feet
|
- baths - beds |
show details | |

|
#18
S Oak Creek Ln
Romeoville, IL 60446
|
- sq. feet
|
- baths - beds |
show details | |

|
#19
Easton Ln Apt 207
Romeoville, IL 60446
|
- sq. feet
|
- baths - beds |
show details | |

|
#20
Highpoint Dr Apt 101
Romeoville, IL 60446
|
- sq. feet
|
- baths - beds |
show details |
| Photo | Address | Area | Beds / Baths | Price | Details |
|---|---|---|---|---|---|
|
|
#21
Highpoint Dr # 204
Romeoville, IL 60446
|
- sq. feet
|
- baths - beds |
show details | |

|
#22
S Dollinger Dr
Romeoville, IL 60446
|
- sq. feet
|
- baths - beds |
show details | |

|
#23
Highpoint Dr Apt 106
Romeoville, IL 60446
|
- sq. feet
|
- baths - beds |
show details | |

|
#24
Lily Ln Apt E
Romeoville, IL 60446
|
- sq. feet
|
- baths - beds |
show details | |

|
#25
Santa Fe Rd Apt 103
Romeoville, IL 60446
|
- sq. feet
|
- baths - beds |
show details | |

|
#26
Montrose Dr
Romeoville, IL 60446
|
- sq. feet
|
- baths - beds |
show details | |

|
#27
Highpoint Dr Apt 108
Romeoville, IL 60446
|
- sq. feet
|
- baths - beds |
show details | |

|
#28
Highpoint Dr Apt 101
Romeoville, IL 60446
|
- sq. feet
|
- baths - beds |
show details | |

|
#29
Mews Ln, Unit 201
Romeoville, IL 60446
|
- sq. feet
|
- baths - beds |
show details | |

|
#30
N Weber Rd # 107
Romeoville, IL 60446
|
- sq. feet
|
- baths - beds |
show details |
| Photo | Address | Area | Beds / Baths | Price | Details |
|---|---|---|---|---|---|

|
#31
Highpoint Dr Apt 207
Romeoville, IL 60446
|
- sq. feet
|
- baths - beds |
show details | |

|
#32
W Alder Creek Dr
Romeoville, IL 60446
|
- sq. feet
|
- baths - beds |
show details | |

|
#33
N Weber Rd # 103
Romeoville, IL 60446
|
- sq. feet
|
- baths - beds |
show details | |

|
#34
S Dollinger Dr
Romeoville, IL 60446
|
- sq. feet
|
- baths - beds |
show details | |

|
#35
Highpoint Dr Apt 201
Romeoville, IL 60446
|
- sq. feet
|
- baths - beds |
show details | |

|
#36
N Grand Blvd
Romeoville, IL 60446
|
- sq. feet
|
- baths - beds |
show details | |

|
#37
Heritage Pkwy
Romeoville, IL 60446
|
- sq. feet
|
- baths - beds |
show details | |

|
#38
Honeytree Dr
Romeoville, IL 60446
|
- sq. feet
|
- baths - beds |
show details | |

|
#39
Kathleen Dr
Romeoville, IL 60446
|
- sq. feet
|
- baths - beds |
show details | |

|
#40
S Alder Creek Dr
Romeoville, IL 60446
|
- sq. feet
|
- baths - beds |
show details |
| Photo | Address | Area | Beds / Baths | Price | Details |
|---|---|---|---|---|---|

|
#41
Edward Dr
Romeoville, IL 60446
|
- sq. feet
|
- baths - beds |
show details | |

|
#42
Wedgewood Cir
Romeoville, IL 60446
|
- sq. feet
|
- baths - beds |
show details | |

|
#43
Hamrick Ave
Romeoville, IL 60446
|
- sq. feet
|
- baths - beds |
show details | |

|
#44
N Sleepy Hollow Ln
Romeoville, IL 60446
|
- sq. feet
|
- baths - beds |
show details | |

|
#45
Belmont Dr
Romeoville, IL 60446
|
- sq. feet
|
- baths - beds |
show details | |

|
#46
S Canyon Dr
Romeoville, IL 60446
|
- sq. feet
|
- baths - beds |
show details | |

|
#47
S Wentworth Cir
Romeoville, IL 60446
|
- sq. feet
|
- baths - beds |
show details | |

|
#48
John Kirkham Dr
Romeoville, IL 60446
|
- sq. feet
|
- baths - beds |
show details | |

|
#49
Berkley Dr
Romeoville, IL 60446
|
- sq. feet
|
- baths - beds |
show details | |

|
Check over 1 million property listings on Foreclosure.com!
|
browse all offers | |||


- 16,80641.9%White alone
- 14,76736.8%Hispanic
- 4,48111.2%Black alone
- 2,9567.4%Asian alone
- 1,6364.1%Two or more races
- 610.2%Other race alone
- 90.02%American Indian alone
- 60.01%Native Hawaiian and Other
Pacific Islander alone
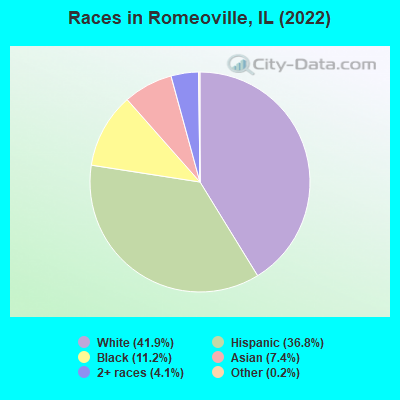
Races in Romeoville detailed stats: ancestries, foreign born residents, place of birth
According to our research of Illinois and other state lists, there were 19 registered sex offenders living in Romeoville, Illinois as of May 19, 2024.
The ratio of all residents to sex offenders in Romeoville is 2,104 to 1.
The ratio of registered sex offenders to all residents in this city is much lower than the state average.
Type |
2009 |
2010 |
2011 |
2012 |
2013 |
2014 |
2015 |
2016 |
2017 |
2018 |
2019 |
2020 |
2021 |
2022 |
|---|---|---|---|---|---|---|---|---|---|---|---|---|---|---|
| Murders (per 100,000) | 1 (2.5) | 1 (2.5) | 0 (0.0) | 0 (0.0) | 1 (2.5) | 2 (5.0) | 0 (0.0) | 0 (0.0) | 0 (0.0) | 1 (2.5) | 1 (2.5) | 1 (2.5) | 2 (5.0) | 0 (0.0) |
| Rapes (per 100,000) | 0 (0.0) | 5 (12.6) | 2 (5.0) | 2 (5.0) | 3 (7.5) | 10 (25.2) | 8 (20.2) | 8 (20.1) | 13 (32.7) | 10 (25.2) | 12 (30.3) | 20 (50.3) | 14 (35.2) | 12 (29.2) |
| Robberies (per 100,000) | 11 (27.2) | 10 (25.2) | 7 (17.6) | 11 (27.5) | 10 (25.1) | 13 (32.8) | 7 (17.6) | 14 (35.2) | 15 (37.8) | 15 (37.9) | 18 (45.4) | 11 (27.7) | 3 (7.5) | 8 (19.5) |
| Assaults (per 100,000) | 58 (143.3) | 16 (40.3) | 13 (32.7) | 17 (42.6) | 16 (40.2) | 22 (55.5) | 33 (83.2) | 23 (57.9) | 30 (75.5) | 32 (80.8) | 41 (103.5) | 41 (103.1) | 6 (15.1) | 41 (99.8) |
| Burglaries (per 100,000) | 148 (365.7) | 112 (282.3) | 119 (299.0) | 94 (235.4) | 117 (294.1) | 65 (164.0) | 56 (141.1) | 61 (153.5) | 53 (133.5) | 42 (106.0) | 38 (95.9) | 41 (103.1) | 8 (20.1) | 26 (63.3) |
| Thefts (per 100,000) | 753 (1,861) | 648 (1,633) | 624 (1,568) | 721 (1,806) | 610 (1,534) | 550 (1,387) | 419 (1,056) | 544 (1,369) | 477 (1,201) | 361 (911.0) | 335 (845.6) | 279 (701.9) | 97 (243.9) | 275 (669.6) |
| Auto thefts (per 100,000) | 21 (51.9) | 16 (40.3) | 21 (52.8) | 15 (37.6) | 27 (67.9) | 17 (42.9) | 18 (45.4) | 18 (45.3) | 25 (63.0) | 28 (70.7) | 29 (73.2) | 28 (70.4) | 19 (47.8) | 48 (116.9) |
| Arson (per 100,000) | 2 (4.9) | 5 (12.6) | 0 (0.0) | 0 (0.0) | 2 (5.0) | 0 (0.0) | 3 (7.6) | 2 (5.0) | 2 (5.0) | 2 (5.0) | 2 (5.0) | 1 (2.5) | 3 (7.5) | 0 (0.0) |
| City-Data.com crime index | 146.0 | 119.1 | 103.7 | 112.5 | 114.0 | 121.6 | 93.8 | 107.4 | 115.1 | 102.3 | 110.0 | 115.1 | 58.5 | 89.8 |
The City-Data.com crime index weighs serious crimes and violent crimes more heavily. Higher means more crime, U.S. average is 246.1. It adjusts for the number of visitors and daily workers commuting into cities.
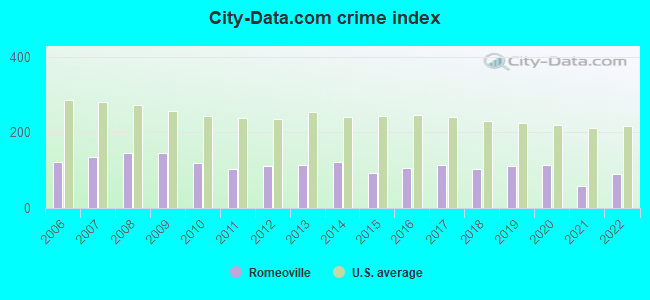
Crime rate in Romeoville detailed stats: murders, rapes, robberies, assaults, burglaries, thefts, arson
Full-time law enforcement employees in 2019, including police officers: 75 (62 officers - 55 male; 7 female).
| Officers per 1,000 residents here: | 1.57 |
| Illinois average: | 3.06 |
 Recent articles from our blog. Our writers, many of them Ph.D. graduates or candidates, create easy-to-read articles on a wide variety of topics.

 | Lisle vs Romeoville new house purchase (6 replies) |
| Romeoville or Bolingbrook? (17 replies) |
| Adjacent suburbs that are vastly different from each other. (53 replies) |
| South Suburban Retail News (37 replies) |
| Girls Youth Hockey near Riverside - Darien or Oak Park? (6 replies) |
| Good Suburb between Romeoville and Chicago? (6 replies) |
Latest news from Romeoville, IL collected exclusively by city-data.com from local newspapers, TV, and radio stations
Ancestries: Polish (7.9%), Italian (3.9%), German (3.7%), Irish (3.4%), American (3.4%), African (1.6%).
Current Local Time: CST time zone
Incorporated on 10/02/1901
Elevation: 614 feet
Land area: 14.5 square miles.
Population density: 2,764 people per square mile (average).
8,508 residents are foreign born (10.5% Latin America, 4.7% Asia, 3.3% Europe, 2.5% Africa).
| This village: | 21.2% |
| Illinois: | 14.1% |
Median real estate property taxes paid for housing units with mortgages in 2022: $5,815 (2.3%)
Median real estate property taxes paid for housing units with no mortgage in 2022: $5,199 (2.1%)
Nearest city with pop. 50,000+: Bolingbrook, IL  (4.1 miles , pop. 56,321).
Nearest city with pop. 200,000+: Chicago, IL (25.9 miles , pop. 2,896,016).
Nearest cities:
), ), Latitude: 41.64 N, Longitude: 88.10 W
Daytime population change due to commuting: +2,098 (+5.2%)
Workers who live and work in this village: 5,388 (25.7%)
Area code commonly used in this area: 815
Property values in Romeoville, IL

Romeoville, Illinois accommodation & food services, waste management - Economy and Business Data
Single-family new house construction building permits:
- 2021: 9 buildings, average cost: $299,900
- 2020: 42 buildings, average cost: $276,400
- 2019: 25 buildings, average cost: $297,100
- 2018: 45 buildings, average cost: $262,200
- 2017: 31 buildings, average cost: $303,300
- 2016: 19 buildings, average cost: $224,300
- 2015: 19 buildings, average cost: $154,300
- 2014: 16 buildings, average cost: $195,200
- 2013: 24 buildings, average cost: $212,700
- 2012: 17 buildings, average cost: $213,200
- 2011: 6 buildings, average cost: $203,300
- 2010: 9 buildings, average cost: $208,500
- 2009: 2 buildings, average cost: $212,700
- 2008: 16 buildings, average cost: $208,200
- 2007: 57 buildings, average cost: $222,700
- 2006: 107 buildings, average cost: $177,100
- 2005: 168 buildings, average cost: $128,600
- 2004: 524 buildings, average cost: $92,600
- 2003: 689 buildings, average cost: $84,500
- 2002: 1183 buildings, average cost: $87,400
- 2001: 1148 buildings, average cost: $93,100
- 2000: 1175 buildings, average cost: $80,700
- 1999: 967 buildings, average cost: $86,600
- 1998: 527 buildings, average cost: $91,500
- 1997: 377 buildings, average cost: $87,100
| Here: | 4.3% |
| Illinois: | 4.2% |
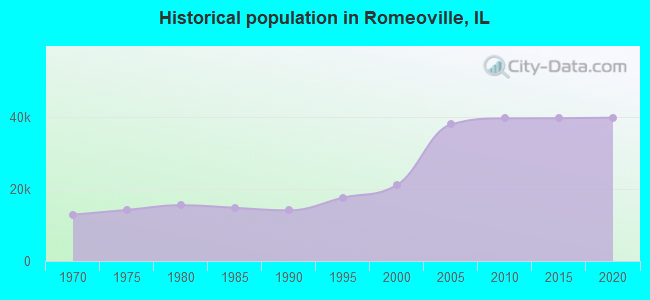
Population change in the 1990s: +6,624 (+45.6%).
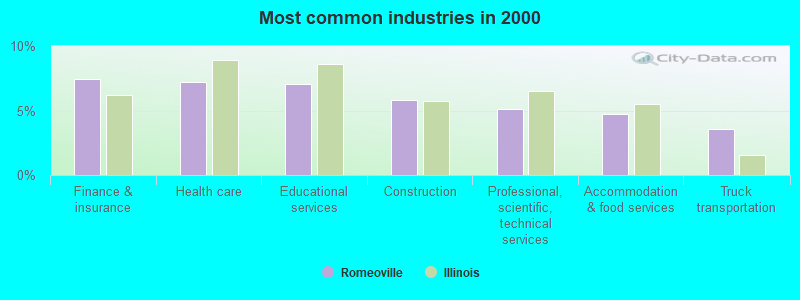
- Finance & insurance (7.4%)
- Health care (7.2%)
- Educational services (7.1%)
- Construction (5.8%)
- Professional, scientific, technical services (5.2%)
- Accommodation & food services (4.7%)
- Truck transportation (3.6%)
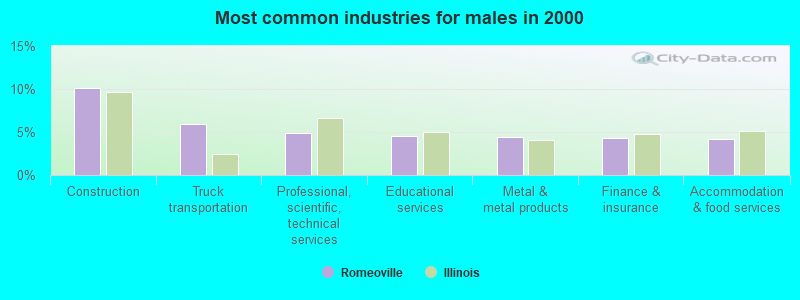
- Construction (10.2%)
- Truck transportation (5.9%)
- Professional, scientific, technical services (4.9%)
- Educational services (4.5%)
- Metal & metal products (4.4%)
- Finance & insurance (4.4%)
- Accommodation & food services (4.2%)
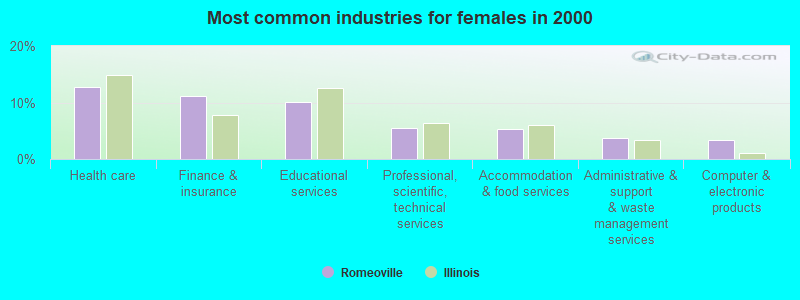
- Health care (12.7%)
- Finance & insurance (11.2%)
- Educational services (10.2%)
- Professional, scientific, technical services (5.4%)
- Accommodation & food services (5.3%)
- Administrative & support & waste management services (3.7%)
- Computer & electronic products (3.3%)
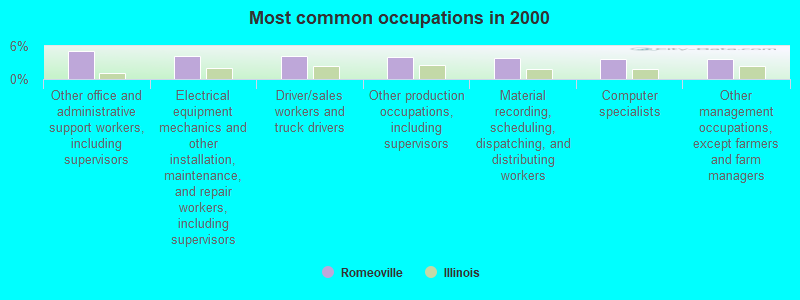
- Other office and administrative support workers, including supervisors (5.2%)
- Electrical equipment mechanics and other installation, maintenance, and repair workers, including supervisors (4.2%)
- Driver/sales workers and truck drivers (4.1%)
- Other production occupations, including supervisors (4.0%)
- Material recording, scheduling, dispatching, and distributing workers (3.8%)
- Computer specialists (3.6%)
- Other management occupations, except farmers and farm managers (3.6%)
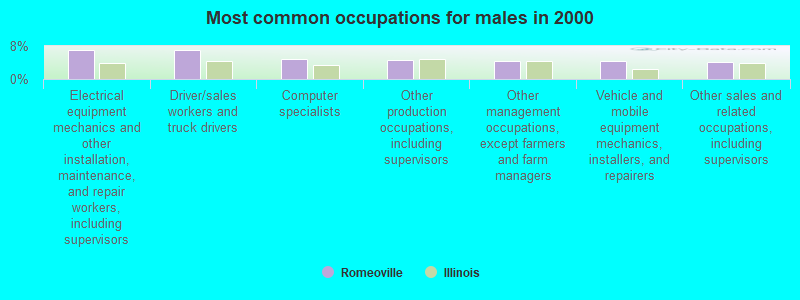
- Electrical equipment mechanics and other installation, maintenance, and repair workers, including supervisors (7.1%)
- Driver/sales workers and truck drivers (7.1%)
- Computer specialists (4.9%)
- Other production occupations, including supervisors (4.5%)
- Other management occupations, except farmers and farm managers (4.4%)
- Vehicle and mobile equipment mechanics, installers, and repairers (4.3%)
- Other sales and related occupations, including supervisors (4.2%)
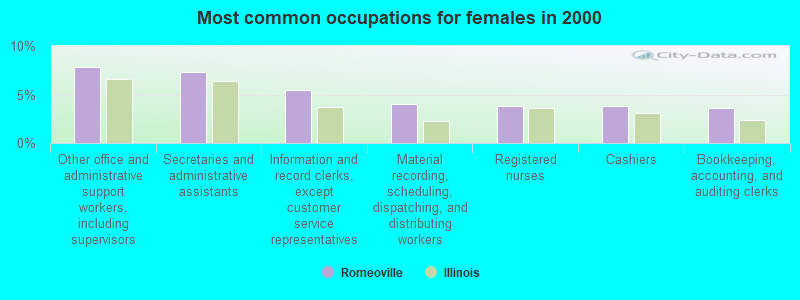
- Other office and administrative support workers, including supervisors (7.9%)
- Secretaries and administrative assistants (7.3%)
- Information and record clerks, except customer service representatives (5.5%)
- Material recording, scheduling, dispatching, and distributing workers (4.0%)
- Registered nurses (3.8%)
- Cashiers (3.8%)
- Bookkeeping, accounting, and auditing clerks (3.6%)
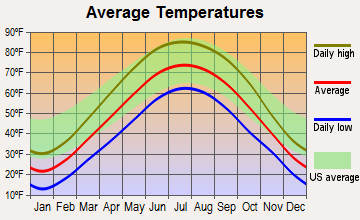
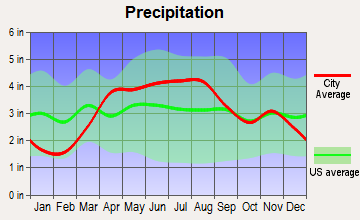
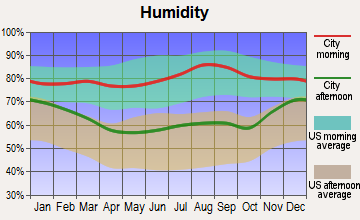
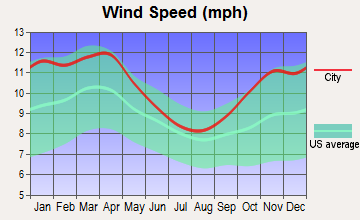
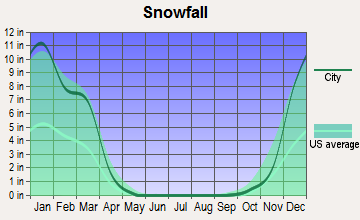
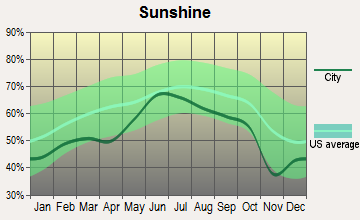
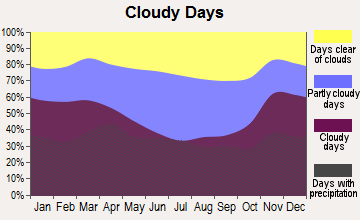
Average climate in Romeoville, Illinois
Based on data reported by over 4,000 weather stations
|
|


(lower is better)
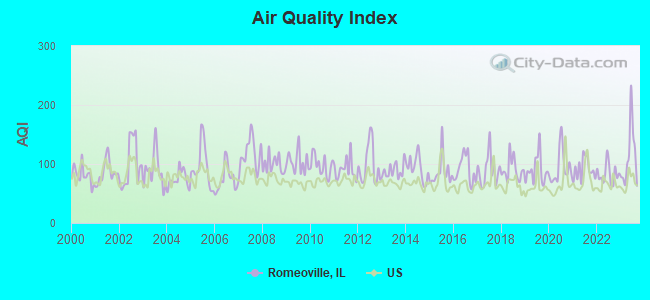
Air Quality Index (AQI) level in 2023 was 112. This is significantly worse than average.
| City: | 112 |
| U.S.: | 73 |
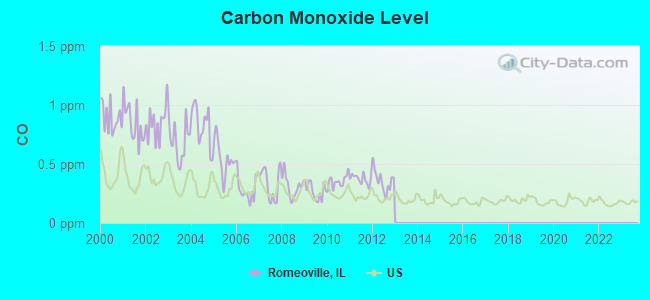
Carbon Monoxide (CO) [ppm] level in 2012 was 0.358. This is significantly worse than average. Closest monitor was 7.7 miles away from the city center.
| City: | 0.358 |
| U.S.: | 0.251 |
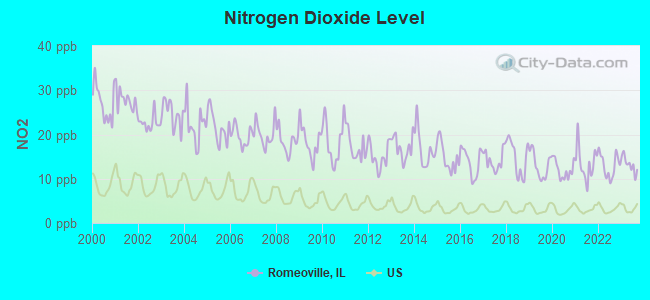
Nitrogen Dioxide (NO2) [ppb] level in 2023 was 13.2. This is significantly worse than average. Closest monitor was 1.5 miles away from the city center.
| City: | 13.2 |
| U.S.: | 5.1 |
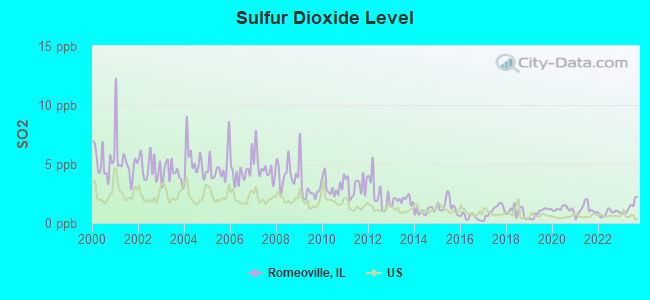
Sulfur Dioxide (SO2) [ppb] level in 2023 was 1.36. This is about average. Closest monitor was 1.5 miles away from the city center.
| City: | 1.36 |
| U.S.: | 1.51 |
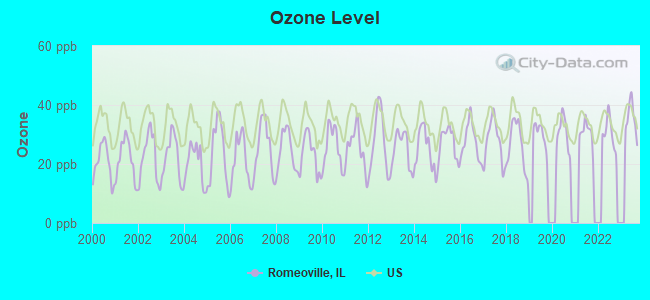
Ozone [ppb] level in 2023 was 35.4. This is about average. Closest monitor was 5.1 miles away from the city center.
| City: | 35.4 |
| U.S.: | 33.3 |
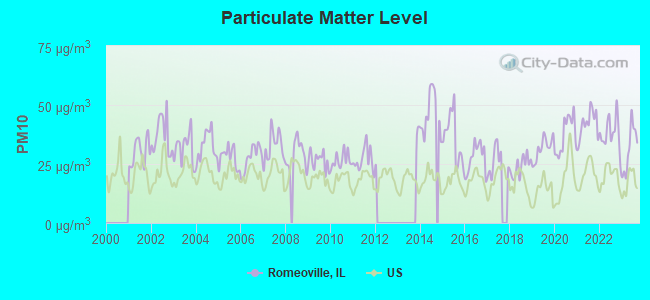
Particulate Matter (PM10) [µg/m3] level in 2023 was 31.4. This is significantly worse than average. Closest monitor was 7.9 miles away from the city center.
| City: | 31.4 |
| U.S.: | 19.2 |
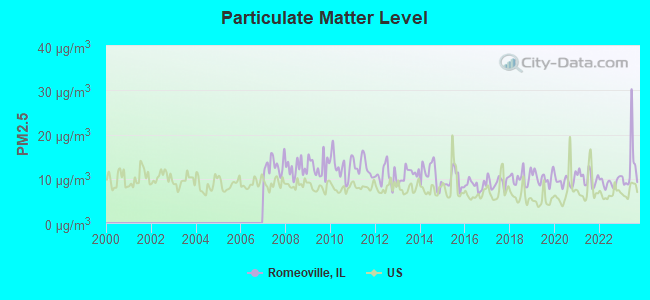
Particulate Matter (PM2.5) [µg/m3] level in 2023 was 12.6. This is significantly worse than average. Closest monitor was 7.9 miles away from the city center.
| City: | 12.6 |
| U.S.: | 8.1 |
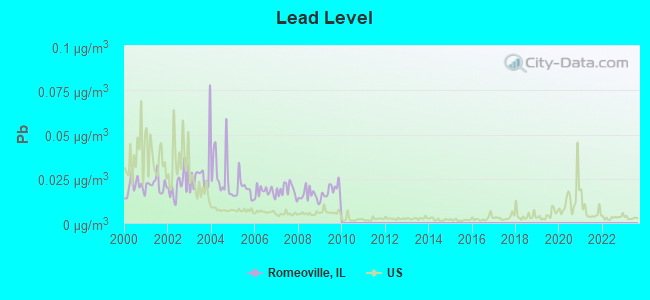
Lead (Pb) [µg/m3] level in 2009 was 0.0180. This is significantly worse than average. Closest monitor was 1.5 miles away from the city center.
| City: | 0.0180 |
| U.S.: | 0.0093 |
Tornado activity:
Romeoville-area historical tornado activity is near Illinois state average. It is 57% greater than the overall U.S. average.
On 8/28/1990, a category F5 (max. wind speeds 261-318 mph) tornado 8.3 miles away from the Romeoville village center killed 29 people and injured 350 people and caused between $50,000 and $500,000 in damages.
On 6/13/1976, a category F4 (max. wind speeds 207-260 mph) tornado 5.7 miles away from the village center killed 2 people and injured 23 people and caused between $500,000 and $5,000,000 in damages.
Earthquake activity:
Romeoville-area historical earthquake activity is significantly above Illinois state average. It is 53% greater than the overall U.S. average.On 4/18/2008 at 09:36:59, a magnitude 5.4 (5.1 MB, 4.8 MS, 5.4 MW, 5.2 MW, Class: Moderate, Intensity: VI - VII) earthquake occurred 220.8 miles away from the city center
On 6/10/1987 at 23:48:54, a magnitude 5.1 (4.9 MB, 4.4 MS, 4.6 MS, 5.1 LG) earthquake occurred 195.4 miles away from the city center
On 4/18/2008 at 09:36:59, a magnitude 5.2 (5.2 MW, Depth: 8.9 mi) earthquake occurred 220.9 miles away from the city center
On 6/28/2004 at 06:10:52, a magnitude 4.2 (4.2 MW, Depth: 6.2 mi, Class: Light, Intensity: IV - V) earthquake occurred 43.1 miles away from Romeoville center
On 6/18/2002 at 17:37:15, a magnitude 5.0 (4.3 MB, 4.6 MW, 5.0 LG) earthquake occurred 253.3 miles away from Romeoville center
On 4/18/2008 at 15:14:16, a magnitude 4.8 (4.5 MB, 4.8 MW, 4.6 MW) earthquake occurred 219.3 miles away from Romeoville center
Magnitude types: regional Lg-wave magnitude (LG), body-wave magnitude (MB), surface-wave magnitude (MS), moment magnitude (MW)
Natural disasters:
The number of natural disasters in Will County (17) is near the US average (15).Major Disasters (Presidential) Declared: 12
Emergencies Declared: 4
Causes of natural disasters: Storms: 9, Floods: 7, Tornadoes: 5, Snowstorms: 2, Winds: 2, Winter Storms: 2, Blizzard: 1, Hurricane: 1, Snow: 1, Other: 1 (Note: some incidents may be assigned to more than one category).

Hospitals and medical centers near Romeoville:
- ADVENTIST BOLINGBROOK HOSPITAL Acute Care Hospitals (about 3 miles away; BOLINGBROOK, IL)
- MEADOWBROOK MANOR - BOLINGBROOK (Nursing Home, about 4 miles away; BOLINGBROOK, IL)
- FMC - BOLINGBROOK DIALYSIS (Dialysis Facility, about 4 miles away; BOLINGBROOK, IL)
- ELITE HEALTHCARE PROVIDERS (Home Health Center, about 5 miles away; LOCKPORT, IL)
- WELLSPRING HEALTHCARE SERVICES, INC (Home Health Center, about 5 miles away; BOLINGBROOK, IL)
- SPECTRUM NURSES, INC (Home Health Center, about 5 miles away; BOLINGBROOK, IL)
- LOCKPORT DAVITA AT HOME (Dialysis Facility, about 5 miles away; LOCKPORT, IL)
Airports located in Romeoville:
- Lewis University Airport (LOT) (Runways: 2, Air Taxi Ops: 4,000, Itinerant Ops: 40,000, Local Ops: 60,000)
Amtrak stations near Romeoville:
- 9 miles: JOLIET (50 E. JEFFERSON ST.) . Services: ticket office, partially wheelchair accessible, enclosed waiting area, public restrooms, public payphones, vending machines, paid short-term parking, paid long-term parking, public transit connection.
- 10 miles: NAPERVILLE (E. 4TH & ELLSWORTH AVE.) . Services: ticket office, partially wheelchair accessible, enclosed waiting area, public restrooms, public payphones, free short-term parking, free long-term parking, call for taxi service, public transit connection.
- 18 miles: LA GRANGE ROAD (LA GRANGE, 25 W. BURLINGTON AVE.) . Services: enclosed waiting area, public payphones, taxi stand, public transit connection.
College/University in Romeoville:
Other colleges/universities with over 2000 students near Romeoville:
- University of St Francis (about 8 miles; Joliet, IL; Full-time enrollment: 2,454)
- Benedictine University (about 10 miles; Lisle, IL; FT enrollment: 5,694)
- North Central College (about 10 miles; Naperville, IL; FT enrollment: 2,860)
- Joliet Junior College (about 11 miles; Joliet, IL; FT enrollment: 11,401)
- College of DuPage (about 15 miles; Glen Ellyn, IL; FT enrollment: 18,910)
- Moraine Valley Community College (about 15 miles; Palos Hills, IL; FT enrollment: 12,008)
- Aurora University (about 15 miles; Aurora, IL; FT enrollment: 4,596)
Public high school in Romeoville:
- ROMEOVILLE HIGH SCHOOL (Students: 1,733, Location: 100 N INDEPENDENCE BLVD, Grades: 9-12)
Private high school in Romeoville:
Public elementary/middle schools in Romeoville:
- SKOFF ELEMENTARY (Students: 891, Location: 775 W NORMANTOWN RD, Grades: KG-5)
- ROBERT C HILL ELEM SCHOOL (Students: 807, Location: 616 DALHART AVE, Grades: KG-5)
- A VITO MARTINEZ MIDDLE SCHOOL (Students: 767, Location: 590 BELMONT DR, Grades: 6-8)
- KENNETH L HERMANSEN ELEMENTARY (Students: 707, Location: 101 WESGLEN PKWY, Grades: KG-5)
- IRENE KING ELEM SCHOOL (Students: 658, Location: 301 EATON AVE, Grades: PK-5)
- JOHN J LUKANCIC MIDDLE SCH (Students: 606, Location: 725 W NORMANTOWN RD, Grades: 6-8)
Private elementary/middle school in Romeoville:
Points of interest:
Notable locations in Romeoville: Mistwood Golf Course (A), Hampton Industrial Park (B), Marquette Business Park (C), Romeoville Branch Fountaindale Public Library (D), South Hall (E), Sheil Hall (F), Philip Lynch Theatre (G), Oremus Fine Arts Center (H), Neil Carey Arena (I), Leckrone Academic Resource Center (J), Founders Hall (K), Fitzpatrick Hall (L), De La Salle South Residence Hall (M), De La Salle North Residence Hall (N), Benilde Hall (O), Fitzpatrick House (P), Romeoville Fire Department Station 2 (Q), Uno - Ven Fire Department (R), Lockport Township Fire Protection District Station 5 (S), Romeoville Fire Department Station 1 (T). Display/hide their locations on the map
Churches in Romeoville include: Bible Baptist Church (A), First Baptist Church (B), Sancta Alberta Chapel (C), Lighthouse Baptist Church (D), Good Shepherd Church (E). Display/hide their locations on the map
Cemeteries: Alexander Cemetery (1), Bronson Cemetery (2), Resurrection Cemetery (3). Display/hide their locations on the map
Lake: Lake Strini (A). Display/hide its location on the map
Parks in Romeoville include: Sunset Park (1), Atchley Park (2), College View Park (3), O'Hara Woods Nature Preserve (4), Romeoville Prairie Nature Preserve (5), Meadowalk Park (6), Arlington Park (7), Village Park (8), City Park (9). Display/hide their locations on the map
Hotels: Chicago/Romeoville/Bolingbrook Super 8 M (1301 Marquette Dr) (1), Best Western Romeoville Inn (1280 West Normantown Road) (2), Comfort Inn Romeoville (1235 Lake View Drive) (3), Country Inn-Suites Romeoville (1265 Lakeview Drive) (4), Extended Stayamerica (1225 Lakeview Drive) (5), Extended Stay America - Romeoville (1225 Lakeview Dr) (6). Display/hide their approximate locations on the map
Birthplace of: Gerald Coleman - Ice hockey goaltender, Ian Lorello - Ice dancer, Oliver Gibson (American football) - Football player, Tristan Burge - Football player.
Drinking water stations with addresses in Romeoville and their reported violations in the past:
WALCO TOOL AND ENGINEERING (Population served: 80, Groundwater):Past monitoring violations:
- 50 regular monitoring violations
Drinking water stations with addresses in Romeoville that have no violations reported:
- ISLE A LA CACHE MUSEUM (Address: 501 E ROMEO RD , Population served: 600, Primary Water Source Type: Groundwater)
- COLLEGE VIEW SUBDIVISION (Population served: 570, Primary Water Source Type: Groundwater)
- MONGO MCMICHAELS (Population served: 150, Primary Water Source Type: Groundwater)
- WHOLE FOODS ON CICERO CHICAGO (Population served: 25, Primary Water Source Type: Purch surface water)
| This village: | 3.2 people |
| Illinois: | 2.6 people |
| This village: | 79.4% |
| Whole state: | 65.8% |
| This village: | 6.8% |
| Whole state: | 6.3% |
Likely homosexual households (counted as self-reported same-sex unmarried-partner households)
- Lesbian couples: 0.4% of all households
- Gay men: 0.3% of all households
People in group quarters in Romeoville in 2010:
- 1,161 people in college/university student housing
- 19 people in workers' group living quarters and job corps centers
- 8 people in other noninstitutional facilities
People in group quarters in Romeoville in 2000:
- 898 people in college dormitories (includes college quarters off campus)
- 16 people in nursing homes
- 16 people in other nonhousehold living situations
Banks with most branches in Romeoville (2011 data):
- JPMorgan Chase Bank, National Association: Romeoville/Phelps Branch, Romeoville Dominicks Branch, Weber & Airport Banking Center. Info updated 2011/11/10: Bank assets: $1,811,678.0 mil, Deposits: $1,190,738.0 mil, headquarters in Columbus, OH, positive income, International Specialization, 5577 total offices, Holding Company: Jpmorgan Chase & Co.
- BMO Harris Bank National Association: Romeoville Branch at 626 Town Hall Drive, branch established on 1996/05/15; Weber Road Branch at 80 South Weber Road, branch established on 1999/08/02. Info updated 2011/07/14: Bank assets: $97,264.0 mil, Deposits: $75,624.6 mil, headquarters in Chicago, IL, positive income, 717 total offices, Holding Company: Bank Of Montreal
- Marquette Bank: Romeoville Branch at 1876 W. Airport Rd, branch established on 2004/06/25. Info updated 2006/11/15: Bank assets: $1,703.1 mil, Deposits: $1,439.1 mil, headquarters in Chicago, IL, positive income, Commercial Lending Specialization, 27 total offices, Holding Company: Marquette National Corporation
- Woodforest National Bank: Romeoville Illinois Branch at 420 South Weber Road, branch established on 2007/12/10. Info updated 2011/05/10: Bank assets: $3,488.9 mil, Deposits: $3,097.6 mil, headquarters in Houston, TX, positive income, Commercial Lending Specialization, 766 total offices, Holding Company: Woodforest Financial Group Employee Stock Ownership Plan (With 401(K) Provisions)
- Fifth Third Bank: Romeoville Banking Center Branch at 275 South Weber Road, branch established on 2009/01/05. Info updated 2009/10/05: Bank assets: $114,540.4 mil, Deposits: $89,689.1 mil, headquarters in Cincinnati, OH, positive income, Commercial Lending Specialization, 1378 total offices, Holding Company: Fifth Third Bancorp
- West Suburban Bank: Romeoville Branch at 505 North Weber Road, branch established on 2000/01/07. Info updated 2011/02/23: Bank assets: $1,927.7 mil, Deposits: $1,744.7 mil, headquarters in Lombard, IL, positive income, Commercial Lending Specialization, 44 total offices, Holding Company: West Suburban Bancorp, Inc.
- TCF National Bank: Jewel-Romeoville Branch at 20 S. Weber Road, branch established on 2002/08/08. Info updated 2009/11/23: Bank assets: $19,007.0 mil, Deposits: $12,377.0 mil, headquarters in Sioux Falls, SD, positive income, Commercial Lending Specialization, 441 total offices, Holding Company: Tcf Financial Corporation
- Bank of America, National Association: Romeoville Banking Center at 24 South Seber Road, branch established on 2004/10/12. Info updated 2009/11/18: Bank assets: $1,451,969.3 mil, Deposits: $1,077,176.8 mil, headquarters in Charlotte, NC, positive income, 5782 total offices, Holding Company: Bank Of America Corporation
- PNC Bank, National Association: Romeoville Branch at 495 North Weber Road, branch established on 2001/11/19. Info updated 2012/03/20: Bank assets: $263,309.6 mil, Deposits: $197,343.0 mil, headquarters in Wilmington, DE, positive income, Commercial Lending Specialization, 3085 total offices, Holding Company: Pnc Financial Services Group, Inc., The
For population 15 years and over in Romeoville:
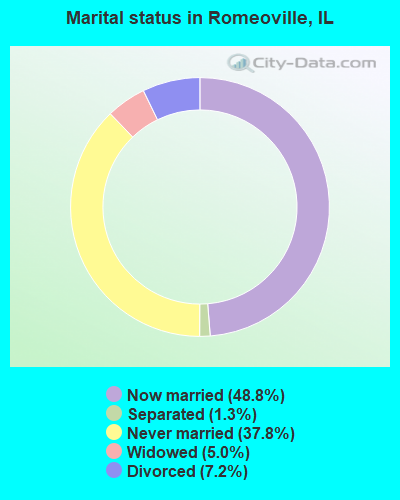
- Never married: 37.8%
- Now married: 48.8%
- Separated: 1.3%
- Widowed: 5.0%
- Divorced: 7.2%
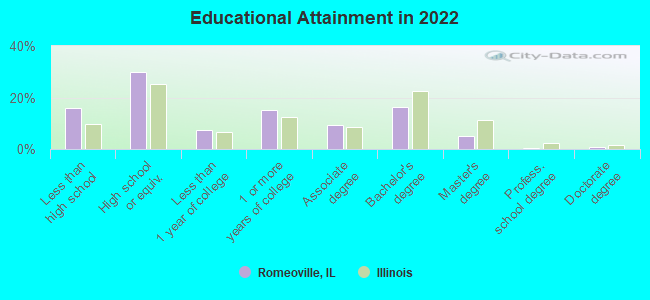
For population 25 years and over in Romeoville:
- High school or higher: 84.6%
- Bachelor's degree or higher: 22.3%
- Graduate or professional degree: 6.0%
- Unemployed: 4.4%
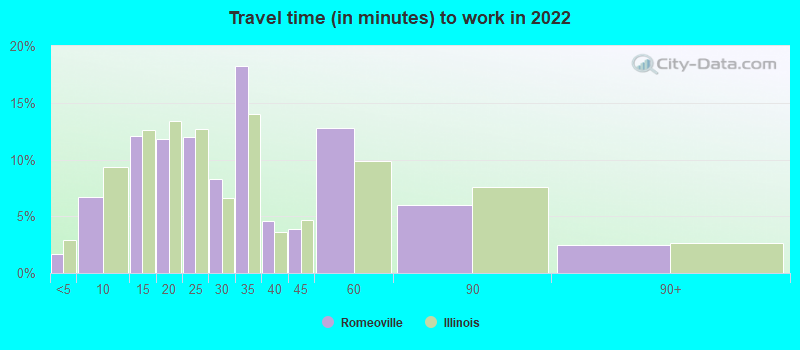
- Mean travel time to work (commute): 27.5 minutes
| Here: | 14.5 |
| Illinois average: | 12.5 |
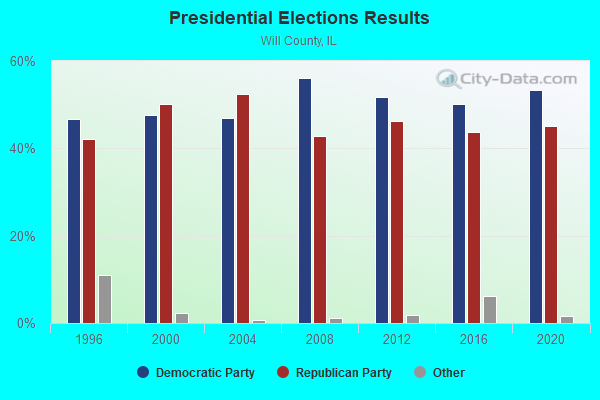
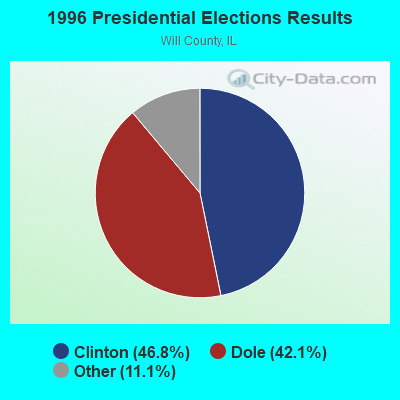
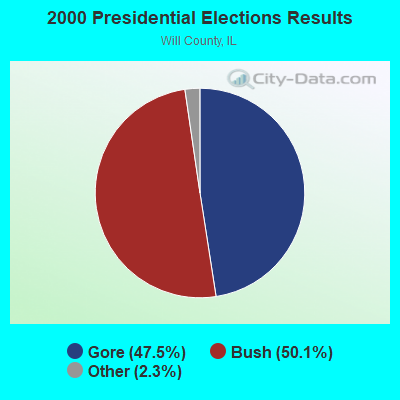
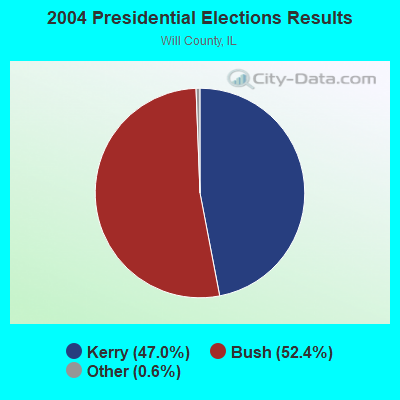
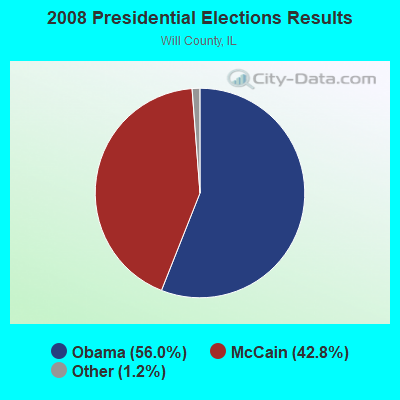
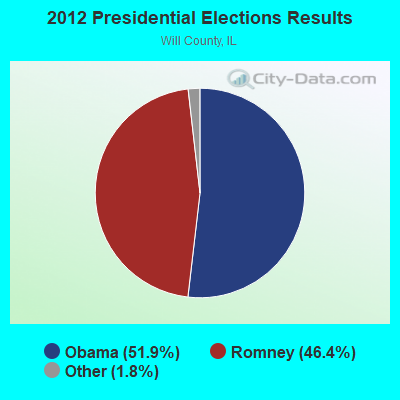
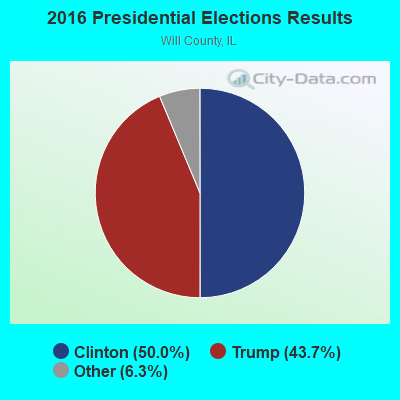
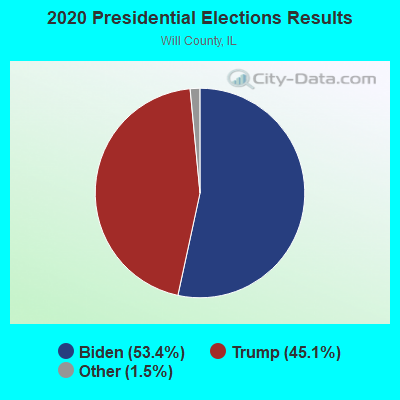
Graphs represent county-level data. Detailed 2008 Election Results
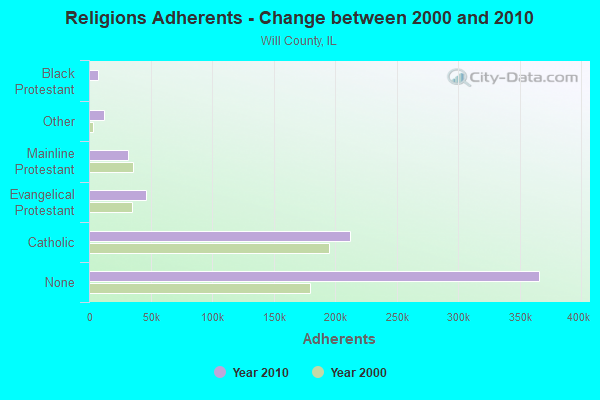
Religion statistics for Romeoville, IL (based on Will County data)
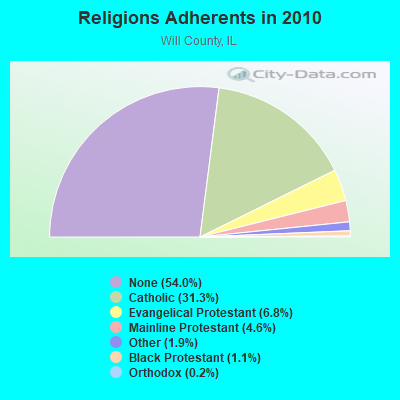
| Religion | Adherents | Congregations |
|---|---|---|
| Catholic | 212,252 | 39 |
| Evangelical Protestant | 46,404 | 188 |
| Mainline Protestant | 31,313 | 73 |
| Other | 12,574 | 20 |
| Black Protestant | 7,426 | 16 |
| Orthodox | 1,536 | 6 |
| None | 366,055 | - |
Food Environment Statistics:
| Will County: | 1.27 / 10,000 pop. |
| Illinois: | 2.24 / 10,000 pop. |
| Will County: | 0.07 / 10,000 pop. |
| Illinois: | 0.08 / 10,000 pop. |
| This county: | 0.48 / 10,000 pop. |
| State: | 0.75 / 10,000 pop. |
| Here: | 1.82 / 10,000 pop. |
| State: | 2.61 / 10,000 pop. |
| Will County: | 4.26 / 10,000 pop. |
| Illinois: | 6.86 / 10,000 pop. |
| This county: | 7.7% |
| Illinois: | 8.3% |
| This county: | 26.3% |
| State: | 25.2% |
| This county: | 13.4% |
| Illinois: | 14.5% |
Health and Nutrition:
| This city: | 47.0% |
| Illinois: | 49.5% |
| This city: | 44.1% |
| Illinois: | 47.2% |
| Romeoville: | 28.8 |
| Illinois: | 28.6 |
| Here: | 21.9% |
| Illinois: | 20.5% |
| Romeoville: | 10.5% |
| Illinois: | 10.8% |
| Romeoville: | 6.8 |
| State: | 6.8 |
| This city: | 32.4% |
| State: | 33.4% |
| This city: | 56.0% |
| Illinois: | 56.4% |
| Here: | 80.7% |
| Illinois: | 79.9% |
More about Health and Nutrition of Romeoville, IL Residents
| Local government employment and payroll (March 2022) | |||||
| Function | Full-time employees | Monthly full-time payroll | Average yearly full-time wage | Part-time employees | Monthly part-time payroll |
|---|---|---|---|---|---|
| Police Protection - Officers | 66 | $681,916 | $123,985 | 0 | $0 |
| Firefighters | 29 | $298,030 | $123,323 | 8 | $34,724 |
| Parks and Recreation | 23 | $150,020 | $78,271 | 8 | $7,311 |
| Streets and Highways | 20 | $178,974 | $107,384 | 0 | $0 |
| Other Government Administration | 17 | $122,928 | $86,773 | 9 | $17,688 |
| Water Supply | 12 | $111,910 | $111,910 | 0 | $0 |
| Police - Other | 11 | $63,694 | $69,484 | 11 | $25,495 |
| Sewerage | 11 | $103,091 | $112,463 | 0 | $0 |
| Financial Administration | 11 | $72,843 | $79,465 | 4 | $13,306 |
| Other and Unallocable | 8 | $66,406 | $99,609 | 98 | $82,980 |
| Fire - Other | 6 | $43,825 | $87,650 | 54 | $101,357 |
| Welfare | 1 | $3,672 | $44,064 | 0 | $0 |
| Totals for Government | 215 | $1,897,309 | $105,896 | 192 | $282,861 |
Romeoville government finances - Expenditure in 2021 (per resident):
- Construction - Parks and Recreation: $7,278,000 ($181.42)
Regular Highways: $2,131,000 ($53.12)
Water Utilities: $1,946,000 ($48.51)
Financial Administration: $1,273,000 ($31.73)
Solid Waste Management: $409,000 ($10.20)
Central Staff Services: $234,000 ($5.83)
- Current Operations - Police Protection: $14,335,000 ($357.33)
Central Staff Services: $9,695,000 ($241.67)
Sewerage: $7,969,000 ($198.64)
Local Fire Protection: $6,994,000 ($174.34)
Regular Highways: $6,627,000 ($165.19)
Water Utilities: $6,382,000 ($159.08)
Parks and Recreation: $4,408,000 ($109.88)
Financial Administration: $3,300,000 ($82.26)
General - Other: $1,224,000 ($30.51)
Parking Facilities: $657,000 ($16.38)
- General - Interest on Debt: $5,186,000 ($129.27)
- Other Capital Outlay - Solid Waste Management: $4,568,000 ($113.87)
Regular Highways: $2,786,000 ($69.45)
Water Utilities: $1,728,000 ($43.07)
Police Protection: $812,000 ($20.24)
Local Fire Protection: $245,000 ($6.11)
Parks and Recreation: $132,000 ($3.29)
Central Staff Services: $35,000 ($0.87)
- Total Salaries and Wages: $25,241,000 ($629.18)
Romeoville government finances - Revenue in 2021 (per resident):
- Charges - Sewerage: $10,567,000 ($263.40)
Other: $3,914,000 ($97.56)
Solid Waste Management: $3,790,000 ($94.47)
Parks and Recreation: $710,000 ($17.70)
- Federal Intergovernmental - Other: $1,726,000 ($43.02)
- Local Intergovernmental - Other: $2,145,000 ($53.47)
- Miscellaneous - General Revenue - Other: $4,312,000 ($107.49)
Fines and Forfeits: $1,360,000 ($33.90)
Interest Earnings: $213,000 ($5.31)
- Revenue - Water Utilities: $8,819,000 ($219.83)
- State Intergovernmental - General Local Government Support: $13,457,000 ($335.44)
Highways: $2,964,000 ($73.88)
Other: $96,000 ($2.39)
- Tax - Property: $21,051,000 ($524.74)
Other Selective Sales: $16,079,000 ($400.80)
Public Utilities Sales: $5,543,000 ($138.17)
Other License: $2,781,000 ($69.32)
Romeoville government finances - Debt in 2021 (per resident):
- Long Term Debt - Beginning Outstanding - Unspecified Public Purpose: $175,543,000 ($4375.78)
Outstanding Unspecified Public Purpose: $153,647,000 ($3829.97)
Beginning Outstanding - Public Debt for Private Purpose: $29,042,000 ($723.93)
Outstanding Nonguaranteed - Industrial Revenue: $27,194,000 ($677.87)
Retired Unspecified Public Purpose: $26,198,000 ($653.04)
Issue, Unspecified Public Purpose: $4,302,000 ($107.24)
Retired Nonguaranteed - Public Debt for Private Purpose: $1,848,000 ($46.07)
Romeoville government finances - Cash and Securities in 2021 (per resident):
- Other Funds - Cash and Securities: $97,397,000 ($2427.82)
- Sinking Funds - Cash and Securities: $27,194,000 ($677.87)
6.75% of this county's 2021 resident taxpayers lived in other counties in 2020 ($73,828 average adjusted gross income)
| Here: | 6.75% |
| Illinois average: | 5.09% |
0.01% of residents moved from foreign countries ($43 average AGI)
Will County: 0.01% Illinois average: 0.01%
Top counties from which taxpayers relocated into this county between 2020 and 2021:
| from Cook County, IL | |
| from DuPage County, IL | |
| from Kendall County, IL |
6.85% of this county's 2020 resident taxpayers moved to other counties in 2021 ($78,688 average adjusted gross income)
| Here: | 6.85% |
| Illinois average: | 6.10% |
0.01% of residents moved to foreign countries ($42 average AGI)
Will County: 0.01% Illinois average: 0.01%
Top counties to which taxpayers relocated from this county between 2020 and 2021:
| to Cook County, IL | |
| to DuPage County, IL | |
| to Kendall County, IL |
| Businesses in Romeoville, IL | ||||
| Name | Count | Name | Count | |
|---|---|---|---|---|
| 7-Eleven | 3 | Jimmy John's | 1 | |
| ALDI | 1 | KFC | 1 | |
| AT&T | 1 | Kohl's | 1 | |
| Ace Hardware | 1 | Maurices | 1 | |
| Applebee's | 1 | McDonald's | 3 | |
| Arby's | 1 | Nike | 1 | |
| AutoZone | 1 | OfficeMax | 1 | |
| Baskin-Robbins | 1 | Panda Express | 1 | |
| Best Western | 1 | Payless | 1 | |
| Blockbuster | 1 | Penske | 1 | |
| Brunswick Bowling & Billiards | 1 | Popeyes | 1 | |
| Buffalo Wild Wings | 1 | Ryder Rental & Truck Leasing | 1 | |
| Burger King | 2 | Safeway | 1 | |
| Circle K | 1 | Starbucks | 3 | |
| Cold Stone Creamery | 1 | Subway | 2 | |
| Comfort Inn | 1 | Super 8 | 1 | |
| Cracker Barrel | 1 | T-Mobile | 1 | |
| Cricket Wireless | 1 | Taco Bell | 1 | |
| Dairy Queen | 1 | Target | 1 | |
| Discount Tire | 1 | U-Haul | 1 | |
| Dunkin Donuts | 3 | U.S. Cellular | 1 | |
| Extended Stay America | 1 | UPS | 7 | |
| Famous Footwear | 1 | Verizon Wireless | 1 | |
| FedEx | 4 | Vons | 1 | |
| Firestone Complete Auto Care | 1 | Walgreens | 3 | |
| GNC | 1 | Walmart | 1 | |
| H&R Block | 1 | Wendy's | 2 | |
| Jewel-Osco | 1 | White Castle | 1 | |
Strongest AM radio stations in Romeoville:
- WYLL (1160 AM; 50 kW; CHICAGO, IL; Owner: SCA LICENSE CORPORATION)
- WMVP (1000 AM; 50 kW; CHICAGO, IL; Owner: ABC, INC.)
- WLS (890 AM; 50 kW; CHICAGO, IL; Owner: WLS, INC.)
- WSCR (670 AM; 50 kW; CHICAGO, IL; Owner: INFINITY BROADCASTING OPERATIONS, INC.)
- WBBM (780 AM; 50 kW; CHICAGO, IL; Owner: INFINITY BROADCASTING OPERATIONS, INC.)
- WGN (720 AM; 50 kW; CHICAGO, IL; Owner: WGN CONTINENTAL BROADCASTING CO.)
- WVIV (1200 AM; 20 kW; CHICAGO, IL; Owner: WLXX-AM LICENSE CORP.)
- WAGG (610 AM; BIRMINGHAM, AL; Owner: CXR HOLDINGS, INC.)
- WTMJ (620 AM; 50 kW; MILWAUKEE, WI; Owner: JOURNAL BROADCAST CORPORATION)
- WAUR (930 AM; 4 kW; SANDWICH, IL; Owner: CHRISTIAN BROADCASTING SYSTEM, LTD.)
- WJOL (1340 AM; 1 kW; JOLIET, IL; Owner: NM LICENSING, LLC)
- WRDZ (1300 AM; 4 kW; LA GRANGE, IL; Owner: ABC, INC.)
- WMBI (1110 AM; daytime; 5 kW; CHICAGO, IL; Owner: THE MOODY BIBLE INSTITUTE OF CHICAGO)
Strongest FM radio stations in Romeoville:
- WLRA (88.1 FM; LOCKPORT, IL; Owner: LEWIS UNIVERSITY)
- WLEY-FM (107.9 FM; AURORA, IL; Owner: WLEY LICENSING, INC.)
- WJTW (93.5 FM; JOLIET, IL; Owner: NM LICENSING, LLC)
- WLLI-FM (96.7 FM; JOLIET, IL; Owner: NM LICENSING, LLC)
- WERV-FM (95.9 FM; AURORA, IL; Owner: NM LICENSING, LLC)
- WCKG (105.9 FM; ELMWOOD PARK, IL; Owner: INFINITY HOLDINGS CORPORATION OF ORLANDO)
- WLIT-FM (93.9 FM; CHICAGO, IL; Owner: AMFM RADIO LICENSES, L.L.C.)
- WJMK (104.3 FM; CHICAGO, IL; Owner: INFINITY BROADCASTING CORP. OF ILLINOIS)
- WNUA (95.5 FM; CHICAGO, IL; Owner: AMFM RADIO LICENSES, L.L.C.)
- WTMX (101.9 FM; SKOKIE, IL; Owner: BONNEVILLE HOLDING COMPANY)
- WBBM-FM (96.3 FM; CHICAGO, IL; Owner: INFINITY BROADCASTING OPERATIONS, INC.)
- WKSC-FM (103.5 FM; CHICAGO, IL; Owner: AMFM RADIO LICENSES, L.L.C.)
- WGCI-FM (107.5 FM; CHICAGO, IL; Owner: AMFM RADIO LICENSES, L.L.C.)
- WFMT (98.7 FM; CHICAGO, IL; Owner: WINDOW TO THE WORLD COMMUNICATIONS)
- WZZN (94.7 FM; CHICAGO, IL; Owner: ABC CHICAGO FM RADIO,INC.)
- WBEZ (91.5 FM; CHICAGO, IL; Owner: THE WBEZ ALLIANCE, INC.)
- WKQX (101.1 FM; CHICAGO, IL; Owner: EMMIS RADIO LICENSE CORPORATION)
- WLUP-FM (97.9 FM; CHICAGO, IL; Owner: BONNEVILLE HOLDING COMPANY)
- WNND (100.3 FM; CHICAGO, IL; Owner: BONNEVILLE HOLDING COMPANY)
- WOJO (105.1 FM; EVANSTON, IL; Owner: TICHENOR LICENSE CORPORATION ("TLC"))
TV broadcast stations around Romeoville:
- WLS-TV (Channel 7; CHICAGO, IL; Owner: WLS TELEVISION, INC.)
- WMAQ-TV (Channel 5; CHICAGO, IL; Owner: NBC SUBSIDIARY (WMAQ-TV), INC.)
- WTTW (Channel 11; CHICAGO, IL; Owner: WINDOW TO THE WORLD COMMUNICATIONS, INC.)
- WGN-TV (Channel 9; CHICAGO, IL; Owner: WGN CONTINENTAL BROADCASTING COMPANY)
- WGBO-TV (Channel 66; JOLIET, IL; Owner: WGBO LICENSE PARTNERSHIP, G.P.)
- WBBM-TV (Channel 2; CHICAGO, IL; Owner: CBS BROADCASTING INC.)
- WPWR-TV (Channel 50; GARY, IN; Owner: FOX TELEVISION STATIONS, INC.)
- WXFT (Channel 60; AURORA, IL; Owner: TELEFUTURA CHICAGO LLC)
- WCIU-TV (Channel 26; CHICAGO, IL; Owner: WCIU-TV LIMITED PARTNERSHIP)
- WCPX (Channel 38; CHICAGO, IL; Owner: PAXSON CHICAGO LICENSE, INC.)
- WFLD (Channel 32; CHICAGO, IL; Owner: FOX TELEVISION STATIONS, INC.)
- W68DO (Channel 68; PALATINE, IL; Owner: TRINITY BROADCASTING NETWORK)
- WFBT-CA (Channel 23; CHICAGO, IL; Owner: CHANNEL 23 LIMITED PARTNERSHIP)
- WJYS (Channel 62; HAMMOND, IN; Owner: JOVON BROADCASTING CORPORATION)
- WSNS-TV (Channel 44; CHICAGO, IL; Owner: TELEMUNDO OF CHICAGO, INC.)
- W34CK (Channel 34; ARLINGTON HEIGHTS, IL; Owner: FIRST UNITED, INC.)
- WOCH-LP (Channel 28; CHICAGO, IL; Owner: KM LPTV OF CHICAGO-28, L.L.C.)
- WYCC (Channel 20; CHICAGO, IL; Owner: COLLEGE DIST. #508, COUNTY OF COOK)
- W24AJ (Channel 24; AURORA, IL; Owner: NELSON TV, INC.)
- WOCK-CA (Channel 13; CHICAGO, IL; Owner: KM LPTV OF CHICAGO-13, L.L.C.)
- WYIN (Channel 56; GARY, IN; Owner: NORTHWEST INDIANA PUBLIC BROADCASTING, INC.)
- W54AP (Channel 54; BLUE ISLAND, IL; Owner: CATHOLIC VIEWS BROADCASTS, INC.)
- W64CQ (Channel 64; ARLINGTON HEIGHTS, IL; Owner: TRINITY BROADCASTING NETWORK)
- WWTO-TV (Channel 35; LASALLE, IL; Owner: TRINITY BROADCASTING NETWORK)
- WSPY-LP (Channel 30; PLANO, IL; Owner: WSPY-TV, INC.)
- National Bridge Inventory (NBI) Statistics
- 20Number of bridges
- 351ft / 107mTotal length
- $362,000Total costs
- 489,000Total average daily traffic
- 61,531Total average daily truck traffic
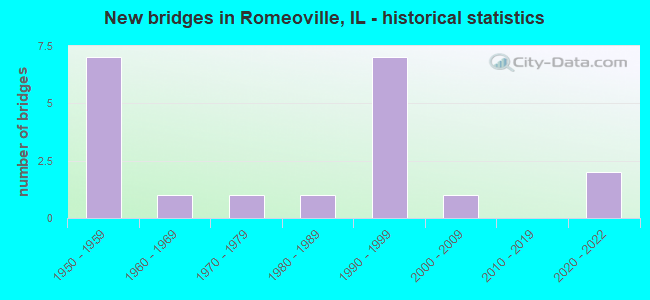
- New bridges - historical statistics
- 71950-1959
- 11960-1969
- 11970-1979
- 11980-1989
- 71990-1999
- 12000-2009
- 22020-2022
FCC Registered Private Land Mobile Towers: 3 (See the full list of FCC Registered Private Land Mobile Towers in Romeoville, IL)
FCC Registered Broadcast Land Mobile Towers: 55 (See the full list of FCC Registered Broadcast Land Mobile Towers)
FCC Registered Microwave Towers: 44 (See the full list of FCC Registered Microwave Towers in this town)
FCC Registered Maritime Coast & Aviation Ground Towers: 15 (See the full list of FCC Registered Maritime Coast & Aviation Ground Towers)
FCC Registered Amateur Radio Licenses: 83 (See the full list of FCC Registered Amateur Radio Licenses in Romeoville)
FAA Registered Aircraft Manufacturers and Dealers: 1 (See the full list of FAA Registered Manufacturers and Dealers in Romeoville)
FAA Registered Aircraft: 46 (See the full list of FAA Registered Aircraft)
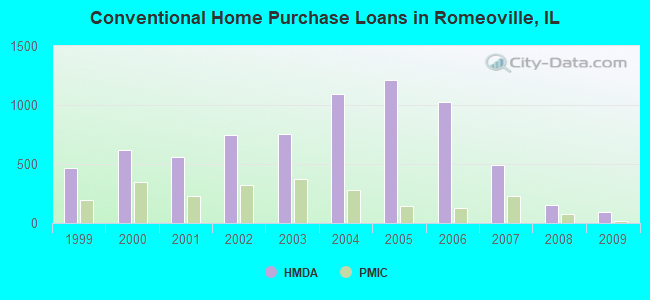
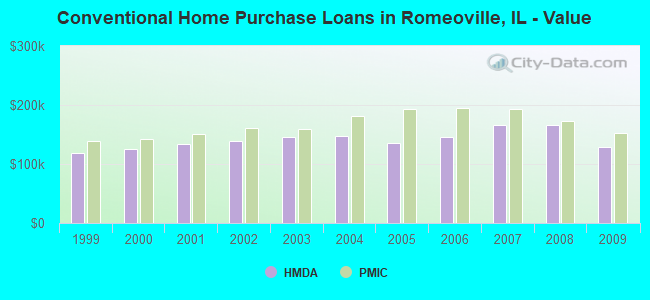
| Home Mortgage Disclosure Act Aggregated Statistics For Year 2009 (Based on 4 partial tracts) | ||||||||||||||
| A) FHA, FSA/RHS & VA Home Purchase Loans | B) Conventional Home Purchase Loans | C) Refinancings | D) Home Improvement Loans | E) Loans on Dwellings For 5+ Families | F) Non-occupant Loans on < 5 Family Dwellings (A B C & D) | G) Loans On Manufactured Home Dwelling (A B C & D) | ||||||||
|---|---|---|---|---|---|---|---|---|---|---|---|---|---|---|
| Number | Average Value | Number | Average Value | Number | Average Value | Number | Average Value | Number | Average Value | Number | Average Value | Number | Average Value | |
| LOANS ORIGINATED | 215 | $148,194 | 93 | $128,640 | 592 | $159,426 | 12 | $68,548 | 1 | $18,315,360 | 37 | $138,818 | 2 | $160,560 |
| APPLICATIONS APPROVED, NOT ACCEPTED | 20 | $148,432 | 10 | $155,834 | 65 | $178,672 | 3 | $62,400 | 0 | $0 | 3 | $205,070 | 0 | $0 |
| APPLICATIONS DENIED | 50 | $160,705 | 22 | $127,466 | 246 | $173,001 | 13 | $48,197 | 0 | $0 | 9 | $146,716 | 1 | $119,830 |
| APPLICATIONS WITHDRAWN | 25 | $154,122 | 10 | $113,308 | 126 | $167,227 | 3 | $62,613 | 0 | $0 | 7 | $115,520 | 0 | $0 |
| FILES CLOSED FOR INCOMPLETENESS | 13 | $154,124 | 6 | $157,150 | 52 | $184,423 | 1 | $146,410 | 0 | $0 | 1 | $44,180 | 0 | $0 |
Detailed HMDA statistics for the following Tracts: 8802.01 , 8802.02, 8804.05, 8805.01
| Private Mortgage Insurance Companies Aggregated Statistics For Year 2009 (Based on 4 partial tracts) | ||||||
| A) Conventional Home Purchase Loans | B) Refinancings | C) Non-occupant Loans on < 5 Family Dwellings (A & B) | ||||
|---|---|---|---|---|---|---|
| Number | Average Value | Number | Average Value | Number | Average Value | |
| LOANS ORIGINATED | 19 | $151,951 | 13 | $173,989 | 0 | $0 |
| APPLICATIONS APPROVED, NOT ACCEPTED | 8 | $160,719 | 9 | $188,086 | 2 | $129,855 |
| APPLICATIONS DENIED | 2 | $134,775 | 4 | $172,332 | 0 | $0 |
| APPLICATIONS WITHDRAWN | 2 | $181,660 | 5 | $168,214 | 0 | $0 |
| FILES CLOSED FOR INCOMPLETENESS | 0 | $0 | 2 | $176,920 | 0 | $0 |
Detailed PMIC statistics for the following Tracts: 8802.01 , 8802.02, 8804.05, 8805.01
2002 - 2018 National Fire Incident Reporting System (NFIRS) incidents
- Fire incident types reported to NFIRS in Romeoville, IL
- 63443.1%Structure Fires
- 59240.2%Outside Fires
- 20714.1%Mobile Property/Vehicle Fires
- 392.6%Other
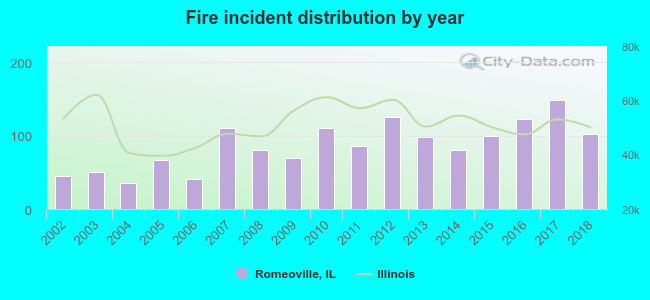 Based on the data from the years 2002 - 2018 the average number of fires per year is 87. The highest number of fires - 148 took place in 2017, and the least - 35 in 2004. The data has a growing trend.
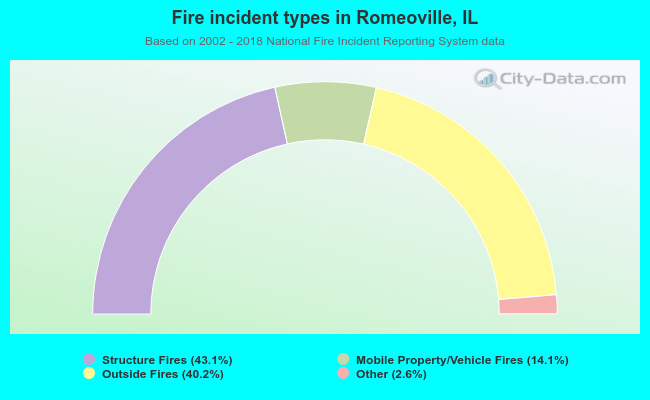 When looking into fire subcategories, the most incidents belonged to: Structure Fires (43.1%), and Outside Fires (40.2%).
Fire-safe hotels and motels in Romeoville, Illinois:
- Extended Stay America - Chicago - Romeoville -Bollingbrook, 1225 Lakeview Dr, Romeoville, Illinois 60446 , Phone: (630) 226-8966, Fax: (630) 226-8967
- Country Inn & Suites, 1265 Lk View Dr, Romeoville, Illinois 60446 , Phone: (630) 378-1052, Fax: (630) 378-1053
- Comfort Inn, 1235 Lakeview Dr, Romeoville, Illinois 60446 , Phone: (630) 226-1900, Fax: (630) 226-4654
- Days Inn & Suites, 1280 W Normantown Rd, Romeoville, Illinois 60446 , Phone: (815) 372-1000, Fax: (815) 372-0625
| Most common first names in Romeoville, IL among deceased individuals | ||
| Name | Count | Lived (average) |
|---|---|---|
| John | 39 | 72.5 years |
| Robert | 35 | 69.5 years |
| Mary | 29 | 79.2 years |
| Edward | 24 | 74.0 years |
| William | 24 | 67.3 years |
| James | 23 | 64.8 years |
| Joseph | 21 | 72.0 years |
| Charles | 20 | 75.9 years |
| Donald | 15 | 68.9 years |
| Frank | 13 | 77.7 years |
| Most common last names in Romeoville, IL among deceased individuals | ||
| Last name | Count | Lived (average) |
|---|---|---|
| Miller | 12 | 72.3 years |
| Johnson | 8 | 79.1 years |
| Jones | 7 | 62.2 years |
| Robinson | 6 | 65.5 years |
| Martin | 5 | 78.4 years |
| Smith | 5 | 74.8 years |
| King | 4 | 67.5 years |
| Killian | 4 | 79.0 years |
| Lovett | 4 | 64.0 years |
| Thompson | 4 | 72.2 years |
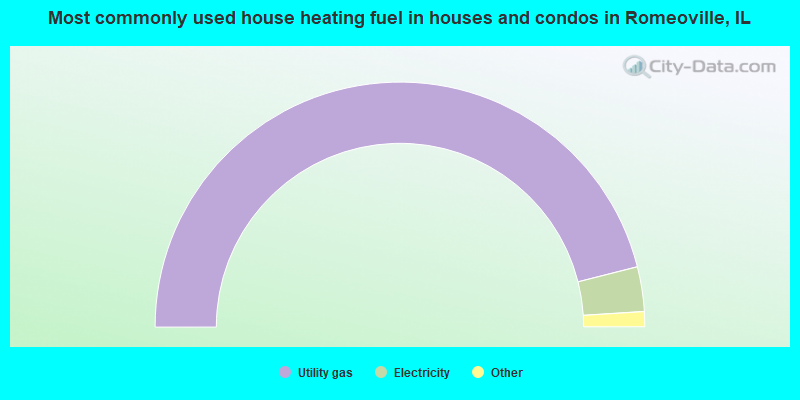
- 92.1%Utility gas
- 5.9%Electricity
- 1.2%Bottled, tank, or LP gas
- 0.4%Fuel oil, kerosene, etc.
- 0.2%No fuel used
- 0.2%Other fuel

- 80.9%Utility gas
- 16.4%Electricity
- 2.7%Bottled, tank, or LP gas
Romeoville compared to Illinois state average:
- Unemployed percentage significantly below state average.
- Hispanic race population percentage significantly above state average.
- Median age significantly below state average.
- Foreign-born population percentage significantly above state average.
- Renting percentage below state average.
- Length of stay since moving in above state average.
- House age significantly below state average.
- Number of college students above state average.
Romeoville on our top lists:
- #37 on the list of "Top 101 cities with the smallest household incomes disparities (population 5,000+)"
- #98 on the list of "Top 101 cities with the most residents born in Other Central America (population 500+)"
- #34 (60446) on the list of "Top 101 zip codes with the largest percentage of Lithuanian first ancestries (pop 5,000+)"
- #7 on the list of "Top 101 counties with the lowest percentage of residents relocating from foreign countries between 2010 and 2011"
- #10 on the list of "Top 101 counties with the highest percentage of residents that drank alcohol in the past 30 days"
- #18 on the list of "Top 101 counties with the largest increase in the number of infant deaths per 1000 residents 2000-2006 to 2007-2013 (pop. 50,000+)"
- #19 on the list of "Top 101 counties with the largest decrease in the number of births per 1000 residents 2000-2006 to 2007-2013 (pop 50,000+)"
- #48 on the list of "Top 101 counties with the lowest surface withdrawal of fresh water for public supply (pop. 50,000+)"

|
|
Total of 138 patent applications in 2008-2024.