South Elgin, Illinois

South Elgin: right off the fox trail!
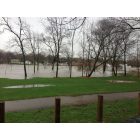
South Elgin: Ohh fox river you is flooded but good fishing

South Elgin: Ohh fox river you is flooded but good fishing
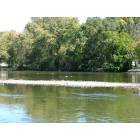
South Elgin: Fox River
- add
your
Submit your own pictures of this village and show them to the world
- OSM Map
- General Map
- Google Map
- MSN Map
Population change since 2000: +49.1%
| Males: 12,432 | |
| Females: 11,575 |
| Median resident age: | 39.6 years |
| Illinois median age: | 39.1 years |
Zip codes: 60177.
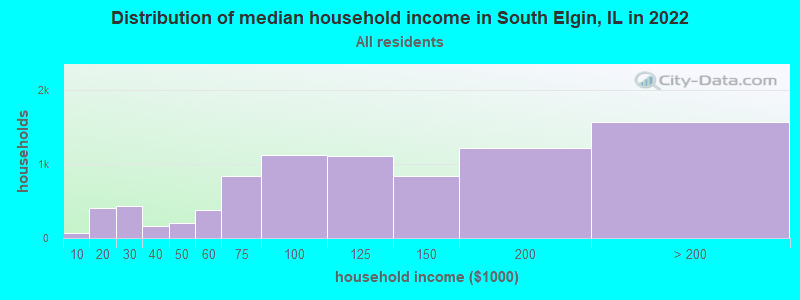
| South Elgin: | $114,542 |
| IL: | $76,708 |
Estimated per capita income in 2022: $50,032 (it was $25,676 in 2000)
South Elgin village income, earnings, and wages data
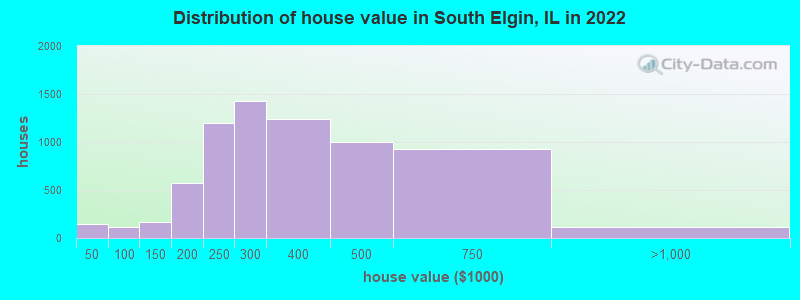
Estimated median house or condo value in 2022: $300,814 (it was $151,200 in 2000)
| South Elgin: | $300,814 |
| IL: | $251,600 |
Mean prices in 2022: all housing units: $297,171; detached houses: $320,561; townhouses or other attached units: $205,546; in 2-unit structures: $465,780; in 3-to-4-unit structures: $230,950; in 5-or-more-unit structures: $193,817
Median gross rent in 2022: $1,557.
(3.5% for White Non-Hispanic residents, 8.4% for Black residents, 13.0% for Hispanic or Latino residents, 59.7% for American Indian residents, 12.2% for other race residents, 11.1% for two or more races residents)
Detailed information about poverty and poor residents in South Elgin, IL

Compare current foreclosures in South Elgin, IL:
| Photo | Address | Area | Beds / Baths | Price | Details |
|---|---|---|---|---|---|

|
#1
Crystal Ave
South Elgin, IL 60177
|
720 sq. feet
|
1 baths 2 beds |
show details | |

|
#2
N Mclean Blvd
South Elgin, IL 60177
|
- sq. feet
|
- baths - beds |
show details | |

|
#3
Nicole Dr Unit E
South Elgin, IL 60177
|
- sq. feet
|
- baths - beds |
show details | |

|
#4
Gyorr Ave, Unit 1005
South Elgin, IL 60177
|
- sq. feet
|
- baths - beds |
show details | |

|
#5
S Collins St Apt D
South Elgin, IL 60177
|
- sq. feet
|
- baths - beds |
show details | |

|
#6
Moraine Dr
South Elgin, IL 60177
|
- sq. feet
|
- baths - beds |
show details | |

|
#7
Gyorr Ave, Unit 402
South Elgin, IL 60177
|
- sq. feet
|
- baths - beds |
show details | |

|
#8
Hobart Dr Unit B
South Elgin, IL 60177
|
- sq. feet
|
- baths - beds |
show details | |

|
#9
Deer Pointe Dr
South Elgin, IL 60177
|
- sq. feet
|
- baths - beds |
show details | |

|
#10
Gyorr Ave, Unit 1217
South Elgin, IL 60177
|
- sq. feet
|
- baths - beds |
show details |
| Photo | Address | Area | Beds / Baths | Price | Details |
|---|---|---|---|---|---|

|
#11
S Mclean Blvd
South Elgin, IL 60177
|
- sq. feet
|
- baths - beds |
show details | |

|
#12
Fieldcrest Dr Unit C
South Elgin, IL 60177
|
- sq. feet
|
- baths - beds |
show details | |

|
#13
Windsor Ct Unit A
South Elgin, IL 60177
|
- sq. feet
|
- baths - beds |
show details | |

|
#14
Woodridge Cir Unit C
South Elgin, IL 60177
|
- sq. feet
|
- baths - beds |
show details | |

|
#15
N Gilbert St Apt 213
South Elgin, IL 60177
|
- sq. feet
|
- baths - beds |
show details | |

|
#16
Center Dr
South Elgin, IL 60177
|
- sq. feet
|
- baths - beds |
show details | |

|
#17
Ione Dr Unit B
South Elgin, IL 60177
|
- sq. feet
|
- baths - beds |
show details | |

|
#18
Gyorr Ave, Bldg 10
South Elgin, IL 60177
|
- sq. feet
|
- baths - beds |
show details | |

|
#19
Ashton Ct
South Elgin, IL 60177
|
- sq. feet
|
- baths - beds |
show details | |

|
#20
Hickory Ln
South Elgin, IL 60177
|
- sq. feet
|
- baths - beds |
show details |
| Photo | Address | Area | Beds / Baths | Price | Details |
|---|---|---|---|---|---|

|
#21
Castlebar Ct
South Elgin, IL 60177
|
- sq. feet
|
- baths - beds |
show details | |

|
#22
Manchester Ct
South Elgin, IL 60177
|
- sq. feet
|
- baths - beds |
show details | |

|
#23
Quarry St
South Elgin, IL 60177
|
- sq. feet
|
- baths - beds |
show details | |

|
#24
Sandhurst Ln
South Elgin, IL 60177
|
- sq. feet
|
- baths - beds |
show details | |

|
#25
Burke Ln
South Elgin, IL 60177
|
- sq. feet
|
- baths - beds |
show details | |

|
#26
Hancock Ave
South Elgin, IL 60177
|
- sq. feet
|
- baths - beds |
show details | |

|
#27
Marleigh Ln
South Elgin, IL 60177
|
- sq. feet
|
- baths - beds |
show details | |

|
#28
Timber Ln
South Elgin, IL 60177
|
- sq. feet
|
- baths - beds |
show details | |

|
#29
Millicent Ct
South Elgin, IL 60177
|
- sq. feet
|
- baths - beds |
show details | |

|
#30
Sandhurst Ln # D
South Elgin, IL 60177
|
- sq. feet
|
- baths - beds |
show details |
| Photo | Address | Area | Beds / Baths | Price | Details |
|---|---|---|---|---|---|

|
#31
Linden Ct
South Elgin, IL 60177
|
- sq. feet
|
- baths - beds |
show details | |

|
#32
Village Ct
South Elgin, IL 60177
|
- sq. feet
|
- baths - beds |
show details | |

|
#33
Holt Ln
South Elgin, IL 60177
|
- sq. feet
|
- baths - beds |
show details | |

|
#34
Lor Ann Dr
South Elgin, IL 60177
|
- sq. feet
|
- baths - beds |
show details | |

|
#35
Franklin Dr
South Elgin, IL 60177
|
- sq. feet
|
- baths - beds |
show details | |

|
#36
Kane St
South Elgin, IL 60177
|
- sq. feet
|
- baths - beds |
show details | |

|
#37
Dean Dr
South Elgin, IL 60177
|
- sq. feet
|
- baths - beds |
show details | |

|
#38
Chesterfield Ln
South Elgin, IL 60177
|
- sq. feet
|
- baths - beds |
show details | |

|
#39
Medford Ave
South Elgin, IL 60177
|
- sq. feet
|
- baths - beds |
show details | |

|
#40
E Middle St
South Elgin, IL 60177
|
- sq. feet
|
- baths - beds |
show details |
| Photo | Address | Area | Beds / Baths | Price | Details |
|---|---|---|---|---|---|

|
#41
Lincoln Ct
South Elgin, IL 60177
|
- sq. feet
|
- baths - beds |
show details | |

|
#42
N Gilbert St
South Elgin, IL 60177
|
- sq. feet
|
- baths - beds |
show details | |

|
#43
E Middle St
South Elgin, IL 60177
|
- sq. feet
|
- baths - beds |
show details | |

|
#44
Dean Dr
South Elgin, IL 60177
|
- sq. feet
|
- baths - beds |
show details | |

|
#45
Hartman Ct
South Elgin, IL 60177
|
- sq. feet
|
- baths - beds |
show details | |

|
#46
Hobart Dr
South Elgin, IL 60177
|
- sq. feet
|
- baths - beds |
show details | |

|
#47
W Harvard Cir
South Elgin, IL 60177
|
- sq. feet
|
- baths - beds |
show details | |

|
Check over 1 million property listings on Foreclosure.com!
|
browse all offers | |||


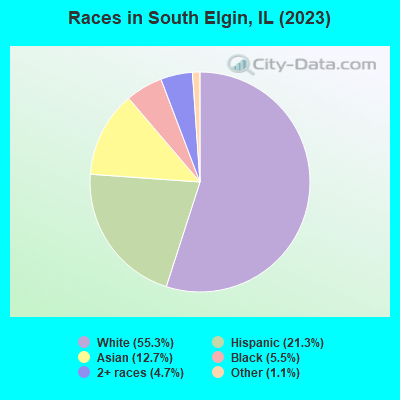
- 13,55757.2%White alone
- 5,70024.1%Hispanic
- 2,42610.2%Asian alone
- 1,1204.7%Black alone
- 7493.2%Two or more races
- 1300.5%Other race alone
Races in South Elgin detailed stats: ancestries, foreign born residents, place of birth
According to our research of Illinois and other state lists, there were 15 registered sex offenders living in South Elgin, Illinois as of May 19, 2024.
The ratio of all residents to sex offenders in South Elgin is 1,499 to 1.
The ratio of registered sex offenders to all residents in this city is lower than the state average.
Type |
2010 |
2011 |
2012 |
2013 |
2014 |
2015 |
2016 |
2017 |
2018 |
2019 |
2020 |
2021 |
2022 |
|---|---|---|---|---|---|---|---|---|---|---|---|---|---|
| Murders (per 100,000) | 0 (0.0) | 0 (0.0) | 0 (0.0) | 1 (4.5) | 0 (0.0) | 0 (0.0) | 0 (0.0) | 0 (0.0) | 0 (0.0) | 0 (0.0) | 0 (0.0) | 0 (0.0) | 0 (0.0) |
| Rapes (per 100,000) | 3 (13.6) | 1 (4.5) | 1 (4.5) | 3 (13.5) | 1 (4.5) | 0 (0.0) | 8 (35.7) | 9 (40.0) | 13 (57.5) | 4 (16.9) | 2 (8.0) | 3 (12.0) | 18 (75.0) |
| Robberies (per 100,000) | 1 (4.5) | 1 (4.5) | 3 (13.5) | 6 (26.9) | 2 (9.0) | 2 (9.0) | 3 (13.4) | 7 (31.1) | 3 (13.3) | 1 (4.2) | 0 (0.0) | 0 (0.0) | 1 (4.2) |
| Assaults (per 100,000) | 14 (63.7) | 15 (68.0) | 32 (144.1) | 20 (89.7) | 23 (103.4) | 16 (71.8) | 16 (71.3) | 14 (62.2) | 8 (35.4) | 11 (46.5) | 14 (55.8) | 0 (0.0) | 5 (20.8) |
| Burglaries (per 100,000) | 17 (77.3) | 33 (149.7) | 24 (108.1) | 18 (80.7) | 27 (121.4) | 18 (80.8) | 18 (80.2) | 22 (97.8) | 12 (53.0) | 12 (50.8) | 12 (47.8) | 0 (0.0) | 8 (33.3) |
| Thefts (per 100,000) | 228 (1,037) | 218 (988.6) | 291 (1,310) | 269 (1,207) | 207 (930.4) | 244 (1,095) | 239 (1,065) | 160 (711.0) | 85 (375.7) | 88 (372.3) | 63 (251.2) | 5 (20.1) | 98 (408.4) |
| Auto thefts (per 100,000) | 5 (22.7) | 7 (31.7) | 6 (27.0) | 6 (26.9) | 3 (13.5) | 2 (9.0) | 5 (22.3) | 2 (8.9) | 0 (0.0) | 4 (16.9) | 7 (27.9) | 1 (4.0) | 16 (66.7) |
| Arson (per 100,000) | 2 (9.1) | 1 (4.5) | 2 (9.0) | 1 (4.5) | 0 (0.0) | 0 (0.0) | 0 (0.0) | 2 (8.9) | 0 (0.0) | 1 (4.2) | 1 (4.0) | 0 (0.0) | 0 (0.0) |
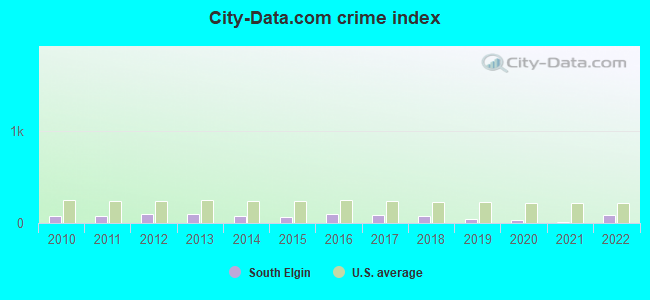
| City-Data.com crime index | 73.7 | 71.2 | 98.6 | 101.8 | 73.8 | 67.2 | 96.8 | 89.8 | 75.8 | 43.9 | 33.2 | 10.8 | 89.4 |
The City-Data.com crime index weighs serious crimes and violent crimes more heavily. Higher means more crime, U.S. average is 246.1. It adjusts for the number of visitors and daily workers commuting into cities.
Crime rate in South Elgin detailed stats: murders, rapes, robberies, assaults, burglaries, thefts, arson
Full-time law enforcement employees in 2020, including police officers: 39 (35 officers - 32 male; 3 female).
| Officers per 1,000 residents here: | 1.40 |
| Illinois average: | 3.04 |
 Recent articles from our blog. Our writers, many of them Ph.D. graduates or candidates, create easy-to-read articles on a wide variety of topics.

 | Suburb thoughts? South Elgin/Fox River Grove/Crystal Lake or somewhere else? (10 replies) |
| Moving to IL - is there any future? (202 replies) |
| top 3 areas to avoid in nw suburbs (84 replies) |
| Suburbs of Suburbs (32 replies) |
| Suburb for Retired Couple moving to Chicagoland (13 replies) |
| Living in Elgin? Pros & Cons (85 replies) |
Latest news from South Elgin, IL collected exclusively by city-data.com from local newspapers, TV, and radio stations
Ancestries: German (10.3%), Polish (6.6%), Italian (5.3%), American (4.4%), English (3.1%), Irish (2.9%).
Current Local Time: CST time zone
Incorporated on 08/03/1897
Elevation: 743 feet
Land area: 6.29 square miles.
Population density: 3,818 people per square mile (average).
3,331 residents are foreign born (6.1% Asia, 5.3% Latin America, 2.3% Europe).
| This village: | 14.1% |
| Illinois: | 14.1% |
Median real estate property taxes paid for housing units with mortgages in 2022: $6,973 (2.2%)
Median real estate property taxes paid for housing units with no mortgage in 2022: $5,300 (2.0%)
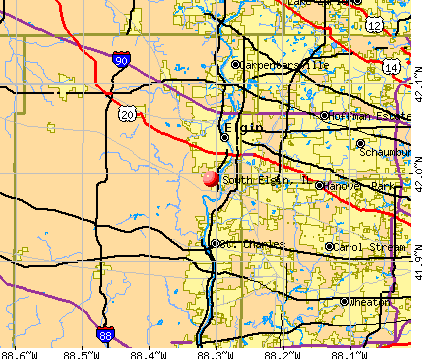
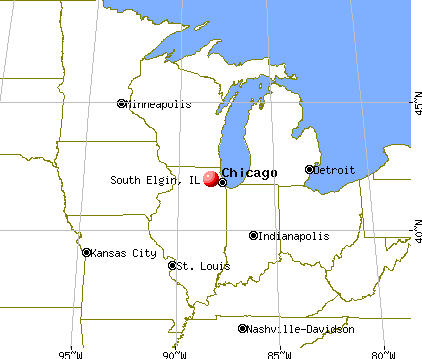
Nearest city with pop. 50,000+: Elgin, IL  (3.4 miles , pop. 94,487).
Nearest city with pop. 200,000+: Chicago, IL (34.0 miles , pop. 2,896,016).
Nearest cities:
), ), Latitude: 41.99 N, Longitude: 88.31 W
Daytime population change due to commuting: -2,937 (-12.4%)
Workers who live and work in this village: 2,810 (21.0%)
South Elgin, Illinois accommodation & food services, waste management - Economy and Business Data
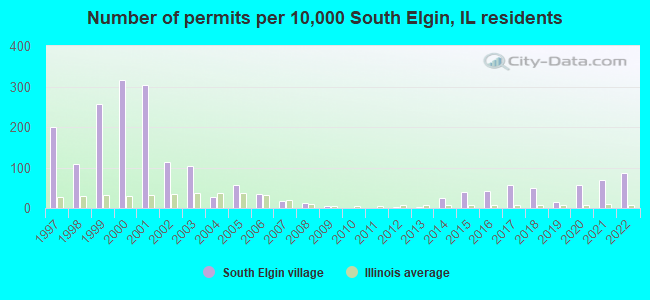
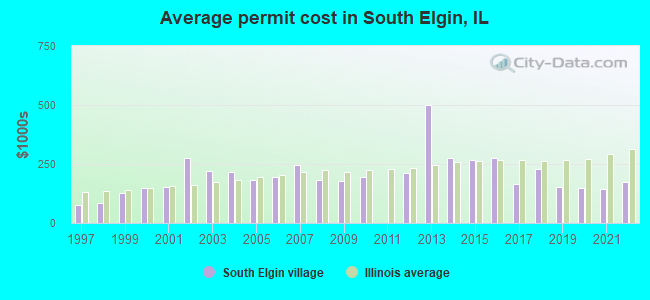
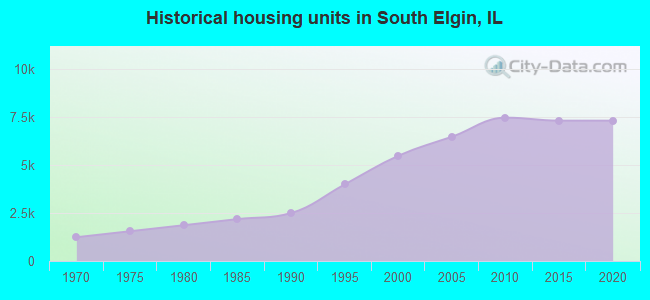
Single-family new house construction building permits:
- 2022: 139 buildings, average cost: $175,100
- 2021: 111 buildings, average cost: $145,600
- 2020: 90 buildings, average cost: $149,100
- 2019: 25 buildings, average cost: $152,600
- 2018: 79 buildings, average cost: $230,000
- 2017: 92 buildings, average cost: $164,300
- 2016: 69 buildings, average cost: $277,400
- 2015: 62 buildings, average cost: $265,600
- 2014: 40 buildings, average cost: $277,200
- 2013: 3 buildings, average cost: $498,300
- 2012: 5 buildings, average cost: $209,800
- 2010: 1 building, cost: $196,800
- 2009: 8 buildings, average cost: $178,100
- 2008: 20 buildings, average cost: $181,400
- 2007: 28 buildings, average cost: $243,900
- 2006: 55 buildings, average cost: $195,700
- 2005: 94 buildings, average cost: $181,900
- 2004: 43 buildings, average cost: $216,200
- 2003: 166 buildings, average cost: $220,200
- 2002: 184 buildings, average cost: $275,300
- 2001: 490 buildings, average cost: $154,100
- 2000: 509 buildings, average cost: $147,200
- 1999: 414 buildings, average cost: $127,800
- 1998: 175 buildings, average cost: $83,200
- 1997: 320 buildings, average cost: $75,000
| Here: | 5.2% |
| Illinois: | 4.2% |
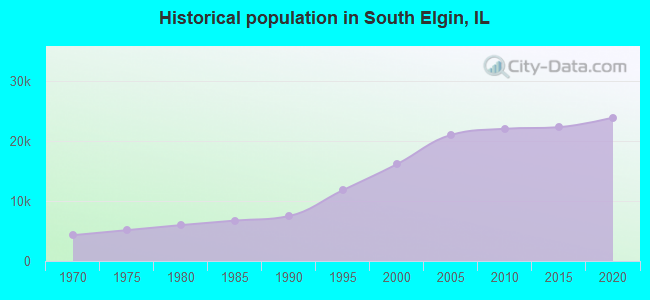
Population change in the 1990s: +8,447 (+110.4%).
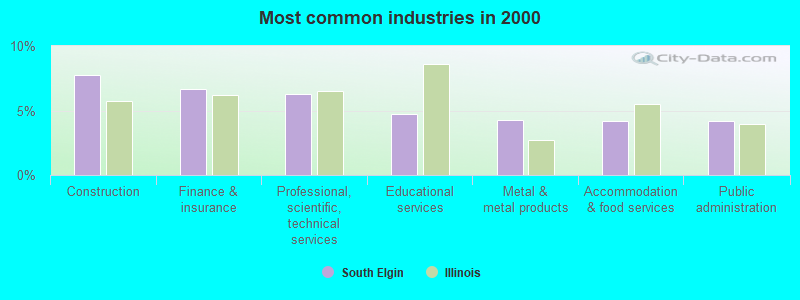
- Construction (7.8%)
- Finance & insurance (6.6%)
- Professional, scientific, technical services (6.3%)
- Educational services (4.7%)
- Metal & metal products (4.3%)
- Accommodation & food services (4.2%)
- Public administration (4.2%)
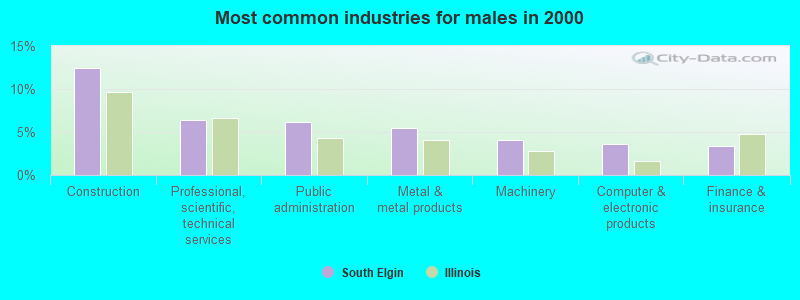
- Construction (12.4%)
- Professional, scientific, technical services (6.4%)
- Public administration (6.2%)
- Metal & metal products (5.5%)
- Machinery (4.0%)
- Computer & electronic products (3.6%)
- Finance & insurance (3.4%)
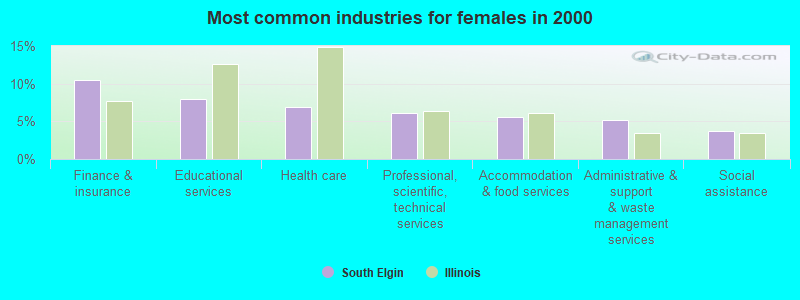
- Finance & insurance (10.5%)
- Educational services (8.0%)
- Health care (6.9%)
- Professional, scientific, technical services (6.1%)
- Accommodation & food services (5.6%)
- Administrative & support & waste management services (5.2%)
- Social assistance (3.8%)
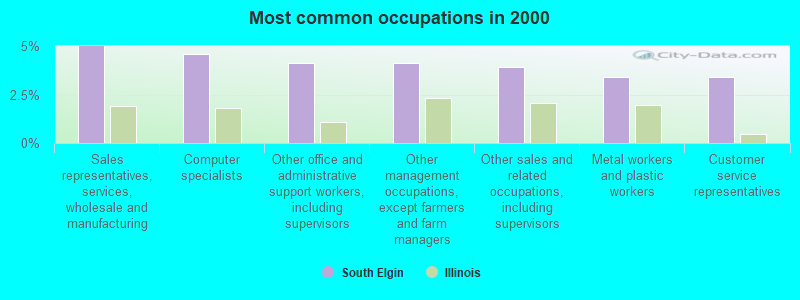
- Sales representatives, services, wholesale and manufacturing (5.0%)
- Computer specialists (4.6%)
- Other office and administrative support workers, including supervisors (4.1%)
- Other management occupations, except farmers and farm managers (4.1%)
- Other sales and related occupations, including supervisors (3.9%)
- Metal workers and plastic workers (3.4%)
- Customer service representatives (3.4%)
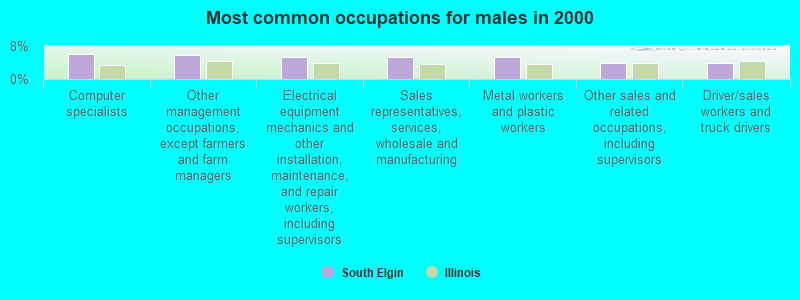
- Computer specialists (6.1%)
- Other management occupations, except farmers and farm managers (5.9%)
- Electrical equipment mechanics and other installation, maintenance, and repair workers, including supervisors (5.4%)
- Sales representatives, services, wholesale and manufacturing (5.4%)
- Metal workers and plastic workers (5.2%)
- Other sales and related occupations, including supervisors (3.9%)
- Driver/sales workers and truck drivers (3.8%)
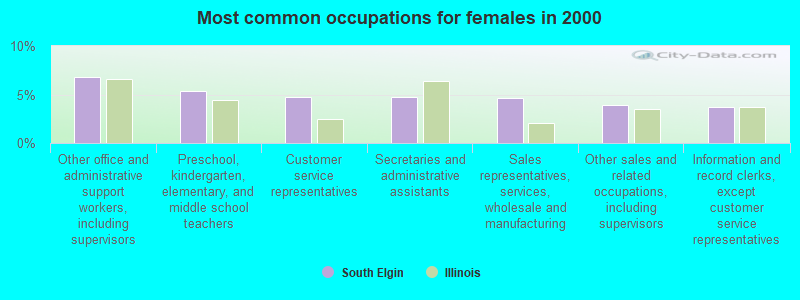
- Other office and administrative support workers, including supervisors (6.8%)
- Preschool, kindergarten, elementary, and middle school teachers (5.3%)
- Customer service representatives (4.7%)
- Secretaries and administrative assistants (4.7%)
- Sales representatives, services, wholesale and manufacturing (4.6%)
- Other sales and related occupations, including supervisors (3.9%)
- Information and record clerks, except customer service representatives (3.8%)
Average climate in South Elgin, Illinois
Based on data reported by over 4,000 weather stations


|
|

(lower is better)
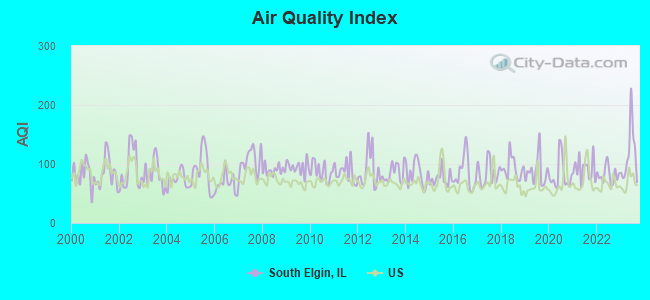
Air Quality Index (AQI) level in 2023 was 116. This is significantly worse than average.
| City: | 116 |
| U.S.: | 73 |
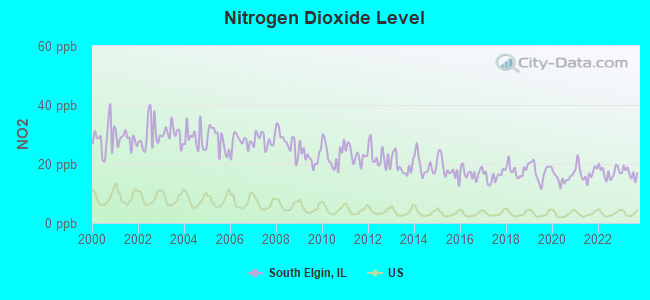
Nitrogen Dioxide (NO2) [ppb] level in 2023 was 16.9. This is significantly worse than average. Closest monitor was 9.1 miles away from the city center.
| City: | 16.9 |
| U.S.: | 5.1 |
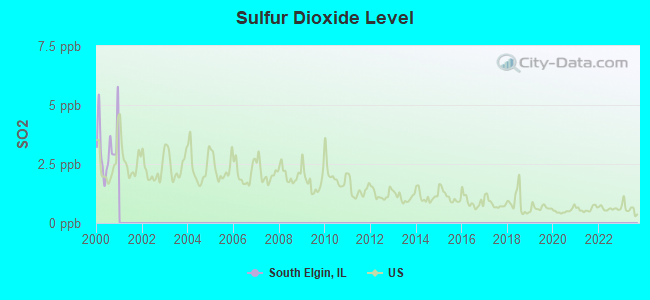
Sulfur Dioxide (SO2) [ppb] level in 2000 was 3.23. This is significantly worse than average. Closest monitor was 4.3 miles away from the city center.
| City: | 3.23 |
| U.S.: | 1.51 |
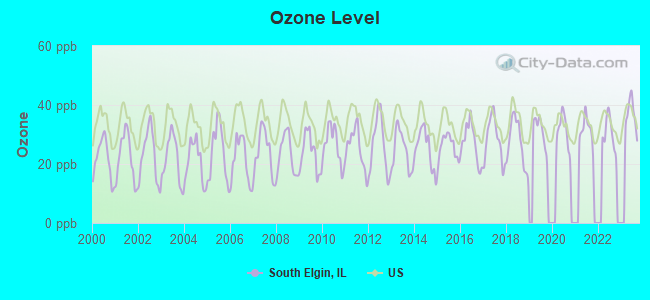
Ozone [ppb] level in 2023 was 36.7. This is about average. Closest monitor was 4.3 miles away from the city center.
| City: | 36.7 |
| U.S.: | 33.3 |
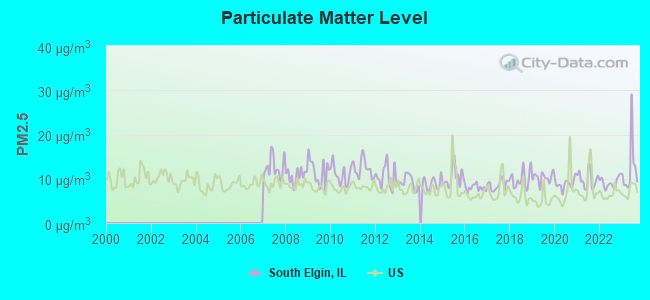
Particulate Matter (PM2.5) [µg/m3] level in 2023 was 12.2. This is significantly worse than average. Closest monitor was 4.3 miles away from the city center.
| City: | 12.2 |
| U.S.: | 8.1 |
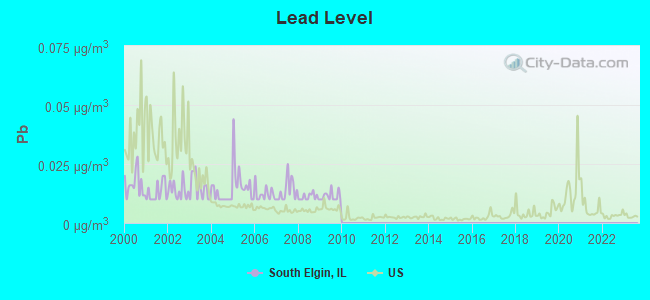
Lead (Pb) [µg/m3] level in 2009 was 0.0114. This is worse than average. Closest monitor was 3.5 miles away from the city center.
| City: | 0.0114 |
| U.S.: | 0.0093 |
Tornado activity:
South Elgin-area historical tornado activity is slightly below Illinois state average. It is 45% greater than the overall U.S. average.
On 8/28/1990, a category F5 (max. wind speeds 261-318 mph) tornado 21.7 miles away from the South Elgin village center killed 29 people and injured 350 people and caused between $50,000 and $500,000 in damages.
On 4/21/1967, a category F4 (max. wind speeds 207-260 mph) tornado 11.1 miles away from the village center killed one person and injured 100 people and caused between $500,000 and $5,000,000 in damages.
Earthquake activity:
South Elgin-area historical earthquake activity is significantly above Illinois state average. It is 47% greater than the overall U.S. average.On 4/18/2008 at 09:36:59, a magnitude 5.4 (5.1 MB, 4.8 MS, 5.4 MW, 5.2 MW, Class: Moderate, Intensity: VI - VII) earthquake occurred 245.9 miles away from South Elgin center
On 6/10/1987 at 23:48:54, a magnitude 5.1 (4.9 MB, 4.4 MS, 4.6 MS, 5.1 LG) earthquake occurred 220.5 miles away from the city center
On 4/18/2008 at 09:36:59, a magnitude 5.2 (5.2 MW, Depth: 8.9 mi) earthquake occurred 245.9 miles away from the city center
On 6/28/2004 at 06:10:52, a magnitude 4.2 (4.2 MW, Depth: 6.2 mi, Class: Light, Intensity: IV - V) earthquake occurred 47.9 miles away from South Elgin center
On 2/10/2010 at 09:59:35, a magnitude 3.8 (3.8 MW, Depth: 6.2 mi, Class: Light, Intensity: II - III) earthquake occurred 9.9 miles away from the city center
On 6/18/2002 at 17:37:15, a magnitude 5.0 (4.3 MB, 4.6 MW, 5.0 LG) earthquake occurred 278.4 miles away from South Elgin center
Magnitude types: regional Lg-wave magnitude (LG), body-wave magnitude (MB), surface-wave magnitude (MS), moment magnitude (MW)
Natural disasters:
The number of natural disasters in Kane County (15) is near the US average (15).Major Disasters (Presidential) Declared: 10
Emergencies Declared: 4
Causes of natural disasters: Floods: 7, Storms: 7, Snowstorms: 2, Tornadoes: 2, Winter Storms: 2, Blizzard: 1, Hurricane: 1, Snow: 1, Wind: 1, Other: 1 (Note: some incidents may be assigned to more than one category).

Hospitals and medical centers in South Elgin:
located in South Elgin:
Colleges/universities with over 2000 students nearest to South Elgin:
- Elgin Community College (about 2 miles; Elgin, IL; Full-time enrollment: 8,173)
- Universal Technical Institute of Illinois Inc (about 13 miles; Glendale Heights, IL; FT enrollment: 2,281)
- Harper College (about 14 miles; Palatine, IL; FT enrollment: 10,800)
- Wheaton College (about 14 miles; Wheaton, IL; FT enrollment: 2,948)
- Chamberlain College of Nursing-Illinois (about 15 miles; Addison, IL; FT enrollment: 8,977)
- American InterContinental University-Online (about 15 miles; Schaumburg, IL; FT enrollment: 16,158)
- Waubonsee Community College (about 16 miles; Sugar Grove, IL; FT enrollment: 7,698)
Public high school in South Elgin:
- SOUTH ELGIN HIGH SCHOOL (Students: 2,157, Location: 760 E MAIN ST, Grades: 9-12)
Public elementary/middle schools in South Elgin:
- KENYON WOODS MIDDLE SCHOOL (Students: 976, Location: 1515 RAYMOND ST, Grades: 7-8)
- FOX MEADOW ELEMENTARY SCHOOL (Students: 798, Location: 1275 JENNA DR, Grades: KG-6)
- CORRON ELEMENTARY SCHOOL (Students: 592, Location: 455 THORNWOOD WAY, Grades: KG-5)
- CLINTON ELEM SCHOOL (Location: 770 MILL ST, Grades: KG-6)
- WILLARD ELEM SCHOOL (Location: 370 W SPRING ST, Grades: KG-6)
Points of interest:
Notable locations in South Elgin: South Elgin and Countryside Fire Protection District Station 2 (A), South Elgin and Countryside Fire Protection District Station 1 (B). Display/hide their locations on the map
Churches in South Elgin include: Community Center Church of God (A), Kane County Baptist Church (B), South Elgin Community United Church (C). Display/hide their locations on the map
Creek: Stony Creek (A). Display/hide its location on the map
Parks in South Elgin include: Concord Park (1), Robert Sperry Park (2), Lions Park (3), Panton Mill Park (4), Pickeral Park (5), Seba Park (6). Display/hide their locations on the map
| This village: | 3.0 people |
| Illinois: | 2.6 people |
| This village: | 78.0% |
| Whole state: | 65.8% |
| This village: | 5.7% |
| Whole state: | 6.3% |
Likely homosexual households (counted as self-reported same-sex unmarried-partner households)
- Lesbian couples: 0.3% of all households
- Gay men: 0.2% of all households
5 people in workers' group living quarters and job corps centers in 2010
215 people in nursing homes in 2000
18 people in agriculture workers' dormitories on farms in 2000
Banks with most branches in South Elgin (2011 data):
- JPMorgan Chase Bank, National Association: South Elgin Caputos Banking Center B at 622 Randall Rd, branch established on 2008/09/17; South Elgin Randall Road Banking Cen at 536 Randall Road, branch established on 2011/10/11. Info updated 2011/11/10: Bank assets: $1,811,678.0 mil, Deposits: $1,190,738.0 mil, headquarters in Columbus, OH, positive income, International Specialization, 5577 total offices, Holding Company: Jpmorgan Chase & Co.
- West Suburban Bank: South Elgin Branch at 1870 Mcdonald Road, branch established on 2001/12/31. Info updated 2011/02/23: Bank assets: $1,927.7 mil, Deposits: $1,744.7 mil, headquarters in Lombard, IL, positive income, Commercial Lending Specialization, 44 total offices, Holding Company: West Suburban Bancorp, Inc.
- Fifth Third Bank: South Elgin Banking Center at 460 S. Randall Road, branch established on 2004/01/12. Info updated 2009/10/05: Bank assets: $114,540.4 mil, Deposits: $89,689.1 mil, headquarters in Cincinnati, OH, positive income, Commercial Lending Specialization, 1378 total offices, Holding Company: Fifth Third Bancorp
- Bank of America, National Association: South Elgin-Randall & Silver Glen Ro at 534 Randall Road, branch established on 2006/08/15. Info updated 2009/11/18: Bank assets: $1,451,969.3 mil, Deposits: $1,077,176.8 mil, headquarters in Charlotte, NC, positive income, 5782 total offices, Holding Company: Bank Of America Corporation
- TCF National Bank: South Elgin Jewel Branch #2309 at 375 Randall Road, branch established on 2000/01/27. Info updated 2009/11/23: Bank assets: $19,007.0 mil, Deposits: $12,377.0 mil, headquarters in Sioux Falls, SD, positive income, Commercial Lending Specialization, 441 total offices, Holding Company: Tcf Financial Corporation
- State Bank of Illinois: South Elgin/Foxdale Branch at 1140 West Spring Street, branch established on 1995/06/27. Info updated 2006/11/03: Bank assets: $185.5 mil, Deposits: $166.7 mil, headquarters in West Chicago, IL, negative income in the last year, Commercial Lending Specialization, 4 total offices, Holding Company: F.N.b.c. Of La Grange, Inc.
- BMO Harris Bank National Association: Thornwood Branch at 473 North Redington, branch established on 2003/09/26. Info updated 2011/07/14: Bank assets: $97,264.0 mil, Deposits: $75,624.6 mil, headquarters in Chicago, IL, positive income, 717 total offices, Holding Company: Bank Of Montreal
- Associated Bank, National Association: South Elgin Branch at 300 North Mclean Boulevard, branch established on 1883/01/01. Info updated 2008/09/12: Bank assets: $21,715.0 mil, Deposits: $15,244.4 mil, headquarters in Green Bay, WI, positive income, Commercial Lending Specialization, 282 total offices, Holding Company: Associated Banc-Corp
- American Eagle Bank: at 556 Randall Road, branch established on 2002/10/17. Info updated 2006/11/03: Bank assets: $158.2 mil, Deposits: $131.8 mil, local headquarters, positive income, Consumer Lending Specialization, 1 total offices, Holding Company: Orchid Financial Bancorp, Inc.
For population 15 years and over in South Elgin:
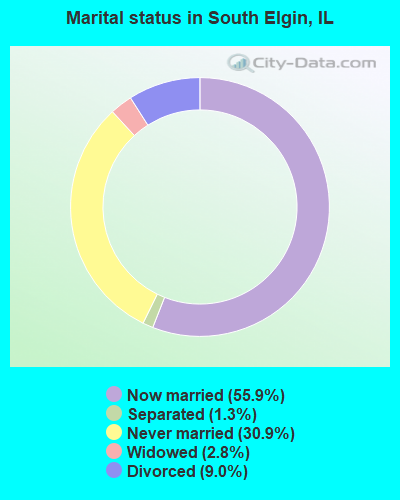
- Never married: 30.9%
- Now married: 55.9%
- Separated: 1.3%
- Widowed: 2.8%
- Divorced: 9.0%
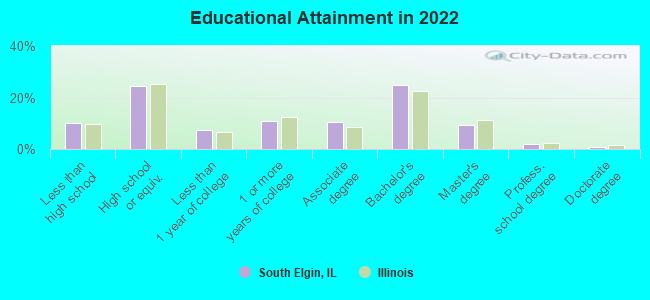
For population 25 years and over in South Elgin:
- High school or higher: 89.1%
- Bachelor's degree or higher: 37.1%
- Graduate or professional degree: 13.1%
- Unemployed: 2.9%
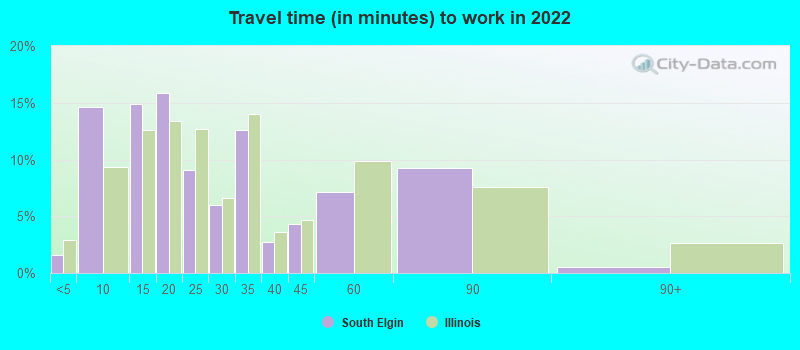
- Mean travel time to work (commute): 24.6 minutes
| Here: | 13.0 |
| Illinois average: | 12.5 |
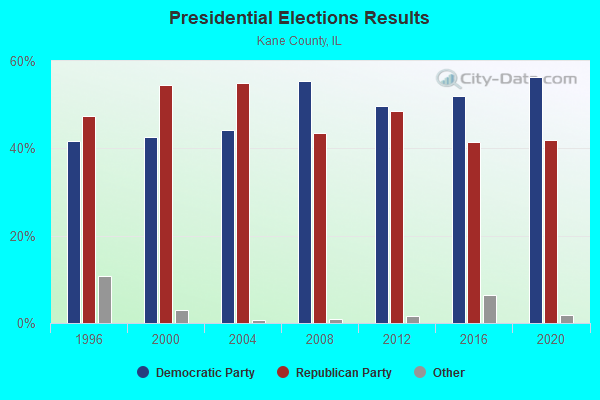
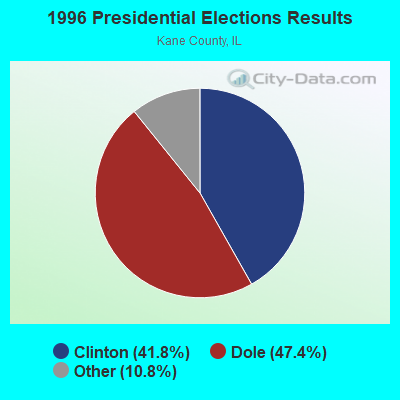
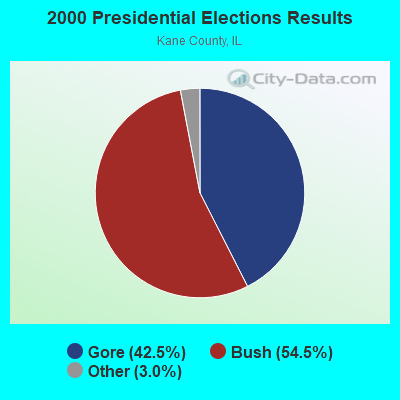
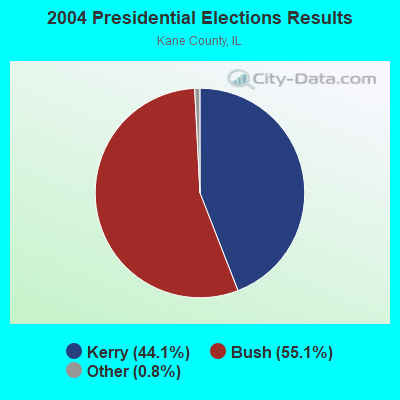
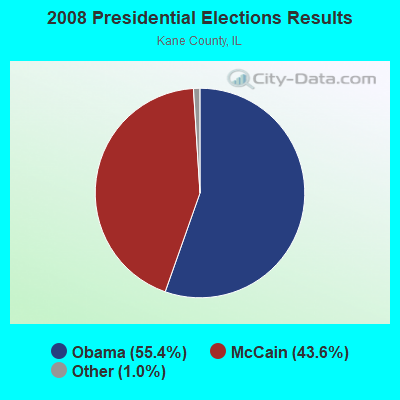
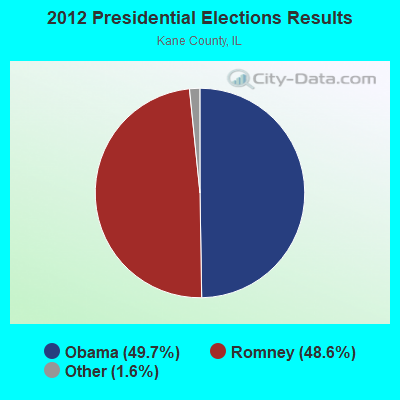

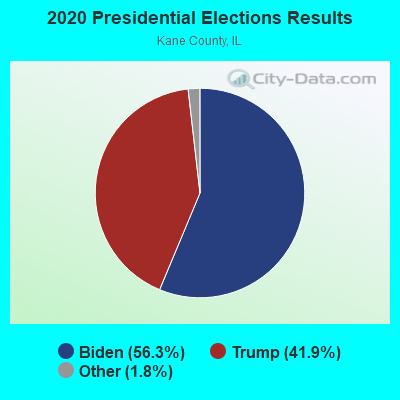
Graphs represent county-level data. Detailed 2008 Election Results
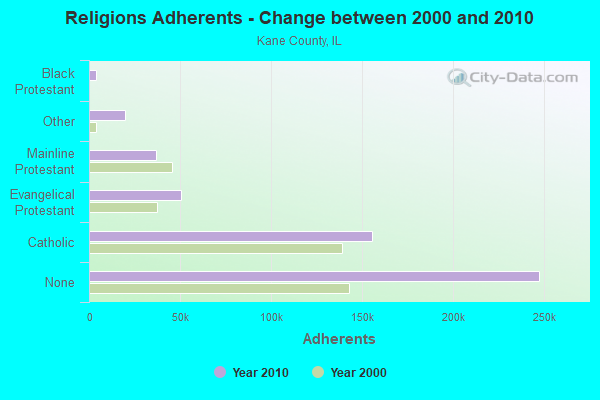
Religion statistics for South Elgin, IL (based on Kane County data)
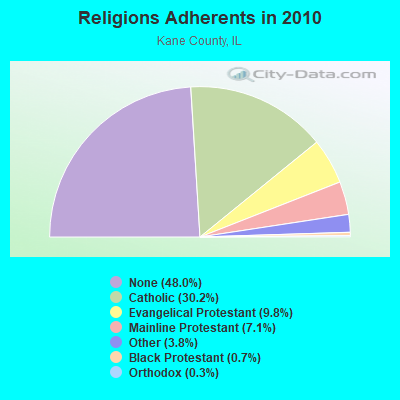
| Religion | Adherents | Congregations |
|---|---|---|
| Catholic | 155,391 | 28 |
| Evangelical Protestant | 50,728 | 184 |
| Mainline Protestant | 36,576 | 72 |
| Other | 19,744 | 30 |
| Black Protestant | 3,679 | 10 |
| Orthodox | 1,630 | 2 |
| None | 247,521 | - |
Food Environment Statistics:
| Kane County: | 1.61 / 10,000 pop. |
| State: | 2.24 / 10,000 pop. |
| This county: | 0.08 / 10,000 pop. |
| State: | 0.08 / 10,000 pop. |
| Kane County: | 0.54 / 10,000 pop. |
| Illinois: | 0.75 / 10,000 pop. |
| Here: | 1.95 / 10,000 pop. |
| State: | 2.61 / 10,000 pop. |
| This county: | 5.90 / 10,000 pop. |
| Illinois: | 6.86 / 10,000 pop. |
| Here: | 7.2% |
| Illinois: | 8.3% |
| Kane County: | 27.2% |
| Illinois: | 25.2% |
| This county: | 15.1% |
| Illinois: | 14.5% |
Health and Nutrition:
| This city: | 48.7% |
| Illinois: | 49.5% |
| South Elgin: | 46.5% |
| State: | 47.2% |
| South Elgin: | 28.4 |
| Illinois: | 28.6 |
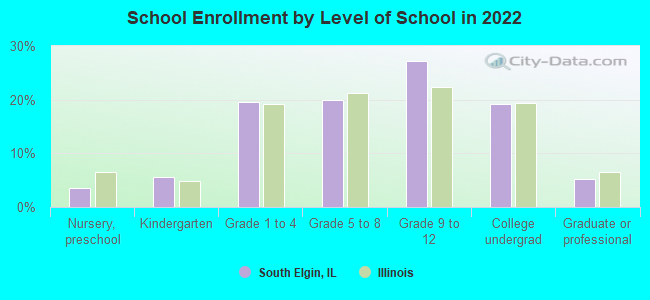
| South Elgin: | 21.1% |
| Illinois: | 20.5% |
| South Elgin: | 9.8% |
| State: | 10.8% |
| Here: | 6.8 |
| Illinois: | 6.8 |
| This city: | 31.4% |
| State: | 33.4% |
| South Elgin: | 57.7% |
| Illinois: | 56.4% |
| South Elgin: | 81.7% |
| Illinois: | 79.9% |
More about Health and Nutrition of South Elgin, IL Residents
| Local government employment and payroll (March 2022) | |||||
| Function | Full-time employees | Monthly full-time payroll | Average yearly full-time wage | Part-time employees | Monthly part-time payroll |
|---|---|---|---|---|---|
| Police Protection - Officers | 32 | $289,486 | $108,557 | 0 | $0 |
| Water Supply | 11 | $82,779 | $90,304 | 0 | $0 |
| Financial Administration | 9 | $64,207 | $85,609 | 0 | $0 |
| Other Government Administration | 8 | $64,342 | $96,513 | 14 | $9,800 |
| Streets and Highways | 8 | $48,611 | $72,917 | 0 | $0 |
| Other and Unallocable | 6 | $38,819 | $77,638 | 0 | $0 |
| Parks and Recreation | 6 | $42,785 | $85,570 | 13 | $13,122 |
| Police - Other | 4 | $21,917 | $65,751 | 3 | $2,873 |
| Totals for Government | 84 | $652,947 | $93,278 | 30 | $25,795 |
South Elgin government finances - Expenditure in 2017 (per resident):
- Current Operations - Police Protection: $6,663,000 ($277.54)
Water Utilities: $2,653,000 ($110.51)
Solid Waste Management: $1,896,000 ($78.98)
Parks and Recreation: $1,730,000 ($72.06)
Regular Highways: $1,615,000 ($67.27)
General - Other: $1,344,000 ($55.98)
Central Staff Services: $1,047,000 ($43.61)
Financial Administration: $891,000 ($37.11)
- General - Interest on Debt: $1,206,000 ($50.24)
- Other Capital Outlay - Central Staff Services: $8,005,000 ($333.44)
Water Utilities: $933,000 ($38.86)
- Total Salaries and Wages: $7,186,000 ($299.33)
South Elgin government finances - Revenue in 2017 (per resident):
- Charges - Solid Waste Management: $2,011,000 ($83.77)
Other: $629,000 ($26.20)
Parks and Recreation: $470,000 ($19.58)
- Local Intergovernmental - Other: $1,238,000 ($51.57)
- Miscellaneous - General Revenue - Other: $1,089,000 ($45.36)
Interest Earnings: $261,000 ($10.87)
Fines and Forfeits: $143,000 ($5.96)
- Revenue - Water Utilities: $6,296,000 ($262.26)
- State Intergovernmental - General Local Government Support: $6,396,000 ($266.42)
Highways: $588,000 ($24.49)
- Tax - Property: $4,527,000 ($188.57)
General Sales and Gross Receipts: $1,522,000 ($63.40)
Other License: $952,000 ($39.66)
Public Utilities Sales: $920,000 ($38.32)
Other Selective Sales: $544,000 ($22.66)
South Elgin government finances - Debt in 2017 (per resident):
- Long Term Debt - Beginning Outstanding - Unspecified Public Purpose: $30,000,000 ($1249.64)
Outstanding Unspecified Public Purpose: $28,760,000 ($1197.98)
Retired Unspecified Public Purpose: $22,120,000 ($921.40)
Issue, Unspecified Public Purpose: $20,880,000 ($869.75)
South Elgin government finances - Cash and Securities in 2017 (per resident):
- Other Funds - Cash and Securities: $30,906,000 ($1287.37)
7.35% of this county's 2020 resident taxpayers moved to other counties in 2021 ($81,683 average adjusted gross income)
| Here: | 7.35% |
| Illinois average: | 6.10% |
0.01% of residents moved to foreign countries ($73 average AGI)
Kane County: 0.01% Illinois average: 0.01%
Top counties to which taxpayers relocated from this county between 2020 and 2021:
| to Cook County, IL | |
| to DuPage County, IL | |
| to McHenry County, IL |
| Businesses in South Elgin, IL | ||||
| Name | Count | Name | Count | |
|---|---|---|---|---|
| 7-Eleven | 1 | LensCrafters | 1 | |
| AT&T | 1 | MasterBrand Cabinets | 6 | |
| Ace Hardware | 1 | McDonald's | 2 | |
| Advance Auto Parts | 1 | Outback | 1 | |
| AutoZone | 1 | Outback Steakhouse | 1 | |
| Buffalo Wild Wings | 1 | Panda Express | 1 | |
| Burger King | 1 | Panera Bread | 1 | |
| CVS | 1 | PetSmart | 1 | |
| Chipotle | 1 | Pier 1 Imports | 1 | |
| Cold Stone Creamery | 1 | RadioShack | 1 | |
| Dairy Queen | 1 | Red Robin | 1 | |
| Domino's Pizza | 1 | Sears | 1 | |
| Dunkin Donuts | 1 | Sprint Nextel | 1 | |
| Famous Footwear | 1 | Staples | 1 | |
| FedEx | 4 | Starbucks | 2 | |
| GNC | 1 | T-Mobile | 3 | |
| Home Depot | 1 | Taco Bell | 1 | |
| Jewel-Osco | 1 | Target | 1 | |
| Jimmy John's | 1 | U.S. Cellular | 1 | |
| Kohl's | 1 | UPS | 3 | |
| LA Fitness | 1 | Verizon Wireless | 1 | |
| La-Z-Boy | 1 | |||
Strongest AM radio stations in South Elgin:
- WRMN (1410 AM; 1 kW; ELGIN, IL; Owner: ELGIN BROADCASTING CO., INC.)
- WSCR (670 AM; 50 kW; CHICAGO, IL; Owner: INFINITY BROADCASTING OPERATIONS, INC.)
- WGN (720 AM; 50 kW; CHICAGO, IL; Owner: WGN CONTINENTAL BROADCASTING CO.)
- WBBM (780 AM; 50 kW; CHICAGO, IL; Owner: INFINITY BROADCASTING OPERATIONS, INC.)
- WMVP (1000 AM; 50 kW; CHICAGO, IL; Owner: ABC, INC.)
- WYLL (1160 AM; 50 kW; CHICAGO, IL; Owner: SCA LICENSE CORPORATION)
- WLS (890 AM; 50 kW; CHICAGO, IL; Owner: WLS, INC.)
- WTMJ (620 AM; 50 kW; MILWAUKEE, WI; Owner: JOURNAL BROADCAST CORPORATION)
- WSPY (1480 AM; 1 kW; GENEVA, IL)
- WMBI (1110 AM; daytime; 5 kW; CHICAGO, IL; Owner: THE MOODY BIBLE INSTITUTE OF CHICAGO)
- WISN (1130 AM; 50 kW; MILWAUKEE, WI; Owner: CAPSTAR TX LIMITED PARTNERSHIP)
- WNVR (1030 AM; 5 kW; VERNON HILLS, IL; Owner: POLNET COMMUNICATIONS, LTD.)
- WVIV (1200 AM; 20 kW; CHICAGO, IL; Owner: WLXX-AM LICENSE CORP.)
Strongest FM radio stations in South Elgin:
- WJKL (94.3 FM; ELGIN, IL; Owner: ELGIN BROADCASTING CO., INC.)
- WZCH (103.9 FM; DUNDEE, IL; Owner: ENTRAVISION HOLDINGS, LLC)
- WLEY-FM (107.9 FM; AURORA, IL; Owner: WLEY LICENSING, INC.)
- WCKG (105.9 FM; ELMWOOD PARK, IL; Owner: INFINITY HOLDINGS CORPORATION OF ORLANDO)
- WLIT-FM (93.9 FM; CHICAGO, IL; Owner: AMFM RADIO LICENSES, L.L.C.)
- WJMK (104.3 FM; CHICAGO, IL; Owner: INFINITY BROADCASTING CORP. OF ILLINOIS)
- WNUA (95.5 FM; CHICAGO, IL; Owner: AMFM RADIO LICENSES, L.L.C.)
- WTMX (101.9 FM; SKOKIE, IL; Owner: BONNEVILLE HOLDING COMPANY)
- WGCI-FM (107.5 FM; CHICAGO, IL; Owner: AMFM RADIO LICENSES, L.L.C.)
- WBBM-FM (96.3 FM; CHICAGO, IL; Owner: INFINITY BROADCASTING OPERATIONS, INC.)
- WKSC-FM (103.5 FM; CHICAGO, IL; Owner: AMFM RADIO LICENSES, L.L.C.)
- WFMT (98.7 FM; CHICAGO, IL; Owner: WINDOW TO THE WORLD COMMUNICATIONS)
- WZZN (94.7 FM; CHICAGO, IL; Owner: ABC CHICAGO FM RADIO,INC.)
- WERV-FM (95.9 FM; AURORA, IL; Owner: NM LICENSING, LLC)
- WBEZ (91.5 FM; CHICAGO, IL; Owner: THE WBEZ ALLIANCE, INC.)
- WKQX (101.1 FM; CHICAGO, IL; Owner: EMMIS RADIO LICENSE CORPORATION)
- WLUP-FM (97.9 FM; CHICAGO, IL; Owner: BONNEVILLE HOLDING COMPANY)
- WNND (100.3 FM; CHICAGO, IL; Owner: BONNEVILLE HOLDING COMPANY)
- WOJO (105.1 FM; EVANSTON, IL; Owner: TICHENOR LICENSE CORPORATION ("TLC"))
- WUSN (99.5 FM; CHICAGO, IL; Owner: INFINITY BROADCASTING CORPORATION OF CHICAGO)
TV broadcast stations around South Elgin:
- W57DN (Channel 57; ELGIN, IL; Owner: TRINITY BROADCASTING NETWORK)
- W34CK (Channel 34; ARLINGTON HEIGHTS, IL; Owner: FIRST UNITED, INC.)
- WLS-TV (Channel 7; CHICAGO, IL; Owner: WLS TELEVISION, INC.)
- WMAQ-TV (Channel 5; CHICAGO, IL; Owner: NBC SUBSIDIARY (WMAQ-TV), INC.)
- WTTW (Channel 11; CHICAGO, IL; Owner: WINDOW TO THE WORLD COMMUNICATIONS, INC.)
- WGN-TV (Channel 9; CHICAGO, IL; Owner: WGN CONTINENTAL BROADCASTING COMPANY)
- WGBO-TV (Channel 66; JOLIET, IL; Owner: WGBO LICENSE PARTNERSHIP, G.P.)
- WBBM-TV (Channel 2; CHICAGO, IL; Owner: CBS BROADCASTING INC.)
- WPWR-TV (Channel 50; GARY, IN; Owner: FOX TELEVISION STATIONS, INC.)
- WXFT (Channel 60; AURORA, IL; Owner: TELEFUTURA CHICAGO LLC)
- W24AJ (Channel 24; AURORA, IL; Owner: NELSON TV, INC.)
- WCIU-TV (Channel 26; CHICAGO, IL; Owner: WCIU-TV LIMITED PARTNERSHIP)
- WCPX (Channel 38; CHICAGO, IL; Owner: PAXSON CHICAGO LICENSE, INC.)
- WFLD (Channel 32; CHICAGO, IL; Owner: FOX TELEVISION STATIONS, INC.)
- W68DO (Channel 68; PALATINE, IL; Owner: TRINITY BROADCASTING NETWORK)
- WFBT-CA (Channel 23; CHICAGO, IL; Owner: CHANNEL 23 LIMITED PARTNERSHIP)
- WSNS-TV (Channel 44; CHICAGO, IL; Owner: TELEMUNDO OF CHICAGO, INC.)
- WJYS (Channel 62; HAMMOND, IN; Owner: JOVON BROADCASTING CORPORATION)
- W64CQ (Channel 64; ARLINGTON HEIGHTS, IL; Owner: TRINITY BROADCASTING NETWORK)
- WOCH-LP (Channel 28; CHICAGO, IL; Owner: KM LPTV OF CHICAGO-28, L.L.C.)
- WYCC (Channel 20; CHICAGO, IL; Owner: COLLEGE DIST. #508, COUNTY OF COOK)
- WOCK-CA (Channel 13; CHICAGO, IL; Owner: KM LPTV OF CHICAGO-13, L.L.C.)
- WSPY-LP (Channel 30; PLANO, IL; Owner: WSPY-TV, INC.)
- W54BE (Channel 54; SUGAR GROVE, IL; Owner: WAUBONSEE COMMUNITY COLLEGE)
- National Bridge Inventory (NBI) Statistics
- 19Number of bridges
- 262ft / 80.5mTotal length
- $1,104,000Total costs
- 163,700Total average daily traffic
- 10,843Total average daily truck traffic
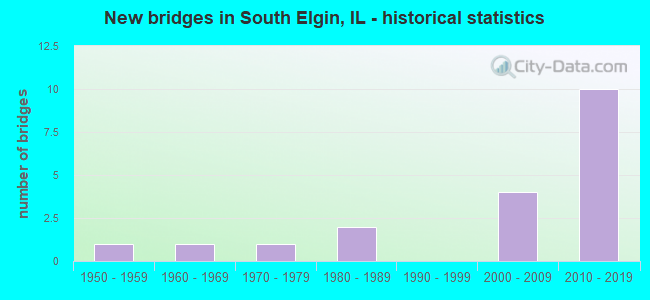
- New bridges - historical statistics
- 11950-1959
- 11960-1969
- 11970-1979
- 21980-1989
- 42000-2009
- 102010-2019
FCC Registered Antenna Towers:
67 (See the full list of FCC Registered Antenna Towers in South Elgin)FCC Registered Broadcast Land Mobile Towers:
12 (See the full list of FCC Registered Broadcast Land Mobile Towers in South Elgin, IL)FCC Registered Microwave Towers:
12 (See the full list of FCC Registered Microwave Towers in this town)FCC Registered Amateur Radio Licenses:
67 (See the full list of FCC Registered Amateur Radio Licenses in South Elgin)FAA Registered Aircraft:
7- Aircraft: WACO YQC-6 (Category: Land, Seats: 5, Weight: Up to 12,499 Pounds), Engine: JACOBS L4 /R755-7 (245 HP) (Reciprocating)
N-Number: 16212, N16212, N-16212, Serial Number: 4402, Year manufactured: 1936, Airworthiness Date: 08/07/1958, Certificate Issue Date: 03/01/2019
Registrant (Corporation): Vintage Aircraft Tours Inc, 571 W Thornwood Dr, South Elgin, IL 60177 - Aircraft: CESSNA 140 (Category: Land, Seats: 2, Weight: Up to 12,499 Pounds, Speed: 105 mph), Engine: CONT MOTOR C85 SERIES (85 HP) (Reciprocating)
N-Number: 347CR, N347CR, N-347CR, Serial Number: 9635, Year manufactured: 1946, Airworthiness Date: 09/02/1955, Certificate Issue Date: 01/27/2015
Registrant (Individual): Joseph W Kloke, 7n077 Kearns Rd, South Elgin, IL 60177 - Aircraft: PIPER PA-28-161 (Category: Land, Seats: 4, Weight: Up to 12,499 Pounds, Speed: 108 mph), Engine: LYCOMING 0-320 SERIES (180 HP) (Reciprocating)
N-Number: 38968, N38968, N-38968, Serial Number: 28-7716300, Year manufactured: 1977, Airworthiness Date: 07/27/1977, Certificate Issue Date: 08/10/1998
Registrant (Corporation): Vagabond Flying Association, 1011 N Lancaster Cir, South Elgin, IL 60177 - Aircraft: WACO UPF-7 (Category: Land, Seats: 2, Weight: Up to 12,499 Pounds, Speed: 165 mph), Engine: CONT MOTOR W670 SERIES (250 HP) (Reciprocating)
N-Number: 39734, N39734, N-39734, Serial Number: 5867, Airworthiness Date: 07/25/1955, Certificate Issue Date: 05/15/2018
Registrant (Corporation): Vintage Aircraft Tours Inc, 571 W Thornwood Dr, South Elgin, IL 60177 - Aircraft: PIPER PA-28R-201 (Category: Land, Seats: 4, Weight: Up to 12,499 Pounds, Speed: 108 mph), Engine: LYCOMING I0360 SER A&C (200 HP) (Reciprocating)
N-Number: 531PU, N531PU, N-531PU, Serial Number: 2837039, Year manufactured: 1989, Airworthiness Date: 09/29/1989, Certificate Issue Date: 09/27/2010
Registrant (Individual): Keith Chrastka, 420 Earl Ln, South Elgin, IL 60177 - Aircraft: CESSNA 172N (Category: Land, Seats: 4, Weight: Up to 12,499 Pounds, Speed: 105 mph), Engine: LYCOMING 0-320 SERIES (180 HP) (Reciprocating)
N-Number: 6163F, N6163F, N-6163F, Serial Number: 17273157, Year manufactured: 1979, Airworthiness Date: 08/22/1979, Certificate Issue Date: 10/02/1998
Registrant (Corporation): Vagabond Flying Association, 1011 N Lancaster Cir, South Elgin, IL 60177 - Aircraft: PIPER J3C-65 (Category: Land, Seats: 2, Weight: Up to 12,499 Pounds, Speed: 67 mph), Engine: CONT MOTOR A&C65 SERIES (65 HP) (Reciprocating)
N-Number: 7416H, N7416H, N-7416H, Serial Number: 20678, Year manufactured: 1946, Airworthiness Date: 09/23/1955, Certificate Issue Date: 03/16/2012
Registrant (Individual): Joseph W Kloke, 7n077 Kearns Rd, South Elgin, IL 60177
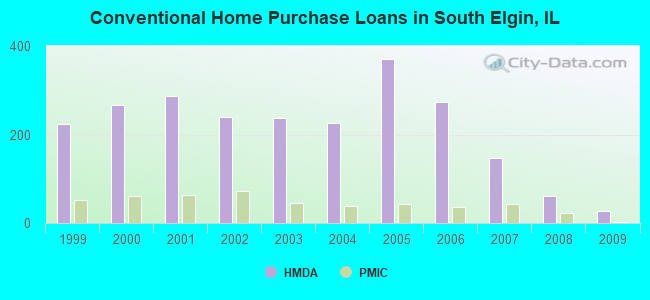
| Home Mortgage Disclosure Act Aggregated Statistics For Year 2009 (Based on 3 partial tracts) | ||||||||||||
| A) FHA, FSA/RHS & VA Home Purchase Loans | B) Conventional Home Purchase Loans | C) Refinancings | D) Home Improvement Loans | F) Non-occupant Loans on < 5 Family Dwellings (A B C & D) | G) Loans On Manufactured Home Dwelling (A B C & D) | |||||||
|---|---|---|---|---|---|---|---|---|---|---|---|---|
| Number | Average Value | Number | Average Value | Number | Average Value | Number | Average Value | Number | Average Value | Number | Average Value | |
| LOANS ORIGINATED | 41 | $182,982 | 26 | $226,187 | 306 | $212,016 | 6 | $93,910 | 14 | $213,858 | 1 | $144,300 |
| APPLICATIONS APPROVED, NOT ACCEPTED | 2 | $137,590 | 5 | $181,390 | 34 | $213,159 | 1 | $46,340 | 3 | $133,413 | 0 | $0 |
| APPLICATIONS DENIED | 3 | $176,750 | 5 | $265,906 | 79 | $233,470 | 5 | $67,880 | 6 | $121,900 | 0 | $0 |
| APPLICATIONS WITHDRAWN | 5 | $190,138 | 2 | $374,330 | 42 | $235,462 | 1 | $31,240 | 2 | $182,805 | 0 | $0 |
| FILES CLOSED FOR INCOMPLETENESS | 1 | $174,670 | 1 | $49,980 | 13 | $221,882 | 1 | $16,280 | 1 | $49,980 | 0 | $0 |
Detailed HMDA statistics for the following Tracts: 8518.01 , 8518.02, 8521.00
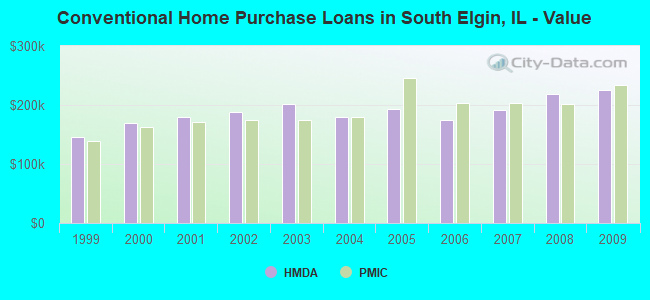
| Private Mortgage Insurance Companies Aggregated Statistics For Year 2009 (Based on 3 partial tracts) | ||||
| A) Conventional Home Purchase Loans | B) Refinancings | |||
|---|---|---|---|---|
| Number | Average Value | Number | Average Value | |
| LOANS ORIGINATED | 2 | $233,790 | 5 | $202,402 |
| APPLICATIONS APPROVED, NOT ACCEPTED | 2 | $144,855 | 4 | $210,222 |
| APPLICATIONS DENIED | 0 | $0 | 2 | $215,680 |
| APPLICATIONS WITHDRAWN | 0 | $0 | 2 | $193,355 |
| FILES CLOSED FOR INCOMPLETENESS | 1 | $178,690 | 1 | $234,770 |
Detailed PMIC statistics for the following Tracts: 8518.01 , 8518.02, 8521.00
2002 - 2018 National Fire Incident Reporting System (NFIRS) incidents
- Fire incident types reported to NFIRS in South Elgin, IL
- 50145.7%Structure Fires
- 45241.2%Outside Fires
- 1009.1%Mobile Property/Vehicle Fires
- 433.9%Other
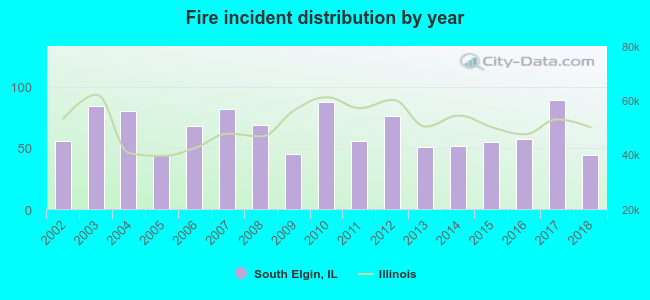 According to the data from the years 2002 - 2018 the average number of fire incidents per year is 64. The highest number of fire incidents - 89 took place in 2017, and the least - 44 in 2005. The data has a decreasing trend.
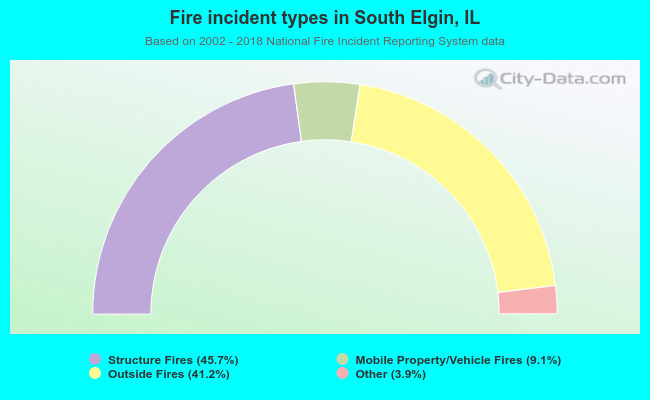 When looking into fire subcategories, the most incidents belonged to: Structure Fires (45.7%), and Outside Fires (41.2%).
| Most common first names in South Elgin, IL among deceased individuals | ||
| Name | Count | Lived (average) |
|---|---|---|
| John | 56 | 74.4 years |
| William | 47 | 73.7 years |
| James | 38 | 69.8 years |
| Mary | 38 | 83.0 years |
| George | 38 | 76.3 years |
| Margaret | 32 | 84.6 years |
| Robert | 28 | 73.2 years |
| Helen | 26 | 83.1 years |
| Fred | 25 | 72.2 years |
| Edward | 25 | 72.4 years |
| Most common last names in South Elgin, IL among deceased individuals | ||
| Last name | Count | Lived (average) |
|---|---|---|
| Johnson | 25 | 79.2 years |
| Miller | 11 | 78.6 years |
| Jones | 11 | 74.9 years |
| Peterson | 11 | 74.8 years |
| Smith | 10 | 76.5 years |
| Brown | 10 | 81.4 years |
| Anderson | 10 | 77.0 years |
| Carlson | 9 | 81.3 years |
| Taylor | 8 | 72.4 years |
| Wilson | 8 | 70.2 years |
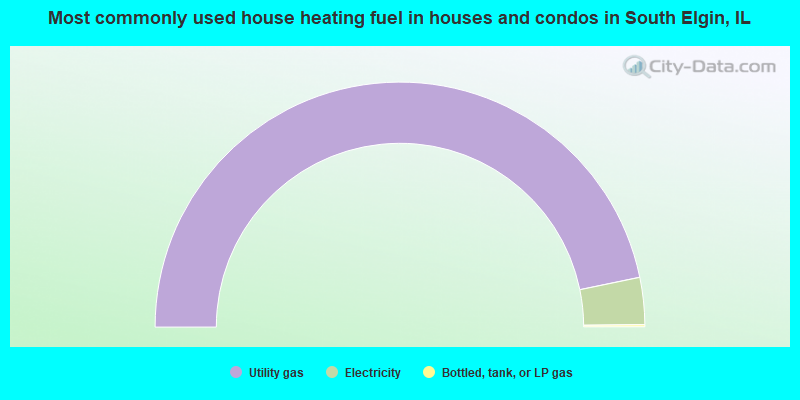
- 93.5%Utility gas
- 6.2%Electricity
- 0.3%Bottled, tank, or LP gas
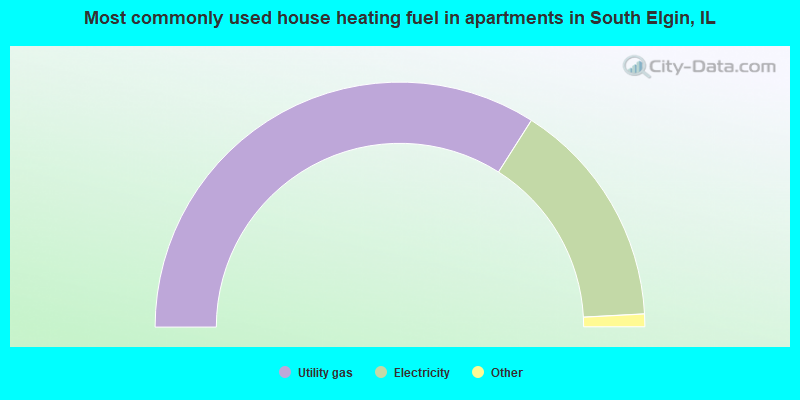
- 68.1%Utility gas
- 30.3%Electricity
- 1.3%Bottled, tank, or LP gas
- 0.4%Solar energy
South Elgin compared to Illinois state average:
- Unemployed percentage significantly below state average.
- Black race population percentage below state average.
- Hispanic race population percentage above state average.
- Median age below state average.
- Renting percentage significantly below state average.
- Length of stay since moving in above state average.
- House age significantly below state average.
South Elgin on our top lists:
- #76 on the list of "Top 101 cities with the most residents born in Africa, n.e.c. (population 500+)"
- #84 on the list of "Top 100 cities with highest median household income and median resident age less than 35 (pop. 5,000+)"
- #87 on the list of "Top 101 cities with the smallest household incomes disparities (population 5,000+)"
- #8 on the list of "Top 101 counties with the largest decrease in the number of births per 1000 residents 2000-2006 to 2007-2013 (pop 50,000+)"
- #58 on the list of "Top 101 counties with the lowest number of deaths per 1000 residents 2007-2013 (pop. 50,000+)"
- #65 on the list of "Top 101 counties with the largest increase in the number of infant deaths per 1000 residents 2000-2006 to 2007-2013 (pop. 50,000+)"
- #76 on the list of "Top 101 counties with the highest ground withdrawal of fresh water for public supply"
- #84 on the list of "Top 101 counties with the largest number of children under 18 without health insurance coverage in 2000 (pop. 50,000+)"

|
|
Total of 156 patent applications in 2008-2024.