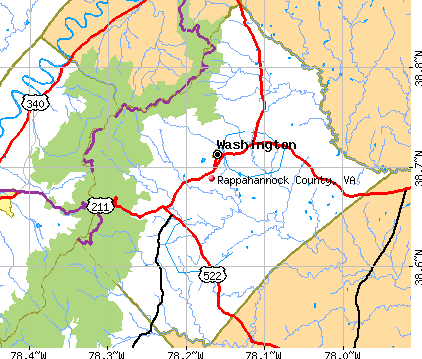
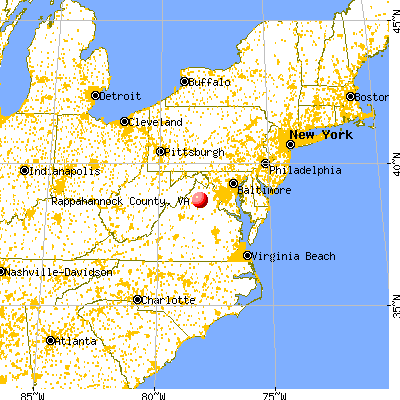
Rappahannock County, Virginia (VA)
County owner-occupied free and clear houses and condos in 2010: 862
County owner-occupied houses and condos in 2000: 2,103
Renter-occupied apartments: 758 (it was 685 in 2000)
| % of renters here: | 25% |
| State: | 33% |
Land area: 267 sq. mi.
Water area: 0.3 sq. mi.
Population density: 28 people per square mile (low).
Industries providing employment: Educational, health and social services (18.2%), Construction (16.6%), Professional, scientific, management, administrative, and waste management services (14.3%).
Type of workers:
- Private wage or salary: 77%
- Government: 13%
- Self-employed, not incorporated: 10%
- Unpaid family work: 0%
- OSM Map
- General Map
- Google Map
- MSN Map

- 6,34785.6%White Non-Hispanic Alone
- 3324.5%Hispanic or Latino
- 3254.4%Black Non-Hispanic Alone
- 2613.5%Two or more races
- 1171.6%Some other race alone
- 180.2%American Indian and Alaska Native alone
- 160.2%Asian alone

| Median resident age: | 50.4 years |
| Virginia median age: | 39.0 years |
| Males: 3,772 | |
| Females: 3,700 |

 | Looking for vacation home fairly close to Northern VA (21 replies) |
| Where is Northern Virginia? (25 replies) |
| Ticketed on I81 for Speed and Window Tint (54 replies) |
| Speeding Near Front Royal Gets Car Blogger Three Days in the Pokey (30 replies) |
| Which counties are staying rural around NOVA? (14 replies) |
| 2013 NoVa SAT Scores (24 replies) |
| Rappahannock County: | 2.0 people |
| Virginia: | 3 people |
Estimated median household income in 2022: $97,106 ($45,943 in 1999)
| This county: | $97,106 |
| Virginia: | $85,873 |
Median contract rent in 2022 for apartments: $989 (lower quartile is $713, upper quartile is $1,732)
| This county: | $989 |
| State: | $1270 |
Estimated median house or condo value in 2022: $548,335 (it was $166,100 in 2000)
| Rappahannock: | $548,335 |
| Virginia: | $365,700 |
Median monthly housing costs for homes and condos with a mortgage: $1,843
Median monthly housing costs for units without a mortgage: $639
Institutionalized population: 27
Crime in 2021 (reported by the sheriff's office or county police, not the county total):
- Murders: 0
- Rapes: 1
- Robberies: 0
- Assaults: 10
- Burglaries: 2
- Thefts: 21
- Auto thefts: 3
Crime in 2020 (reported by the sheriff's office or county police, not the county total):
- Murders: 0
- Rapes: 1
- Robberies: 0
- Assaults: 6
- Burglaries: 6
- Thefts: 22
- Auto thefts: 2
Single-family new house construction building permits:
- 2022: 40 buildings, average cost: $613,100
- 2021: 28 buildings, average cost: $512,300
- 2020: 22 buildings, average cost: $438,200
- 2019: 22 buildings, average cost: $240,500
- 2018: 24 buildings, average cost: $229,000
- 2017: 21 buildings, average cost: $229,000
- 2016: 18 buildings, average cost: $229,000
- 2015: 26 buildings, average cost: $475,100
- 2014: 22 buildings, average cost: $475,100
- 2013: 32 buildings, average cost: $279,900
- 2012: 18 buildings, average cost: $441,000
- 2011: 14 buildings, average cost: $428,500
- 2010: 16 buildings, average cost: $239,700
- 2009: 21 buildings, average cost: $290,400
- 2008: 32 buildings, average cost: $295,500
- 2007: 43 buildings, average cost: $338,600
- 2006: 67 buildings, average cost: $266,800
- 2005: 60 buildings, average cost: $223,100
- 2004: 58 buildings, average cost: $230,200
- 2003: 60 buildings, average cost: $236,100
- 2002: 61 buildings, average cost: $193,500
- 2001: 69 buildings, average cost: $165,500
- 2000: 44 buildings, average cost: $106,600
- 1999: 48 buildings, average cost: $106,600
- 1998: 47 buildings, average cost: $106,600
- 1997: 43 buildings, average cost: $106,500


Median real estate property taxes paid for housing units with mortgages in 2022: $2,639 (0.5%)
Median real estate property taxes paid for housing units with no mortgage in 2022: $2,936 (0.5%)


| Rappahannock County: | 8.1% |
| Virginia: | 10.6% |
Median age of residents in 2022: 50.4 years old
(Males: 47.1 years old, Females: 53.3 years old)
(Median age for: White residents: 54.1 years old, Black residents: 38.2 years old, American Indian residents: 29.1 years old, Hispanic or Latino residents: 17.1 years old, Other race residents: 15.0 years old)
Fair market rent in 2006 for a 1-bedroom apartment in Rappahannock County is $475 a month.
Fair market rent for a 2-bedroom apartment is $574 a month.
Fair market rent for a 3-bedroom apartment is $794 a month.
Cities in this county include: Chester Gap, Sperryville, Flint Hill, Washington.
Neighboring counties: Alpine County, California  , Marion County, Illinois , Lewis County, Kentucky , Montgomery County, Missouri , Mason County, Kentucky .
| Here: | 2.3% |
| Virginia: | 2.7% |


Current college students: 216
People 25 years of age or older with a high school degree or higher: 90.6%
People 25 years of age or older with a bachelor's degree or higher: 33.8%
Number of foreign born residents: 397 (48.4% naturalized citizens)
| Rappahannock County: | 5.3% |
| Whole state: | 12.7% |

- Year of entry for the foreign-born population
- 2392010 or later
- 252000 to 2009
- 01990 to 1999
- 301980 to 1989
- 581970 to 1979
- 99Before 1970
Mean travel time to work (commute): % minutes
Percentage of county residents living and working in this county: 97.3%

Housing units in structures:
- One, detached: 3,769
- One, attached: 38
- Two: 26
- 3 or 4: 12
- 5 to 9: 39
- Mobile homes: 29
Housing units in Rappahannock County with a mortgage: 1,094 (122 second mortgage, 26 home equity loan, 99 both second mortgage and home equity loan)
Houses without a mortgage: 20
| Here: | 4.8% with mortgage |
| State: | 97.2% with mortgage |
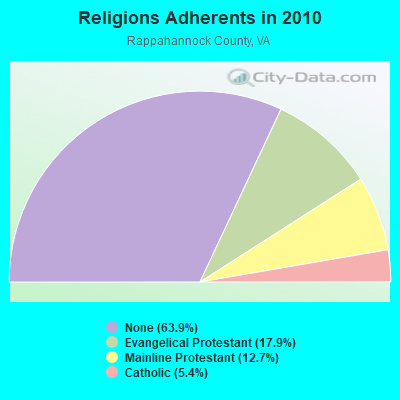
Religion statistics for Rappahannock County
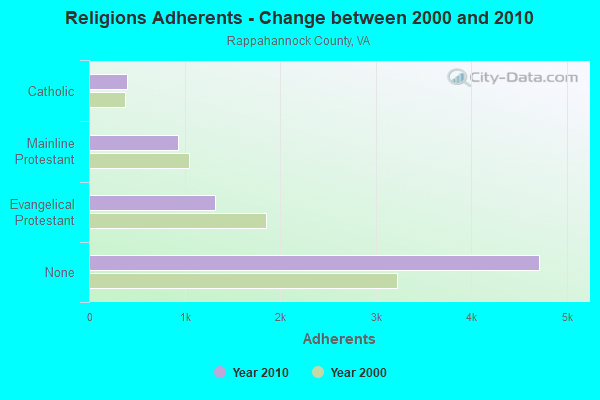
| Religion | Adherents | Congregations |
|---|---|---|
| Evangelical Protestant | 1,320 | 11 |
| Mainline Protestant | 934 | 5 |
| Catholic | 401 | 1 |
| Other | 3 | 1 |
| None | 4,715 | - |
Source: Clifford Grammich, Kirk Hadaway, Richard Houseal, Dale E.Jones, Alexei Krindatch, Richie Stanley and Richard H.Taylor. 2012. 2010 U.S.Religion Census: Religious Congregations & Membership Study. Association of Statisticians of American Religious Bodies. Jones, Dale E., et al. 2002. Congregations and Membership in the United States 2000. Nashville, TN: Glenmary Research Center.
Food Environment Statistics:
| Rappahannock County: | 2.78 / 10,000 pop. |
| State: | 2.03 / 10,000 pop. |
| Rappahannock County: | 5.55 / 10,000 pop. |
| Virginia: | 4.03 / 10,000 pop. |
| This county: | 8.33 / 10,000 pop. |
| State: | 7.65 / 10,000 pop. |
| Rappahannock County: | 9.9% |
| Virginia: | 9.3% |
| Rappahannock County: | 25.9% |
| State: | 26.7% |
| Here: | 23.1% |
| State: | 18.6% |
Agriculture in Rappahannock County:
Average size of farms: 177 acresAverage value of agricultural products sold per farm: $16,002
Average value of crops sold per acre for harvested cropland: $104.00
The value of nursery, greenhouse, floriculture, and sod as a percentage of the total market value of agricultural products sold: 3.76%
The value of livestock, poultry, and their products as a percentage of the total market value of agricultural products sold: 70.47%
Average total farm production expenses per farm: $17,085
Harvested cropland as a percentage of land in farms: 25.64%
Irrigated harvested cropland as a percentage of land in farms: 1.66%
Average market value of all machinery and equipment per farm: $31,735
The percentage of farms operated by a family or individual: 90.97%
Average age of principal farm operators: 58 years
Average number of cattle and calves per 100 acres of all land in farms: 22.36
Corn for grain: 318 harvested acres
All wheat for grain: 63 harvested acres
Soybeans for beans: 305 harvested acres
Vegetables: 23 harvested acres
Land in orchards: 594 acres
Earthquake activity:
Rappahannock County-area historical earthquake activity is significantly above Virginia state average. It is 50% smaller than the overall U.S. average.On 8/23/2011 at 17:51:04, a magnitude 5.8 (5.8 MW, Depth: 3.7 mi, Class: Moderate, Intensity: VI - VII) earthquake occurred 55.3 miles away from Rappahannock County center
On 8/25/2011 at 05:07:52, a magnitude 4.5 (4.5 ML, Depth: 4.2 mi, Class: Light, Intensity: IV - V) earthquake occurred 52.4 miles away from the county center
On 12/9/2003 at 20:59:18, a magnitude 4.5 (4.5 ML, Depth: 6.2 mi) earthquake occurred 63.3 miles away from the county center
On 12/9/2003 at 20:59:14, a magnitude 4.5 (4.5 MB, 4.5 LG) earthquake occurred 77.5 miles away from the county center
On 9/25/1998 at 19:52:52, a magnitude 5.2 (4.8 MB, 4.3 MS, 5.2 LG, 4.5 MW, Depth: 3.1 mi) earthquake occurred 226.9 miles away from Rappahannock County center
On 8/9/2020 at 12:07:37, a magnitude 5.1 (5.1 MW, Depth: 4.7 mi) earthquake occurred 221.6 miles away from the county center
Magnitude types: regional Lg-wave magnitude (LG), body-wave magnitude (MB), local magnitude (ML), surface-wave magnitude (MS), moment magnitude (MW)
Most recent natural disasters:
- Virginia Covid-19 Pandemic, Incident Period: January 20, 2020, Major Disaster (Presidential) Declared DR-4512-VA: April 2, 2020, FEMA Id: 4512, Natural disaster type: Other
- Virginia Tropical Storm Michael, Incident Period: October 9, 2018 - October 16, 2018, FEMA Id: 4411, Natural disaster type: Tropical Storm
- Virginia Severe Winter Storm And Snowstorm, Incident Period: January 22, 2016 to January 23, 2016, Major Disaster (Presidential) Declared DR-4262: March 07, 2016, FEMA Id: 4262, Natural disaster type: Snowstorm, Winter Storm
- Virginia Hurricane Sandy, Incident Period: October 26, 2012 to November 01, 2012, Emergency Declared EM-3359: October 29, 2012, FEMA Id: 3359, Natural disaster type: Hurricane
- Virginia Severe Storms and Straight-line Winds, Incident Period: June 29, 2012 to July 01, 2012, Major Disaster (Presidential) Declared DR-4072: July 27, 2012, FEMA Id: 4072, Natural disaster type: Storm, Wind
- Virginia Severe Winter Storms and Snowstorms, Incident Period: February 05, 2010 to February 11, 2010, Major Disaster (Presidential) Declared DR-1905: April 27, 2010, FEMA Id: 1905, Natural disaster type: Snowstorm, Winter Storm
- Virginia Severe Storms, Tornadoes, and Flooding, Incident Period: June 23, 2006 to July 06, 2006, Major Disaster (Presidential) Declared DR-1655: July 13, 2006, FEMA Id: 1655, Natural disaster type: Storm, Tornado, Flood
- Virginia Hurricane Katrina Evacuation, Incident Period: August 29, 2005 to October 01, 2005, Emergency Declared EM-3240: September 12, 2005, FEMA Id: 3240, Natural disaster type: Hurricane
- Virginia Hurricane Isabel, Incident Period: September 18, 2003 to October 01, 2003, Major Disaster (Presidential) Declared DR-1491: September 18, 2003, FEMA Id: 1491, Natural disaster type: Hurricane
- Virginia Winter Storm, Incident Period: January 25, 2000 to January 30, 2000, Major Disaster (Presidential) Declared DR-1318: February 28, 2000, FEMA Id: 1318, Natural disaster type: Winter Storm
- 9 other natural disasters have been reported since 1953.
The number of natural disasters in Rappahannock County (19) is greater than the US average (15).
Major Disasters (Presidential) Declared: 14
Emergencies Declared: 4
Causes of natural disasters: Storms: 5, Winter Storms: 5, Floods: 4, Hurricanes: 4, Snowstorms: 2, Tropical Storms: 2, Blizzard: 1, Drought: 1, Ice Storm: 1, Tornado: 1, Wind: 1, Other: 1 (Note: some incidents may be assigned to more than one category).

Means of transportation to work:
- Drove a car alone: 1,328 (59.1%)
- Carpooled: 180 (8.0%)
- Taxicab, motorcycle, or other means: 35 (1.6%)
- Walked: 101 (4.5%)
- Worked at home: 696 (31.0%)


- Health care and social assistance (17%)
- Retail trade (12%)
- Educational services (12%)
- Construction (11%)
- Other services, except public administration (8%)
- Professional, scientific, and technical services (7%)
- Public administration (7%)

- Health care and social assistance (18%)
- Retail trade (13%)
- Educational services (13%)
- Construction (11%)
- Other services, except public administration (9%)
- Professional, scientific, and technical services (7%)
- Public administration (7%)

- Management occupations (22%)
- Construction and extraction occupations (13%)
- Installation, maintenance, and repair occupations (11%)
- Building and grounds cleaning and maintenance occupations (9%)
- Sales and related occupations (4%)
- Computer and mathematical occupations (4%)
- Production occupations (4%)

- Sales and related occupations (15%)
- Office and administrative support occupations (9%)
- Personal care and service occupations (9%)
- Educational instruction, and library occupations (7%)
- Healthcare support occupations (7%)
- Management occupations (7%)
- Arts, design, entertainment, sports, and media occupations (6%)

- Mexico (42%)
- England (19%)
- Zimbabwe (13%)
- Kenya (8%)
- Philippines (6%)
- South Africa (5%)
- Germany (3%)

- English (19%)
- Irish (18%)
- German (10%)
- American (7%)
- Italian (7%)
- Scottish (4%)
- Polish (4%)

8 people in workers' group living quarters and job corps centers
10 people in local jails and other confinement facilities (including police lockups)
8.47% of this county's 2021 resident taxpayers lived in other counties in 2020 ($100,020 average adjusted gross income)
| Here: | 8.47% |
| Virginia average: | 10.16% |
10 or fewer of this county's residents moved from foreign countries.
6.86% relocated from other counties in Virginia ($65,476 average AGI)
1.61% relocated from other states ($34,544 average AGI)
Rappahannock County: 1.61% Virginia average: 3.91%

Top counties from which taxpayers relocated into this county between 2020 and 2021:
| from Fauquier County, VA | |
| from Culpeper County, VA | |
| from District of Columbia, DC |
6.65% of this county's 2020 resident taxpayers moved to other counties in 2021 ($48,136 average adjusted gross income)
| Here: | 6.65% |
| Virginia average: | 10.20% |
10 or fewer of this county's residents moved to foreign countries.
5.71% relocated to other counties in Virginia ($26,639 average AGI)
0.94% relocated to other states ($21,497 average AGI)
Rappahannock County: 0.94% Virginia average: 3.98%

Top counties to which taxpayers relocated from this county between 2020 and 2021:
| to Culpeper County, VA | |
| to Warren County, VA | |
| to Fauquier County, VA |
Births per 1000 population from 1990 to 1999: 11.7
Births per 1000 population from 2000 to 2006: 10.8

Deaths per 1000 population from 1990 to 1999: 9.4
Deaths per 1000 population from 2000 to 2009: 9.4
Deaths per 1000 population from 2010 to 2020: 9.5

Infant deaths per 1000 live births from 1990 to 1999: 6.4
Infant deaths per 1000 live births from 2000 to 2006: 9.2

Persons under 19 years old without health insurance coverage in 2018: 8.3%


Persons enrolled in hospital insurance and/or supplemental medical insurance (Medicare) in July 1, 2007: 1,370 (1,224 aged, 146 disabled)
Children under 18 without health insurance coverage in 2007: 244 (17%)


Population without health insurance coverage in 2000: 9%
Children under 18 without health insurance coverage in 2000: 6%
Medical specialist MDs per 100,000 population in 2005: 1,004
Total deaths per 100,000 population, July 2005 - July 2006: 28
Household type by relationship:
Households: 7,472- Male householders: 1,487 (290 living alone), Female householders: 1,412 (401 living alone)
1,605 spouses (1,577 opposite-sex spouses), 200 unmarried partners, (200 opposite-sex unmarried partners), 1,849 children (1,706 natural, 21 adopted, 122 stepchildren), 191 grandchildren, 44 brothers or sisters, 96 parents, 0 foster children, 210 other relatives, 349 non-relatives
- In group quarters: 8
Size of family households: 1,210 2-persons, 375 3-persons, 154 4-persons, 145 5-persons, 64 6-persons, 80 7-or-more-persons.
Size of nonfamily households: 691 1-person, 116 2-persons, 53 3-persons, 19 4-persons.
825 married couples with children.
222 single-parent households (28 men, 194 women).
96.3% of residents of Rappahannock speak English at home.
2.7% of residents speak Spanish at home (85% speak English very well, 14% speak English not well, 2% don't speak English at all).
0.6% of residents speak other Indo-European language at home (100% speak English very well).
0.3% of residents speak Asian or Pacific Island language at home (74% speak English very well, 26% speak English well).
0.1% of residents speak other language at home (100% speak English well).
In fiscal year 2004:
Federal Government expenditure: $47,789,000 ($6,664 per capita)
Department of Defense expenditure: $5,768,000
Federal direct payments to individuals for retirement and disability: $29,713,000
Federal other direct payments to individuals: $8,538,000
Federal direct payments not to individuals: $183,000
Federal grants: $5,238,000
Federal procurement contracts: $1,471,000 ($862,000 Department of Defense)
Federal salaries and wages: $2,646,000 ($0,000 Department of Defense)
Federal Government direct loans: $29,000
Federal guaranteed/insured loans: $1,008,000
Federal Government insurance: $7,364,000
Population change from April 1, 2000 to July 1, 2005:
Births: 378| Here: | 52 per 1000 residents |
| State: | 70 per 1000 residents |
Deaths: 369
| Here: | 51 per 1000 residents |
| State: | 40 per 1000 residents |
Net international migration: +5
| Here: | +1 per 1000 residents |
| State: | +18 per 1000 residents |
Net internal migration: +283
| Here: | +39 per 1000 residents |
| State: | +14 per 1000 residents |

Total withdrawal of fresh water for public supply: 0.04 millions of gallons per day (all from ground)
| Here: | 6.9 |
| State: | 7.0 |
| Here: | 5.6 |
| State: | 4.3 |

- Year house built in Rappahannock County, Virginia
- 02020 or later
- 1002010 to 2019
- 6162000 to 2009
- 5101990 to 1999
- 8431980 to 1989
- 5111970 to 1979
- 1961960 to 1969
- 2801950 to 1959
- 621940 to 1949
- 7301939 or earlier

- Rooms in owner-occupied houses in Rappahannock County, Virginia
- 01 room
- 02 rooms
- 853 rooms
- 1354 rooms
- 2925 rooms
- 4246 rooms
- 3577 rooms
- 3048 rooms
- 5809+ rooms

- Rooms in renter-occupied apartments in Rappahannock County, Virginia
- 01 room
- 702 rooms
- 133 rooms
- 714 rooms
- 1735 rooms
- 1626 rooms
- 1577 rooms
- 78 rooms
- 689+ rooms

- Bedrooms in owner-occupied houses in Rappahannock County, Virginia
- 0no bedroom
- 371 bedroom
- 6002 bedrooms
- 9843 bedrooms
- 3854 bedrooms
- 1615+ bedrooms

- Bedrooms in renter-occupied apartments in Rappahannock County, Virginia
- 0no bedroom
- 811 bedroom
- 1152 bedrooms
- 4383 bedrooms
- 754 bedrooms
- 105+ bedrooms

- Cars and other vehicles available in Rappahannock County in owner-occupied houses/condos
- 24no vehicle
- 3111 vehicle
- 9622 vehicles
- 4583 vehicles
- 1914 vehicles
- 2285+ vehicles

- Cars and other vehicles available in Rappahannock County in renter-occupied apartments
- 23no vehicle
- 3051 vehicle
- 2052 vehicles
- 1303 vehicles
- 434 vehicles
- 115+ vehicles
87.3% of Rappahannock County residents lived in the same house 1 years ago.
Out of people who lived in different houses, 10% lived in this county.
Out of people who lived in different counties, 85% lived in Virginia.
| Rappahannock County: | 87.3% |
| State average: | 86.6% |
Place of birth for U.S.-born residents:
- This state: 3,704
- Other state: 3,202
- Northeast: 1,038
- Midwest: 415
- South: 1,332
- West: 420


- 44.4%Electricity
- 26.8%Bottled, tank, or LP gas
- 15.6%Wood
- 11.5%Fuel oil, kerosene, etc.
- 1.1%Other fuel
- 0.6%Utility gas

- 68.2%Electricity
- 18.9%Wood
- 9.1%Bottled, tank, or LP gas
- 3.8%Fuel oil, kerosene, etc.
Private vs. public school enrollment:
| Here: | 20.7% |
| Virginia: | 13.2% |
| Here: | 12.8% |
| Virginia: | 10.2% |
| Here: | 20.2% |
| Virginia: | 18.7% |


Rappahannock County government finances - Expenditure in 2018:
- Assistance and Subsidies - Public Welfare, Federal Categorical Assistance Programs: $1,481,000
Public Welfare, Cash Assistance Programs - Other: $230,000
- Charges - Other: $39,000
Solid Waste Management: $11,000
Elementary and Secondary Education School Tuition and Transportation: $7,000
Elementary and Secondary Education School Tuition and Transportation: $2,000
- Construction - Local Fire Protection: $60,000
- Current Operations - Elementary and Secondary Education: $12,737,000
Elementary and Secondary Education: $11,968,000
General - Other: $9,407,000
Public Welfare - Other: $3,401,000
Police Protection: $1,910,000
Police Protection: $1,885,000
Public Welfare - Other: $1,236,000
Local Fire Protection: $1,144,000
Local Fire Protection: $1,142,000
General Public Buildings: $1,073,000
Financial Administration: $994,000
Central Staff Services: $880,000
Solid Waste Management: $798,000
Judicial and Legal Services: $720,000
Judicial and Legal Services: $643,000
Financial Administration: $557,000
Correctional Institutions: $414,000
Protective Inspection and Regulation - Other: $343,000
General Public Buildings: $332,000
Correctional Institutions: $315,000
Natural Resources - Other: $308,000
Libraries: $286,000
Libraries: $282,000
Central Staff Services: $248,000
Health - Other: $203,000
Protective Inspection and Regulation - Other: $153,000
Sewerage: $141,000
Parks and Recreation: $113,000
Health - Other: $66,000
Public Welfare, Vendor Payments for Other Purposes: $53,000
Corrections - Other: $37,000
Natural Resources - Other: $11,000
Parks and Recreation: $9,000
- Federal Intergovernmental - Public Welfare: $901,000
Public Welfare: $643,000
Other: $283,000
General Local Government Support: $91,000
General Local Government Support: $87,000
Natural Resources: $11,000
- General - Interest on Debt: $109,000
Interest on Debt: $65,000
- Intergovernmental to Local - Other - General - Other: $8,624,000
Other - Public Welfare - Other: $1,546,000
Other - Elementary and Secondary Education: $54,000
Other - Elementary and Secondary Education: $50,000
- Local Intergovernmental - Sewerage: $153,000
Water Utilities: $140,000
Education: $68,000
Education: $67,000
Public Welfare: $10,000
- Long Term Debt - Beginning Outstanding - Unspecified Public Purpose: $2,465,000
Outstanding Unspecified Public Purpose: $2,005,000
Beginning Outstanding - Unspecified Public Purpose: $1,540,000
Outstanding Unspecified Public Purpose: $1,220,000
Retired Unspecified Public Purpose: $460,000
Retired Unspecified Public Purpose: $320,000
- Miscellaneous - General Revenue - Other: $680,000
General Revenue - Other: $477,000
Fines and Forfeits: $137,000
Fines and Forfeits: $94,000
Interest Earnings: $90,000
Rents: $7,000
- Other Capital Outlay - Elementary and Secondary Education: $719,000
Elementary and Secondary Education: $359,000
- Other Funds - Cash and Securities: $6,634,000
Cash and Securities: $6,079,000
- Revenue - Electric Utilities: $182,000
- Short Term Debt Outstanding - End of Fiscal Year: $1,681,000
Beginning: $1,180,000
- State Intergovernmental - Education: $3,517,000
Education: $3,168,000
General Local Government Support: $2,115,000
Public Welfare: $1,394,000
Other: $1,229,000
General Local Government Support: $945,000
Public Welfare: $834,000
Other: $118,000
Highways: $7,000
Highways: $1,000
- Tax - Property: $14,376,000
Property: $13,261,000
General Sales and Gross Receipts: $832,000
General Sales and Gross Receipts: $716,000
Public Utilities Sales: $595,000
Public Utilities Sales: $462,000
Other License: $371,000
Other License: $362,000
Motor Vehicle License: $210,000
Motor Vehicle License: $205,000
Documentary and Stock Transfer: $188,000
Documentary and Stock Transfer: $142,000
Occupation and Business License - Other: $140,000
Occupation and Business License - Other: $116,000
- Total Salaries and Wages: $7,194,000
: $6,826,000
Rappahannock County government finances - Revenue in 2018:
- Assistance and Subsidies - Public Welfare, Federal Categorical Assistance Programs: $1,481,000
Public Welfare, Cash Assistance Programs - Other: $230,000
- Charges - Other: $39,000
Solid Waste Management: $11,000
Elementary and Secondary Education School Tuition and Transportation: $7,000
Elementary and Secondary Education School Tuition and Transportation: $2,000
- Construction - Local Fire Protection: $60,000
- Current Operations - Elementary and Secondary Education: $12,737,000
Elementary and Secondary Education: $11,968,000
General - Other: $9,407,000
Public Welfare - Other: $3,401,000
Police Protection: $1,910,000
Police Protection: $1,885,000
Public Welfare - Other: $1,236,000
Local Fire Protection: $1,144,000
Local Fire Protection: $1,142,000
General Public Buildings: $1,073,000
Financial Administration: $994,000
Central Staff Services: $880,000
Solid Waste Management: $798,000
Judicial and Legal Services: $720,000
Judicial and Legal Services: $643,000
Financial Administration: $557,000
Correctional Institutions: $414,000
Protective Inspection and Regulation - Other: $343,000
General Public Buildings: $332,000
Correctional Institutions: $315,000
Natural Resources - Other: $308,000
Libraries: $286,000
Libraries: $282,000
Central Staff Services: $248,000
Health - Other: $203,000
Protective Inspection and Regulation - Other: $153,000
Sewerage: $141,000
Parks and Recreation: $113,000
Health - Other: $66,000
Public Welfare, Vendor Payments for Other Purposes: $53,000
Corrections - Other: $37,000
Natural Resources - Other: $11,000
Parks and Recreation: $9,000
- Federal Intergovernmental - Public Welfare: $901,000
Public Welfare: $643,000
Other: $283,000
General Local Government Support: $91,000
General Local Government Support: $87,000
Natural Resources: $11,000
- General - Interest on Debt: $109,000
Interest on Debt: $65,000
- Intergovernmental to Local - Other - General - Other: $8,624,000
Other - Public Welfare - Other: $1,546,000
Other - Elementary and Secondary Education: $54,000
Other - Elementary and Secondary Education: $50,000
- Local Intergovernmental - Sewerage: $153,000
Water Utilities: $140,000
Education: $68,000
Education: $67,000
Public Welfare: $10,000
- Long Term Debt - Beginning Outstanding - Unspecified Public Purpose: $2,465,000
Outstanding Unspecified Public Purpose: $2,005,000
Beginning Outstanding - Unspecified Public Purpose: $1,540,000
Outstanding Unspecified Public Purpose: $1,220,000
Retired Unspecified Public Purpose: $460,000
Retired Unspecified Public Purpose: $320,000
- Miscellaneous - General Revenue - Other: $680,000
General Revenue - Other: $477,000
Fines and Forfeits: $137,000
Fines and Forfeits: $94,000
Interest Earnings: $90,000
Rents: $7,000
- Other Capital Outlay - Elementary and Secondary Education: $719,000
Elementary and Secondary Education: $359,000
- Other Funds - Cash and Securities: $6,634,000
Cash and Securities: $6,079,000
- Revenue - Electric Utilities: $182,000
- Short Term Debt Outstanding - End of Fiscal Year: $1,681,000
Beginning: $1,180,000
- State Intergovernmental - Education: $3,517,000
Education: $3,168,000
General Local Government Support: $2,115,000
Public Welfare: $1,394,000
Other: $1,229,000
General Local Government Support: $945,000
Public Welfare: $834,000
Other: $118,000
Highways: $7,000
Highways: $1,000
- Tax - Property: $14,376,000
Property: $13,261,000
General Sales and Gross Receipts: $832,000
General Sales and Gross Receipts: $716,000
Public Utilities Sales: $595,000
Public Utilities Sales: $462,000
Other License: $371,000
Other License: $362,000
Motor Vehicle License: $210,000
Motor Vehicle License: $205,000
Documentary and Stock Transfer: $188,000
Documentary and Stock Transfer: $142,000
Occupation and Business License - Other: $140,000
Occupation and Business License - Other: $116,000
- Total Salaries and Wages: $7,194,000
: $6,826,000
Rappahannock County government finances - Debt in 2018:
- Assistance and Subsidies - Public Welfare, Federal Categorical Assistance Programs: $1,481,000
Public Welfare, Cash Assistance Programs - Other: $230,000
- Charges - Other: $39,000
Solid Waste Management: $11,000
Elementary and Secondary Education School Tuition and Transportation: $7,000
Elementary and Secondary Education School Tuition and Transportation: $2,000
- Construction - Local Fire Protection: $60,000
- Current Operations - Elementary and Secondary Education: $12,737,000
Elementary and Secondary Education: $11,968,000
General - Other: $9,407,000
Public Welfare - Other: $3,401,000
Police Protection: $1,910,000
Police Protection: $1,885,000
Public Welfare - Other: $1,236,000
Local Fire Protection: $1,144,000
Local Fire Protection: $1,142,000
General Public Buildings: $1,073,000
Financial Administration: $994,000
Central Staff Services: $880,000
Solid Waste Management: $798,000
Judicial and Legal Services: $720,000
Judicial and Legal Services: $643,000
Financial Administration: $557,000
Correctional Institutions: $414,000
Protective Inspection and Regulation - Other: $343,000
General Public Buildings: $332,000
Correctional Institutions: $315,000
Natural Resources - Other: $308,000
Libraries: $286,000
Libraries: $282,000
Central Staff Services: $248,000
Health - Other: $203,000
Protective Inspection and Regulation - Other: $153,000
Sewerage: $141,000
Parks and Recreation: $113,000
Health - Other: $66,000
Public Welfare, Vendor Payments for Other Purposes: $53,000
Corrections - Other: $37,000
Natural Resources - Other: $11,000
Parks and Recreation: $9,000
- Federal Intergovernmental - Public Welfare: $901,000
Public Welfare: $643,000
Other: $283,000
General Local Government Support: $91,000
General Local Government Support: $87,000
Natural Resources: $11,000
- General - Interest on Debt: $109,000
Interest on Debt: $65,000
- Intergovernmental to Local - Other - General - Other: $8,624,000
Other - Public Welfare - Other: $1,546,000
Other - Elementary and Secondary Education: $54,000
Other - Elementary and Secondary Education: $50,000
- Local Intergovernmental - Sewerage: $153,000
Water Utilities: $140,000
Education: $68,000
Education: $67,000
Public Welfare: $10,000
- Long Term Debt - Beginning Outstanding - Unspecified Public Purpose: $2,465,000
Outstanding Unspecified Public Purpose: $2,005,000
Beginning Outstanding - Unspecified Public Purpose: $1,540,000
Outstanding Unspecified Public Purpose: $1,220,000
Retired Unspecified Public Purpose: $460,000
Retired Unspecified Public Purpose: $320,000
- Miscellaneous - General Revenue - Other: $680,000
General Revenue - Other: $477,000
Fines and Forfeits: $137,000
Fines and Forfeits: $94,000
Interest Earnings: $90,000
Rents: $7,000
- Other Capital Outlay - Elementary and Secondary Education: $719,000
Elementary and Secondary Education: $359,000
- Other Funds - Cash and Securities: $6,634,000
Cash and Securities: $6,079,000
- Revenue - Electric Utilities: $182,000
- Short Term Debt Outstanding - End of Fiscal Year: $1,681,000
Beginning: $1,180,000
- State Intergovernmental - Education: $3,517,000
Education: $3,168,000
General Local Government Support: $2,115,000
Public Welfare: $1,394,000
Other: $1,229,000
General Local Government Support: $945,000
Public Welfare: $834,000
Other: $118,000
Highways: $7,000
Highways: $1,000
- Tax - Property: $14,376,000
Property: $13,261,000
General Sales and Gross Receipts: $832,000
General Sales and Gross Receipts: $716,000
Public Utilities Sales: $595,000
Public Utilities Sales: $462,000
Other License: $371,000
Other License: $362,000
Motor Vehicle License: $210,000
Motor Vehicle License: $205,000
Documentary and Stock Transfer: $188,000
Documentary and Stock Transfer: $142,000
Occupation and Business License - Other: $140,000
Occupation and Business License - Other: $116,000
- Total Salaries and Wages: $7,194,000
: $6,826,000
Rappahannock County government finances - Cash and Securities in 2018:
- Assistance and Subsidies - Public Welfare, Federal Categorical Assistance Programs: $1,481,000
Public Welfare, Cash Assistance Programs - Other: $230,000
- Charges - Other: $39,000
Solid Waste Management: $11,000
Elementary and Secondary Education School Tuition and Transportation: $7,000
Elementary and Secondary Education School Tuition and Transportation: $2,000
- Construction - Local Fire Protection: $60,000
- Current Operations - Elementary and Secondary Education: $12,737,000
Elementary and Secondary Education: $11,968,000
General - Other: $9,407,000
Public Welfare - Other: $3,401,000
Police Protection: $1,910,000
Police Protection: $1,885,000
Public Welfare - Other: $1,236,000
Local Fire Protection: $1,144,000
Local Fire Protection: $1,142,000
General Public Buildings: $1,073,000
Financial Administration: $994,000
Central Staff Services: $880,000
Solid Waste Management: $798,000
Judicial and Legal Services: $720,000
Judicial and Legal Services: $643,000
Financial Administration: $557,000
Correctional Institutions: $414,000
Protective Inspection and Regulation - Other: $343,000
General Public Buildings: $332,000
Correctional Institutions: $315,000
Natural Resources - Other: $308,000
Libraries: $286,000
Libraries: $282,000
Central Staff Services: $248,000
Health - Other: $203,000
Protective Inspection and Regulation - Other: $153,000
Sewerage: $141,000
Parks and Recreation: $113,000
Health - Other: $66,000
Public Welfare, Vendor Payments for Other Purposes: $53,000
Corrections - Other: $37,000
Natural Resources - Other: $11,000
Parks and Recreation: $9,000
- Federal Intergovernmental - Public Welfare: $901,000
Public Welfare: $643,000
Other: $283,000
General Local Government Support: $91,000
General Local Government Support: $87,000
Natural Resources: $11,000
- General - Interest on Debt: $109,000
Interest on Debt: $65,000
- Intergovernmental to Local - Other - General - Other: $8,624,000
Other - Public Welfare - Other: $1,546,000
Other - Elementary and Secondary Education: $54,000
Other - Elementary and Secondary Education: $50,000
- Local Intergovernmental - Sewerage: $153,000
Water Utilities: $140,000
Education: $68,000
Education: $67,000
Public Welfare: $10,000
- Long Term Debt - Beginning Outstanding - Unspecified Public Purpose: $2,465,000
Outstanding Unspecified Public Purpose: $2,005,000
Beginning Outstanding - Unspecified Public Purpose: $1,540,000
Outstanding Unspecified Public Purpose: $1,220,000
Retired Unspecified Public Purpose: $460,000
Retired Unspecified Public Purpose: $320,000
- Miscellaneous - General Revenue - Other: $680,000
General Revenue - Other: $477,000
Fines and Forfeits: $137,000
Fines and Forfeits: $94,000
Interest Earnings: $90,000
Rents: $7,000
- Other Capital Outlay - Elementary and Secondary Education: $719,000
Elementary and Secondary Education: $359,000
- Other Funds - Cash and Securities: $6,634,000
Cash and Securities: $6,079,000
- Revenue - Electric Utilities: $182,000
- Short Term Debt Outstanding - End of Fiscal Year: $1,681,000
Beginning: $1,180,000
- State Intergovernmental - Education: $3,517,000
Education: $3,168,000
General Local Government Support: $2,115,000
Public Welfare: $1,394,000
Other: $1,229,000
General Local Government Support: $945,000
Public Welfare: $834,000
Other: $118,000
Highways: $7,000
Highways: $1,000
- Tax - Property: $14,376,000
Property: $13,261,000
General Sales and Gross Receipts: $832,000
General Sales and Gross Receipts: $716,000
Public Utilities Sales: $595,000
Public Utilities Sales: $462,000
Other License: $371,000
Other License: $362,000
Motor Vehicle License: $210,000
Motor Vehicle License: $205,000
Documentary and Stock Transfer: $188,000
Documentary and Stock Transfer: $142,000
Occupation and Business License - Other: $140,000
Occupation and Business License - Other: $116,000
- Total Salaries and Wages: $7,194,000
: $6,826,000
Supplemental Security Income (SSI) in 2006:
- Total number of recipients: 97
- Number of aged recipients: 23
- Number of blind and disabled recipients: 74
- Number of recipients under 18: 7
- Number of recipients between 18 and 64: 53
- Number of recipients older than 64: 37
- Number of recipients also receiving OASDI: 57
- Amount of payments (thousands of dollars): 30
Businesses in Rappahannock County, VA
- FedEx: 1
Rappahannock County on our top lists:
- #31 on the list of "Top 101 counties with the lowest total withdrawal of fresh water for public supply"