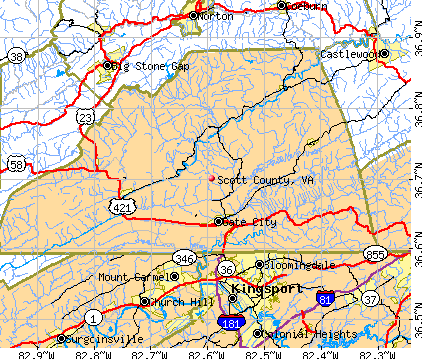
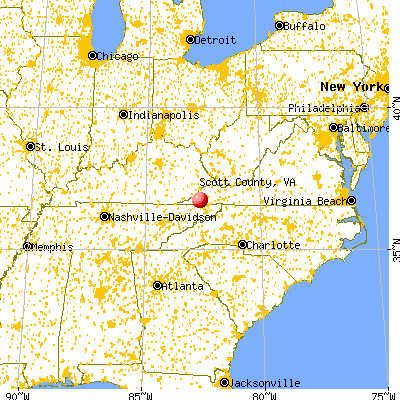
Scott County, Virginia (VA)
County owner-occupied free and clear houses and condos in 2010: 4,440
County owner-occupied houses and condos in 2000: 7,671
Renter-occupied apartments: 2,267 (it was 2,124 in 2000)
| % of renters here: | 22% |
| State: | 33% |
Land area: 537 sq. mi.
Water area: 2.0 sq. mi.
Population density: 40 people per square mile (average).
Industries providing employment: Educational, health and social services (22.0%), Manufacturing (17.6%), Retail trade (12.7%).
Type of workers:
- Private wage or salary: 79%
- Government: 17%
- Self-employed, not incorporated: 4%
- Unpaid family work: 0%
- OSM Map
- General Map
- Google Map
- MSN Map

- 20,37695.7%White Non-Hispanic Alone
- 3381.6%Hispanic or Latino
- 2501.2%Black Non-Hispanic Alone
- 2171.0%Two or more races
- 420.2%Native Hawaiian and Other
Pacific Islander alone - 230.1%Asian alone
- 220.1%American Indian and Alaska Native alone
- 200.09%Some other race alone

| Median resident age: | 48.1 years |
| Virginia median age: | 39.0 years |
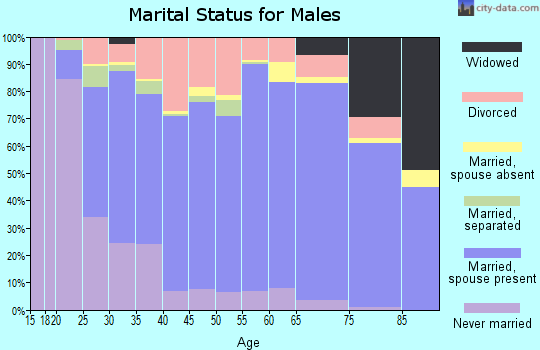
| Males: 11,032 | |
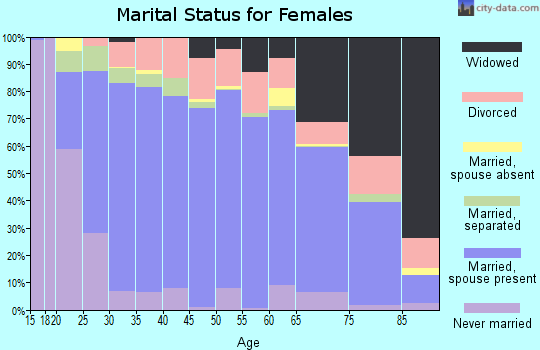
| Females: 10,651 |

 | Census Releases New CDPs for Virginia, 2020-2030 (5 replies) |
| Outside of the 10% elite, does the typical NOVA resident have a high standard of living? (120 replies) |
| Do you believe that VA feels like a police state? (106 replies) |
| VA Pics (256 replies) |
| Must see attractions in Virginia? (17 replies) |
| Very Interesting! "Washington, D.C. favorite area for wealthy young" (34 replies) |
| Scott County: | 2.0 people |
| Virginia: | 3 people |
Estimated median household income in 2022: $43,832 ($27,339 in 1999)
| This county: | $43,832 |
| Virginia: | $85,873 |
Median contract rent in 2022 for apartments: $424 (lower quartile is $282, upper quartile is $540)
| This county: | $424 |
| State: | $1270 |
Estimated median house or condo value in 2022: $131,622 (it was $62,500 in 2000)
| Scott: | $131,622 |
| Virginia: | $365,700 |
Median monthly housing costs for homes and condos with a mortgage: $1,071
Median monthly housing costs for units without a mortgage: $325
Institutionalized population: 628
Crime in 2021 (reported by the sheriff's office or county police, not the county total):
- Murders: 0
- Rapes: 8
- Robberies: 1
- Assaults: 27
- Burglaries: 52
- Thefts: 165
- Auto thefts: 28
Crime in 2020 (reported by the sheriff's office or county police, not the county total):
- Murders: 2
- Rapes: 9
- Robberies: 4
- Assaults: 22
- Burglaries: 70
- Thefts: 140
- Auto thefts: 23
Health of residents in Scott County based on CDC Behavioral Risk Factor Surveillance System Survey Questionnaires from 2013 to 2021:
General health status score of residents in this county from 1 (poor) to 5 (excellent) is 3.1. This is significantly worse than average.62.8% of residents exercised in the past month. This is less than average.
49.8% of residents smoked 100+ cigarettes in their lives. This is about average.
29.2% of adult residents drank alcohol in the past 30 days. This is less than average.
60.7% of residents visited a dentist within the past year. This is less than average.
Average weight of males is 204 pounds. This is more than average.
Average weight of females is 165 pounds. This is about average.
Single-family new house construction building permits:
- 2022: 25 buildings, average cost: $244,400
- 2021: 32 buildings, average cost: $239,200
- 2020: 16 buildings, average cost: $172,900
- 2019: 13 buildings, average cost: $172,900
- 2018: 21 buildings, average cost: $138,300
- 2017: 30 buildings, average cost: $149,000
- 2016: 20 buildings, average cost: $115,800
- 2015: 25 buildings, average cost: $107,200
- 2014: 15 buildings, average cost: $99,000
- 2013: 29 buildings, average cost: $104,900
- 2012: 29 buildings, average cost: $127,800
- 2011: 24 buildings, average cost: $96,000
- 2010: 29 buildings, average cost: $125,100
- 2009: 36 buildings, average cost: $129,000
- 2008: 35 buildings, average cost: $148,100
- 2007: 35 buildings, average cost: $144,600
- 2006: 48 buildings, average cost: $133,300
- 2005: 51 buildings, average cost: $112,000
- 2004: 67 buildings, average cost: $101,900
- 2003: 90 buildings, average cost: $99,600
- 2002: 72 buildings, average cost: $86,500
- 2001: 71 buildings, average cost: $89,500
- 2000: 67 buildings, average cost: $68,100
- 1999: 75 buildings, average cost: $73,600
- 1998: 72 buildings, average cost: $106,500
- 1997: 80 buildings, average cost: $72,700


Median real estate property taxes paid for housing units with mortgages in 2022: $957 (0.6%)
Median real estate property taxes paid for housing units with no mortgage in 2022: $772 (0.6%)


| Scott County: | 18.0% |
| Virginia: | 10.6% |
Median age of residents in 2022: 48.1 years old
(Males: 46.2 years old, Females: 50.2 years old)
(Median age for: White residents: 48.6 years old, Black residents: 33.5 years old, Asian residents: 26.9 years old, Hispanic or Latino residents: 23.2 years old)
Area name: Kingsport-Bristol-Bristol, TN-VA MSA
Fair market rent in 2006 for a 1-bedroom apartment in Scott County is $389 a month.
Fair market rent for a 2-bedroom apartment is $483 a month.
Fair market rent for a 3-bedroom apartment is $647 a month.
Cities in this county include: Gate City, Weber City, Nickelsville, Dungannon, Clinchport, Duffield.
Neighboring counties: Delaware County, Oklahoma  , Cumberland County, Kentucky , Robertson County, Tennessee , Wise County
  , Todd County, Kentucky .
| Here: | 2.8% |
| Virginia: | 2.7% |


Current college students: 634
People 25 years of age or older with a high school degree or higher: 83.0%
People 25 years of age or older with a bachelor's degree or higher: 13.9%
Number of foreign born residents: 94 (32.7% naturalized citizens)
| Scott County: | 0.4% |
| Whole state: | 12.7% |

- Year of entry for the foreign-born population
- 362010 or later
- 312000 to 2009
- 181990 to 1999
- 141980 to 1989
- 121970 to 1979
- 19Before 1970
Mean travel time to work (commute): minutes
Percentage of county residents living and working in this county: 50.3%
Housing units in structures:
- One, detached: 8,934
- One, attached: 212
- Two: 50
- 3 or 4: 67
- 5 to 9: 125
- 10 to 19: 99
- 20 to 49: 72
- 50 or more: 11
- Mobile homes: 2,312
- Boats, RVs, vans, etc.: 8
Housing units in Scott County with a mortgage: 2,331 (141 second mortgage, 0 home equity loan, 102 both second mortgage and home equity loan)
Houses without a mortgage: 76
| Here: | 2.6% with mortgage |
| State: | 97.2% with mortgage |
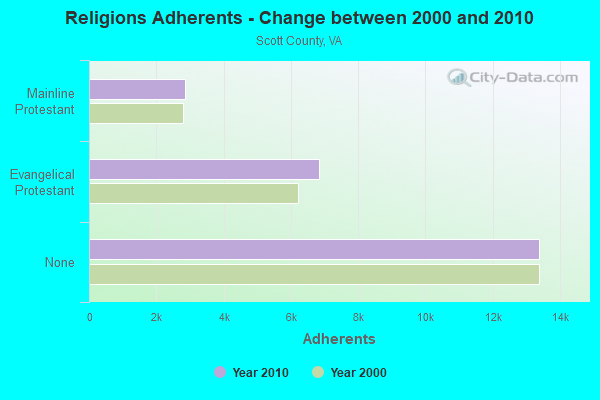
Religion statistics for Scott County
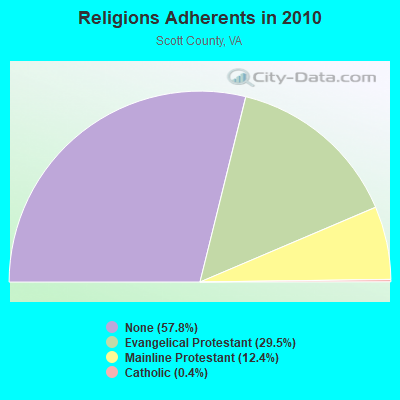
| Religion | Adherents | Congregations |
|---|---|---|
| Evangelical Protestant | 6,844 | 42 |
| Mainline Protestant | 2,863 | 26 |
| Catholic | 82 | 2 |
| Other | 1 | 1 |
| None | 13,387 | - |
Source: Clifford Grammich, Kirk Hadaway, Richard Houseal, Dale E.Jones, Alexei Krindatch, Richie Stanley and Richard H.Taylor. 2012. 2010 U.S.Religion Census: Religious Congregations & Membership Study. Association of Statisticians of American Religious Bodies. Jones, Dale E., et al. 2002. Congregations and Membership in the United States 2000. Nashville, TN: Glenmary Research Center.
Food Environment Statistics:
| Scott County: | 2.18 / 10,000 pop. |
| State: | 2.03 / 10,000 pop. |
| This county: | 1.31 / 10,000 pop. |
| Virginia: | 1.43 / 10,000 pop. |
| Scott County: | 12.23 / 10,000 pop. |
| Virginia: | 4.03 / 10,000 pop. |
| This county: | 2.62 / 10,000 pop. |
| State: | 7.65 / 10,000 pop. |
| Scott County: | 10.6% |
| Virginia: | 9.3% |
| Scott County: | 29.6% |
| State: | 26.7% |
| Here: | 15.4% |
| State: | 18.6% |
Agriculture in Scott County:
Average size of farms: 106 acresAverage value of agricultural products sold per farm: $8,518
Average value of crops sold per acre for harvested cropland: $257.57
The value of nursery, greenhouse, floriculture, and sod as a percentage of the total market value of agricultural products sold: 1.31%
The value of livestock, poultry, and their products as a percentage of the total market value of agricultural products sold: 46.26%
Average total farm production expenses per farm: $7,237
Harvested cropland as a percentage of land in farms: 16.79%
Irrigated harvested cropland as a percentage of land in farms: 2.04%
Average market value of all machinery and equipment per farm: $27,307
The percentage of farms operated by a family or individual: 96.11%
Average age of principal farm operators: 55 years
Average number of cattle and calves per 100 acres of all land in farms: 17.01
Milk cows as a percentage of all cattle and calves: 1.27%
Corn for grain: 154 harvested acres
All wheat for grain: 67 harvested acres
Vegetables: 281 harvested acres
Land in orchards: 35 acres
Earthquake activity:
Scott County-area historical earthquake activity is significantly above Virginia state average. It is 30% greater than the overall U.S. average.On 8/9/2020 at 12:07:37, a magnitude 5.1 (5.1 MW, Depth: 4.7 mi, Class: Moderate, Intensity: VI - VII) earthquake occurred 84.8 miles away from Scott County center
On 7/27/1980 at 18:52:21, a magnitude 5.2 (5.1 MB, 4.7 MS, 5.0 UK, 5.2 UK) earthquake occurred 127.8 miles away from the county center
On 8/23/2011 at 17:51:04, a magnitude 5.8 (5.8 MW, Depth: 3.7 mi) earthquake occurred 269.6 miles away from the county center
On 11/30/1973 at 07:48:41, a magnitude 4.7 (4.7 MB, 4.6 ML, Class: Light, Intensity: IV - V) earthquake occurred 98.5 miles away from the county center
On 11/23/2006 at 10:42:57, a magnitude 4.3 (4.3 MB) earthquake occurred 46.7 miles away from Scott County center
On 11/2/2006 at 17:53:02, a magnitude 4.3 (4.3 MB, Depth: 0.6 mi) earthquake occurred 50.9 miles away from the county center
Magnitude types: body-wave magnitude (MB), local magnitude (ML), surface-wave magnitude (MS), moment magnitude (MW)
Most recent natural disasters:
- Virginia Covid-19 Pandemic, Incident Period: January 20, 2020, Major Disaster (Presidential) Declared DR-4512-VA: April 2, 2020, FEMA Id: 4512, Natural disaster type: Other
- Virginia Hurricane Sandy, Incident Period: October 26, 2012 to November 01, 2012, Emergency Declared EM-3359: October 29, 2012, FEMA Id: 3359, Natural disaster type: Hurricane
- Virginia Severe Winter Storm and Snowstorm, Incident Period: December 18, 2009 to December 20, 2009, Major Disaster (Presidential) Declared DR-1874: February 16, 2010, FEMA Id: 1874, Natural disaster type: Snowstorm, Winter Storm
- Virginia Hurricane Katrina Evacuation, Incident Period: August 29, 2005 to October 01, 2005, Emergency Declared EM-3240: September 12, 2005, FEMA Id: 3240, Natural disaster type: Hurricane
- Virginia Severe Winter Storm, Snowfall, Heavy Rain, Flooding, and Mudslides, Incident Period: February 15, 2003 to February 28, 2003, Major Disaster (Presidential) Declared DR-1458: March 27, 2003, FEMA Id: 1458, Natural disaster type: Winter Storm, Mudslide, Flood, Heavy Rain, Snowfall
- Virginia Severe Storms and Tornado, Incident Period: April 28, 2002 to May 03, 2002, Major Disaster (Presidential) Declared DR-1411: May 05, 2002, FEMA Id: 1411, Natural disaster type: Storm, Tornado
- Virginia Storms and Flooding, Incident Period: March 17, 2002 to March 20, 2002, Major Disaster (Presidential) Declared DR-1406: April 02, 2002, FEMA Id: 1406, Natural disaster type: Storm, Flood
- Virginia Far Southwest Fire Complex, Incident Period: November 14, 2001 to December 09, 2001, Fire Management Assistance Declared: November 16, 2001, FEMA Id: 2390, Natural disaster type: Fire
- Virginia Severe Storms and Flooding, Incident Period: July 08, 2001 to August 27, 2001, Major Disaster (Presidential) Declared DR-1386: July 12, 2001, FEMA Id: 1386, Natural disaster type: Storm, Flood
- Virginia Winter Storm, Incident Period: January 25, 2000 to January 30, 2000, Major Disaster (Presidential) Declared DR-1318: February 28, 2000, FEMA Id: 1318, Natural disaster type: Winter Storm
- 4 other natural disasters have been reported since 1953.
The number of natural disasters in Scott County (14) is near the US average (15).
Major Disasters (Presidential) Declared: 10
Emergencies Declared: 3
Causes of natural disasters: Floods: 5, Storms: 5, Winter Storms: 4, Hurricanes: 2, Blizzard: 1, Fire: 1, Heavy Rain: 1, Ice Storm: 1, Mudslide: 1, Snowfall: 1, Snowstorm: 1, Tornado: 1, Other: 1 (Note: some incidents may be assigned to more than one category).

Means of transportation to work:
- Drove a car alone: 3,933 (75.5%)
- Carpooled: 501 (9.6%)
- Bus: 25 (0.5%)
- Taxicab, motorcycle, or other means: 64 (1.2%)
- Walked: 79 (1.5%)
- Worked at home: 506 (9.7%)


- Health care and social assistance (20%)
- Educational services (12%)
- Retail trade (11%)
- Manufacturing (7%)
- Finance and insurance (6%)
- Accommodation and food services (6%)
- Public administration (5%)

- Health care and social assistance (25%)
- Educational services (15%)
- Retail trade (13%)
- Manufacturing (8%)
- Finance and insurance (8%)
- Accommodation and food services (8%)
- Public administration (6%)

- Construction and extraction occupations (13%)
- Production occupations (12%)
- Installation, maintenance, and repair occupations (10%)
- Material moving occupations (9%)
- Management occupations (8%)
- Transportation occupations (7%)
- Office and administrative support occupations (5%)

- Office and administrative support occupations (16%)
- Sales and related occupations (12%)
- Educational instruction, and library occupations (11%)
- Food preparation and serving related occupations (9%)
- Health diagnosing and treating practitioners and other technical occupations (8%)
- Management occupations (7%)
- Business and financial operations occupations (5%)

- Canada (27%)
- Ukraine (15%)
- Philippines (12%)
- Turkey (11%)
- Korea (9%)
- England (6%)
- Haiti (4%)

- American (56%)
- English (11%)
- Irish (6%)
- Scotch-Irish (3%)
- German (3%)
- European (2%)
- Scottish (1%)


People in group quarters in Scott County, Virginia in 2010:
- 450 people in local jails and other municipal confinement facilities
- 178 people in nursing facilities/skilled-nursing facilities
- 15 people in group homes intended for adults
- 9 people in residential treatment centers for adults
People in group quarters in Scott County, Virginia in 2000:
- 171 people in nursing homes
- 134 people in other group homes
- 33 people in local jails and other confinement facilities (including police lockups)
- 5 people in other noninstitutional group quarters
5.93% of this county's 2021 resident taxpayers lived in other counties in 2020 ($46,714 average adjusted gross income)
| Here: | 5.93% |
| Virginia average: | 10.16% |
10 or fewer of this county's residents moved from foreign countries.
1.77% relocated from other counties in Virginia ($13,785 average AGI)
4.16% relocated from other states ($32,929 average AGI)
Scott County: 4.16% Virginia average: 3.91%

Top counties from which taxpayers relocated into this county between 2020 and 2021:
| from Sullivan County, TN | |
| from Hawkins County, TN | |
| from Wise County, VA | |
| from Lee County, VA |
5.13% of this county's 2020 resident taxpayers moved to other counties in 2021 ($37,863 average adjusted gross income)
| Here: | 5.13% |
| Virginia average: | 10.20% |
10 or fewer of this county's residents moved to foreign countries.
1.55% relocated to other counties in Virginia ($10,615 average AGI)
3.58% relocated to other states ($27,245 average AGI)
Scott County: 3.58% Virginia average: 3.98%

Top counties to which taxpayers relocated from this county between 2020 and 2021:
| to Sullivan County, TN | |
| to Hawkins County, TN | |
| to Lee County, VA | |
| to Washington County, TN |
Births per 1000 population from 1990 to 1999: 10.5
Births per 1000 population from 2000 to 2006: 10.0

Deaths per 1000 population from 1990 to 1999: 12.6
Deaths per 1000 population from 2000 to 2009: 13.2
Deaths per 1000 population from 2010 to 2020: 14.8

Infant deaths per 1000 live births from 1990 to 1999: 6.4
Infant deaths per 1000 live births from 2000 to 2006: 9.4

Persons under 19 years old without health insurance coverage in 2018: 4.7%


Persons enrolled in hospital insurance and/or supplemental medical insurance (Medicare) in July 1, 2007: 5,783 (4,141 aged, 1,642 disabled)
Children under 18 without health insurance coverage in 2007: 238 (5%)


Most common underlying causes of death in Scott County, Virginia in 1999 - 2019:
- Bronchus or lung, unspecified - Malignant neoplasms (474)
- Acute myocardial infarction, unspecified (420)
- Atherosclerotic heart disease (383)
- Chronic obstructive pulmonary disease, unspecified (329)
- Unspecified dementia (181)
- Alzheimer disease, unspecified (166)
- Atherosclerotic cardiovascular disease, so described (160)
- Stroke, not specified as haemorrhage or infarction (101)
- Pneumonia, unspecified (24)
- Unspecified diabetes mellitus, without complications (21)
Population without health insurance coverage in 2000: 12%
Children under 18 without health insurance coverage in 2000: 6%
Medical specialist MDs per 100,000 population in 2005: 1,407
Dentists per 100,000 population in 1998: 4
Total births per 100,000 population, July 2005 - July 2006 : 13
Total deaths per 100,000 population, July 2005 - July 2006: 39
Limited-service eating places per 100,000 population in 2005 : 4
Crimes per 100,000 population in 1996: 1
Suicides per 1,000,000 population from 2000 to 2006: 211.6. This is more than state average.

- Firearm - 186.7
- Other - 24.9
Household type by relationship:
Households: 21,683- Male householders: 4,564 (1,532 living alone), Female householders: 4,516 (1,653 living alone)
4,195 spouses (4,159 opposite-sex spouses), 427 unmarried partners, (424 opposite-sex unmarried partners), 5,579 children (5,013 natural, 277 adopted, 266 stepchildren), 485 grandchildren, 354 brothers or sisters, 226 parents, 38 foster children, 239 other relatives, 329 non-relatives
- In group quarters: 750
Size of family households: 3,197 2-persons, 1,015 3-persons, 832 4-persons, 268 5-persons, 184 6-persons, 87 7-or-more-persons.
Size of nonfamily households: 3,185 1-person, 280 2-persons, 38 3-persons, 12 4-persons.
2,238 married couples with children.
914 single-parent households (50 men, 864 women).
99.3% of residents of Scott speak English at home.
0.2% of residents speak Spanish at home (63% speak English very well, 37% speak English well).
0.3% of residents speak other Indo-European language at home (69% speak English very well, 31% speak English well).
0.2% of residents speak Asian or Pacific Island language at home (75% speak English very well, 25% speak English well).
0.1% of residents speak other language at home (100% speak English very well).
In fiscal year 2004:
Federal Government expenditure: $168,365,000 ($7,326 per capita)
Department of Defense expenditure: $8,484,000
Federal direct payments to individuals for retirement and disability: $75,587,000
Federal other direct payments to individuals: $36,781,000
Federal direct payments not to individuals: $2,790,000
Federal grants: $41,872,000
Federal procurement contracts: $943,000 ($0,000 Department of Defense)
Federal salaries and wages: $10,392,000 ($6,978,000 Department of Defense)
Federal Government direct loans: $2,207,000
Federal guaranteed/insured loans: $12,947,000
Federal Government insurance: $9,945,000
Population change from April 1, 2000 to July 1, 2005:
Births: 1,146| Here: | 50 per 1000 residents |
| State: | 70 per 1000 residents |
Deaths: 1,540
| Here: | 67 per 1000 residents |
| State: | 40 per 1000 residents |
Net international migration: +16
| Here: | +1 per 1000 residents |
| State: | +18 per 1000 residents |
Net internal migration: -39
| Here: | |
| State: |

Total withdrawal of fresh water for public supply: 1.06 millions of gallons per day (all from surface)
| Here: | 6.2 |
| State: | 7.0 |
| Here: | 5.0 |
| State: | 4.3 |

- Year house built in Scott County, Virginia
- 62020 or later
- 7402010 to 2019
- 1,3702000 to 2009
- 1,4491990 to 1999
- 1,5811980 to 1989
- 1,4211970 to 1979
- 1,4001960 to 1969
- 1,6361950 to 1959
- 6631940 to 1949
- 1,5071939 or earlier

- Rooms in owner-occupied houses in Scott County, Virginia
- 501 room
- 322 rooms
- 1313 rooms
- 6234 rooms
- 1,6215 rooms
- 1,6296 rooms
- 1,4257 rooms
- 9608 rooms
- 6919+ rooms

- Rooms in renter-occupied apartments in Scott County, Virginia
- 761 room
- 512 rooms
- 933 rooms
- 4734 rooms
- 4595 rooms
- 2656 rooms
- 2837 rooms
- 1298 rooms
- 699+ rooms

- Bedrooms in owner-occupied houses in Scott County, Virginia
- 66no bedroom
- 1381 bedroom
- 1,5162 bedrooms
- 4,4383 bedrooms
- 7714 bedrooms
- 2405+ bedrooms

- Bedrooms in renter-occupied apartments in Scott County, Virginia
- 77no bedroom
- 2121 bedroom
- 6702 bedrooms
- 7563 bedrooms
- 1404 bedrooms
- 525+ bedrooms

- Cars and other vehicles available in Scott County in owner-occupied houses/condos
- 404no vehicle
- 1,6451 vehicle
- 2,7122 vehicles
- 1,5463 vehicles
- 6134 vehicles
- 2705+ vehicles

- Cars and other vehicles available in Scott County in renter-occupied apartments
- 379no vehicle
- 7731 vehicle
- 5972 vehicles
- 1203 vehicles
- 414 vehicles
- 25+ vehicles
93.7% of Scott County residents lived in the same house 1 years ago.
Out of people who lived in different houses, 29% lived in this county.
Out of people who lived in different counties, 55% lived in Virginia.
| Scott County: | 93.7% |
| State average: | 86.6% |
Place of birth for U.S.-born residents:
- This state: 6,840
- Other state: 14,687
- Northeast: 412
- Midwest: 870
- South: 13,106
- West: 219


- 85.3%Electricity
- 6.0%Bottled, tank, or LP gas
- 3.6%Wood
- 3.3%Fuel oil, kerosene, etc.
- 1.2%Coal or coke
- 0.3%Utility gas
- 0.2%No fuel used
- 0.1%Other fuel

- 91.0%Electricity
- 3.2%Bottled, tank, or LP gas
- 3.2%Wood
- 1.4%Coal or coke
- 0.9%Fuel oil, kerosene, etc.
- 0.2%Utility gas
Private vs. public school enrollment:
| Here: | 5.9% |
| Virginia: | 13.2% |
| Here: | 8.9% |
| Virginia: | 10.2% |
| Here: | 18.4% |
| Virginia: | 18.7% |


Scott County government finances - Expenditure in 2017:
- Bond Funds - Cash and Securities: $326,000
- Charges - Elementary and Secondary Education School Lunch: $638,000
Elementary and Secondary Education School Tuition and Transportation: $34,000
Elementary and Secondary Education - Other: $5,000
- Current Operations - Elementary and Secondary Education: $34,979,000
Health - Other: $4,522,000
Police Protection: $3,723,000
Correctional Institutions: $2,110,000
Housing and Community Development: $1,446,000
Judicial and Legal Services: $1,350,000
Solid Waste Management: $1,317,000
Financial Administration: $1,161,000
General - Other: $820,000
Central Staff Services: $774,000
Local Fire Protection: $609,000
General Public Buildings: $479,000
Parks and Recreation: $310,000
Libraries: $209,000
Protective Inspection and Regulation - Other: $86,000
- Federal Intergovernmental - Other: $2,542,000
Education: $17,000
- General - Interest on Debt: $138,000
- Intergovernmental to Local - Other - Elementary and Secondary Education: $28,000
- Local Intergovernmental - Education: $367,000
- Long Term Debt - Outstanding Unspecified Public Purpose: $3,787,000
Beginning Outstanding - Unspecified Public Purpose: $3,460,000
Issue, Unspecified Public Purpose: $646,000
Retired Unspecified Public Purpose: $319,000
- Miscellaneous - General Revenue - Other: $796,000
Fines and Forfeits: $216,000
Interest Earnings: $107,000
Sale of Property: $1,000
- Other Capital Outlay - Elementary and Secondary Education: $1,437,000
- Other Funds - Cash and Securities: $3,727,000
- State Intergovernmental - Education: $30,551,000
Other: $5,186,000
- Tax - Property: $11,908,000
General Sales and Gross Receipts: $1,428,000
Public Utilities Sales: $1,207,000
Motor Vehicle License: $485,000
Documentary and Stock Transfer: $134,000
Other License: $67,000
Severance: $4,000
Other Selective Sales: $3,000
- Total Salaries and Wages: $23,388,000
Scott County government finances - Revenue in 2017:
- Bond Funds - Cash and Securities: $326,000
- Charges - Elementary and Secondary Education School Lunch: $638,000
Elementary and Secondary Education School Tuition and Transportation: $34,000
Elementary and Secondary Education - Other: $5,000
- Current Operations - Elementary and Secondary Education: $34,979,000
Health - Other: $4,522,000
Police Protection: $3,723,000
Correctional Institutions: $2,110,000
Housing and Community Development: $1,446,000
Judicial and Legal Services: $1,350,000
Solid Waste Management: $1,317,000
Financial Administration: $1,161,000
General - Other: $820,000
Central Staff Services: $774,000
Local Fire Protection: $609,000
General Public Buildings: $479,000
Parks and Recreation: $310,000
Libraries: $209,000
Protective Inspection and Regulation - Other: $86,000
- Federal Intergovernmental - Other: $2,542,000
Education: $17,000
- General - Interest on Debt: $138,000
- Intergovernmental to Local - Other - Elementary and Secondary Education: $28,000
- Local Intergovernmental - Education: $367,000
- Long Term Debt - Outstanding Unspecified Public Purpose: $3,787,000
Beginning Outstanding - Unspecified Public Purpose: $3,460,000
Issue, Unspecified Public Purpose: $646,000
Retired Unspecified Public Purpose: $319,000
- Miscellaneous - General Revenue - Other: $796,000
Fines and Forfeits: $216,000
Interest Earnings: $107,000
Sale of Property: $1,000
- Other Capital Outlay - Elementary and Secondary Education: $1,437,000
- Other Funds - Cash and Securities: $3,727,000
- State Intergovernmental - Education: $30,551,000
Other: $5,186,000
- Tax - Property: $11,908,000
General Sales and Gross Receipts: $1,428,000
Public Utilities Sales: $1,207,000
Motor Vehicle License: $485,000
Documentary and Stock Transfer: $134,000
Other License: $67,000
Severance: $4,000
Other Selective Sales: $3,000
- Total Salaries and Wages: $23,388,000
Scott County government finances - Debt in 2017:
- Bond Funds - Cash and Securities: $326,000
- Charges - Elementary and Secondary Education School Lunch: $638,000
Elementary and Secondary Education School Tuition and Transportation: $34,000
Elementary and Secondary Education - Other: $5,000
- Current Operations - Elementary and Secondary Education: $34,979,000
Health - Other: $4,522,000
Police Protection: $3,723,000
Correctional Institutions: $2,110,000
Housing and Community Development: $1,446,000
Judicial and Legal Services: $1,350,000
Solid Waste Management: $1,317,000
Financial Administration: $1,161,000
General - Other: $820,000
Central Staff Services: $774,000
Local Fire Protection: $609,000
General Public Buildings: $479,000
Parks and Recreation: $310,000
Libraries: $209,000
Protective Inspection and Regulation - Other: $86,000
- Federal Intergovernmental - Other: $2,542,000
Education: $17,000
- General - Interest on Debt: $138,000
- Intergovernmental to Local - Other - Elementary and Secondary Education: $28,000
- Local Intergovernmental - Education: $367,000
- Long Term Debt - Outstanding Unspecified Public Purpose: $3,787,000
Beginning Outstanding - Unspecified Public Purpose: $3,460,000
Issue, Unspecified Public Purpose: $646,000
Retired Unspecified Public Purpose: $319,000
- Miscellaneous - General Revenue - Other: $796,000
Fines and Forfeits: $216,000
Interest Earnings: $107,000
Sale of Property: $1,000
- Other Capital Outlay - Elementary and Secondary Education: $1,437,000
- Other Funds - Cash and Securities: $3,727,000
- State Intergovernmental - Education: $30,551,000
Other: $5,186,000
- Tax - Property: $11,908,000
General Sales and Gross Receipts: $1,428,000
Public Utilities Sales: $1,207,000
Motor Vehicle License: $485,000
Documentary and Stock Transfer: $134,000
Other License: $67,000
Severance: $4,000
Other Selective Sales: $3,000
- Total Salaries and Wages: $23,388,000
Scott County government finances - Cash and Securities in 2017:
- Bond Funds - Cash and Securities: $326,000
- Charges - Elementary and Secondary Education School Lunch: $638,000
Elementary and Secondary Education School Tuition and Transportation: $34,000
Elementary and Secondary Education - Other: $5,000
- Current Operations - Elementary and Secondary Education: $34,979,000
Health - Other: $4,522,000
Police Protection: $3,723,000
Correctional Institutions: $2,110,000
Housing and Community Development: $1,446,000
Judicial and Legal Services: $1,350,000
Solid Waste Management: $1,317,000
Financial Administration: $1,161,000
General - Other: $820,000
Central Staff Services: $774,000
Local Fire Protection: $609,000
General Public Buildings: $479,000
Parks and Recreation: $310,000
Libraries: $209,000
Protective Inspection and Regulation - Other: $86,000
- Federal Intergovernmental - Other: $2,542,000
Education: $17,000
- General - Interest on Debt: $138,000
- Intergovernmental to Local - Other - Elementary and Secondary Education: $28,000
- Local Intergovernmental - Education: $367,000
- Long Term Debt - Outstanding Unspecified Public Purpose: $3,787,000
Beginning Outstanding - Unspecified Public Purpose: $3,460,000
Issue, Unspecified Public Purpose: $646,000
Retired Unspecified Public Purpose: $319,000
- Miscellaneous - General Revenue - Other: $796,000
Fines and Forfeits: $216,000
Interest Earnings: $107,000
Sale of Property: $1,000
- Other Capital Outlay - Elementary and Secondary Education: $1,437,000
- Other Funds - Cash and Securities: $3,727,000
- State Intergovernmental - Education: $30,551,000
Other: $5,186,000
- Tax - Property: $11,908,000
General Sales and Gross Receipts: $1,428,000
Public Utilities Sales: $1,207,000
Motor Vehicle License: $485,000
Documentary and Stock Transfer: $134,000
Other License: $67,000
Severance: $4,000
Other Selective Sales: $3,000
- Total Salaries and Wages: $23,388,000
Supplemental Security Income (SSI) in 2006:
- Total number of recipients: 1,423
- Number of aged recipients: 169
- Number of blind and disabled recipients: 1,254
- Number of recipients under 18: 86
- Number of recipients between 18 and 64: 912
- Number of recipients older than 64: 425
- Number of recipients also receiving OASDI: 656
- Amount of payments (thousands of dollars): 571
| Most common first names in Scott County, VA among deceased individuals | ||
| Name | Count | Lived (average) |
|---|---|---|
| James | 171 | 73.4 years |
| William | 151 | 74.8 years |
| Mary | 125 | 79.1 years |
| John | 120 | 72.5 years |
| Robert | 109 | 72.4 years |
| Charles | 103 | 71.6 years |
| George | 60 | 73.4 years |
| Roy | 51 | 72.7 years |
| Henry | 46 | 75.8 years |
| Myrtle | 40 | 82.1 years |
| Most common last names in Scott County, VA among deceased individuals | ||
| Last name | Count | Lived (average) |
|---|---|---|
| Lane | 136 | 74.2 years |
| Williams | 113 | 74.7 years |
| Smith | 89 | 74.2 years |
| Taylor | 80 | 75.0 years |
| Mcconnell | 76 | 77.1 years |
| Peters | 66 | 74.8 years |
| Quillen | 60 | 75.5 years |
| Jones | 60 | 75.5 years |
| Addington | 54 | 78.8 years |
| Kilgore | 54 | 77.0 years |
| Businesses in Scott County, VA | ||||
| Name | Count | Name | Count | |
|---|---|---|---|---|
| Burger King | 1 | Lane Furniture | 1 | |
| Curves | 1 | New Balance | 1 | |
| La-Z-Boy | 1 | Wendy's | 1 | |
Scott County on our top lists:
- #84 on the list of "Top 101 counties with the lowest percentage of residents relocating from other counties between 2010 and 2011"
- #99 on the list of "Top 101 counties with the smallest number of children under 18 without health insurance coverage in 2000"