Hondo: Fire Incidents, Texas (TX)
Where are fire incidents reported in Hondo, TX
Something went wrong! Please refresh the page.
|
| |||||||||||||||||||||||||||||||||||||||||||||||||||||||||||||||||||||||||||||||||||||||||||||||||||||||||||||
2002 - 2018 National Fire Incident Reporting System (NFIRS) incidents
- Incident types reported to NFIRS in Hondo, TX
- 38669.1%Fire
- 9016.1%Hazardous Condition
- 264.7%Good Intent Call
- 234.1%Rescue & EMS
- 162.9%Service Call
- 122.1%False Alarm
- 30.5%Special Incident
- 20.4%Severe Weather
- 10.2%Overpressure Rupture
- Fire incident types reported to NFIRS in Hondo, TX
- 23961.9%Outside Fires
- 9524.6%Structure Fires
- 348.8%Mobile Property/Vehicle Fires
- 184.7%Other
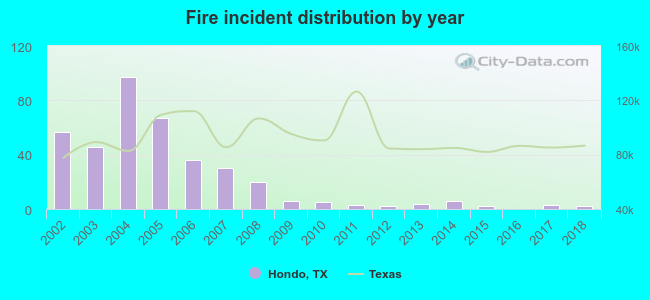 Based on the data from the years 2002 - 2018 the average number of fire incidents per year is 23. The highest number of reported fire incidents - 97 took place in 2004, and the least - 0 in 2016. The data has a declining trend.
The average number of yearly fire incidents per 10k residents in Hondo, TX compared to nearest cities:
(Note: Based on data for the last 3 years, including only cities with population 5,000 and above)
| Hondo: | 2.8 |
| Lakehills: | 36.2 |
| Helotes: | 33.9 |
| Pearsall: | 80.5 |
| Leon Valley: | 37.2 |
| San Antonio: | 25.7 |
| Boerne: | 118.2 |
| Uvalde: | 11.6 |
| Fair Oaks Ranch: | 18.3 |
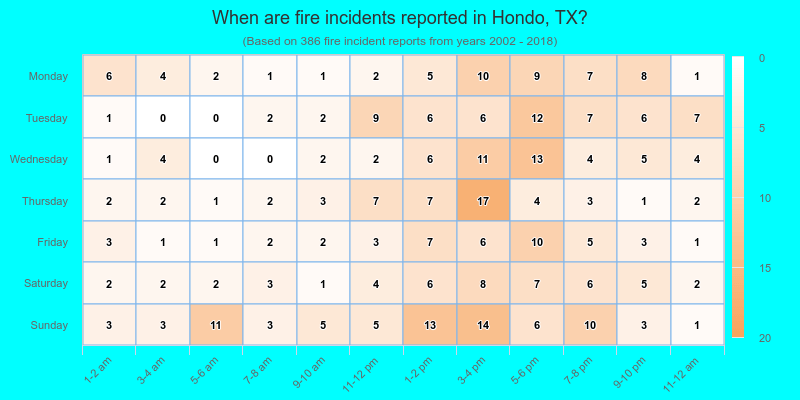
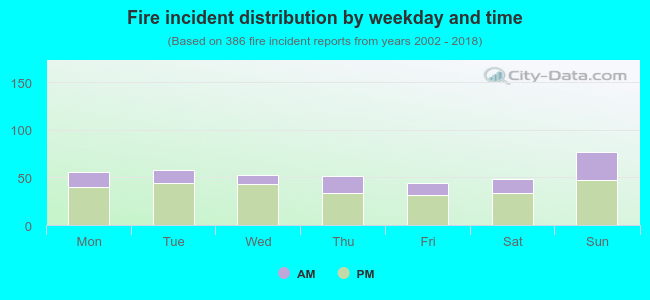 29.0% incidents where reported in the morning and 71.0% in the evening. The most fires (19.9%) took place on Sunday, and the least (11.4%) on Friday.
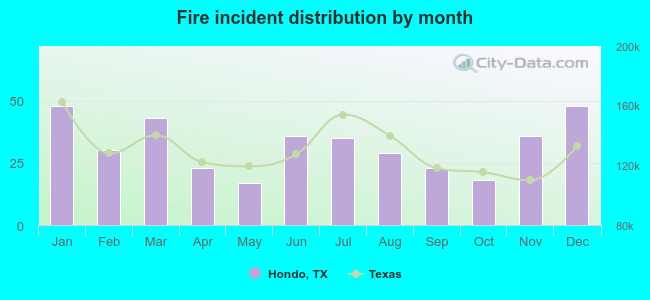 Based on the 386 fires from years 2002 - 2018 most fires (12.4%) took place during January, and the least (4.4%) in May.
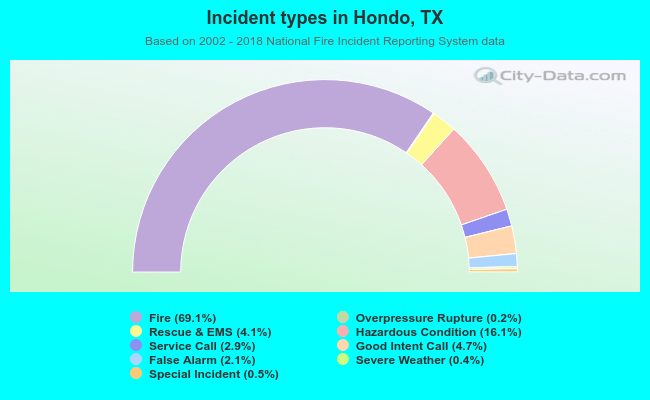 Out of all 559 cases reported during the years 2002 - 2018, the most belonged to the categories: Fire (69.1%), Hazardous Condition (16.1%), and Good Intent Call (4.7%).
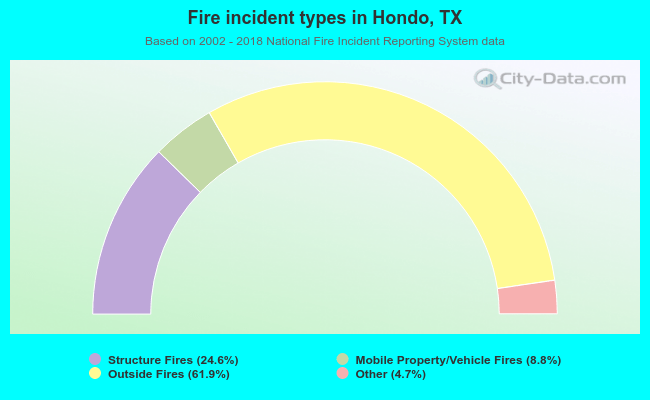 When looking into fire subcategories, the most incidents belonged to: Outside Fires (61.9%), and Structure Fires (24.6%).