Uvalde: Fire Incidents, Texas (TX)
Where are fire incidents reported in Uvalde, TX
Something went wrong! Please refresh the page.
|
| |||||||||||||||||||||||||||||||||||||||||||||||||||||||||||||||||||||||||||||||||||||||||||||||||||||||||||||
| Other | 64 | |||||||||||||||||||||||||||||||||||||||||||||||||||||||||||||||||||||||||||||||||||||||||||||||||||||||||||||
2004 - 2017 National Fire Incident Reporting System (NFIRS) incidents
- Incident types reported to NFIRS in Uvalde, TX
- 77659.3%Fire
- 33325.5%Hazardous Condition
- 957.3%Good Intent Call
- 554.2%Rescue & EMS
- 262.0%False Alarm
- 181.4%Service Call
- 40.3%Special Incident
- Fire incident types reported to NFIRS in Uvalde, TX
- 42955.3%Outside Fires
- 17222.2%Structure Fires
- 13417.3%Mobile Property/Vehicle Fires
- 415.3%Other
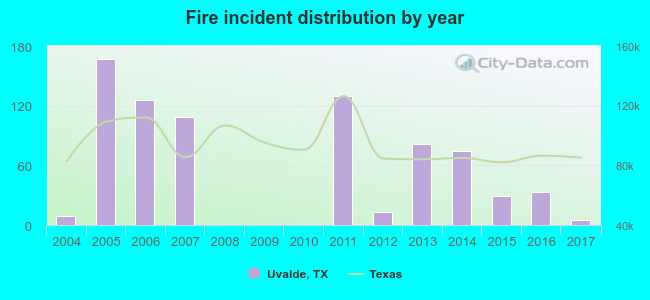 Based on the data from the years 2004 - 2017 the average number of fires per year is 55. The highest number of fire incidents - 167 took place in 2005, and the least - 0 in 2008. The data has a decreasing trend.
The average number of yearly fire incidents per 10k residents in Uvalde, TX compared to nearest cities:
(Note: Based on data for the last 3 years, including only cities with population 5,000 and above)
| Uvalde: | 11.6 |
| Hondo: | 2.8 |
| Pearsall: | 80.5 |
| Eagle Pass: | 53.3 |
| Lakehills: | 36.2 |
| Del Rio: | 39.5 |
| Kerrville: | 40.7 |
| Helotes: | 33.9 |
| Leon Valley: | 37.2 |
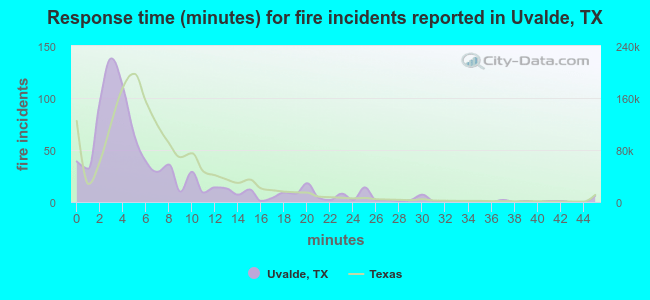 The median response time based on all reported fire incidents is 4 minutes. This is lower than the state median value.
The median response time in Uvalde, TX compared to nearest cities:
(Note: Based on data for all years, including only cities with at least 500 fire incidents)
| Uvalde: | 4 minutes |
| Pearsall: | 10 minutes |
| Dilley: | 13 minutes |
| Devine: | 12 minutes |
| Eagle Pass: | 6 minutes |
| Castroville: | 10 minutes |
| Natalia: | 10 minutes |
| Cotulla: | 13 minutes |
| Del Rio: | 5 minutes |
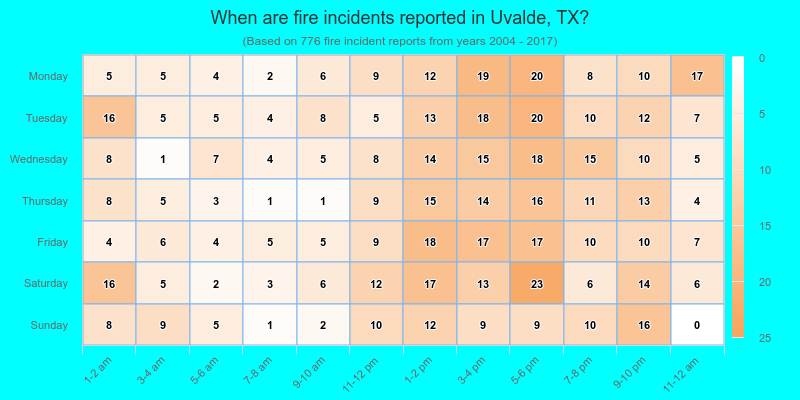
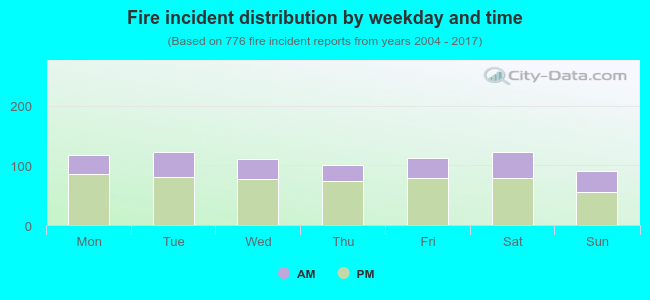 31.7% incidents where reported in the morning and 68.3% in the evening. The most fires (15.9%) took place on Tuesday, and the least (11.7%) on Sunday.
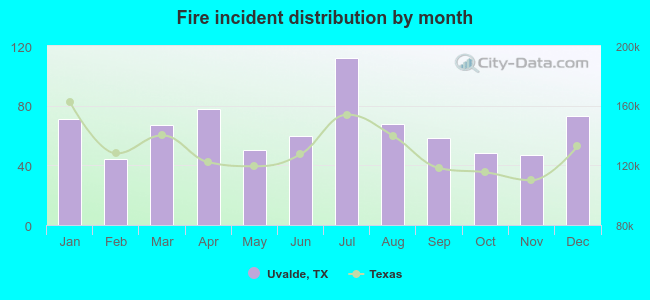 Based on the 776 incident reports from years 2004 - 2017 most fires (14.4%) took place during July, and the least (5.7%) in February.
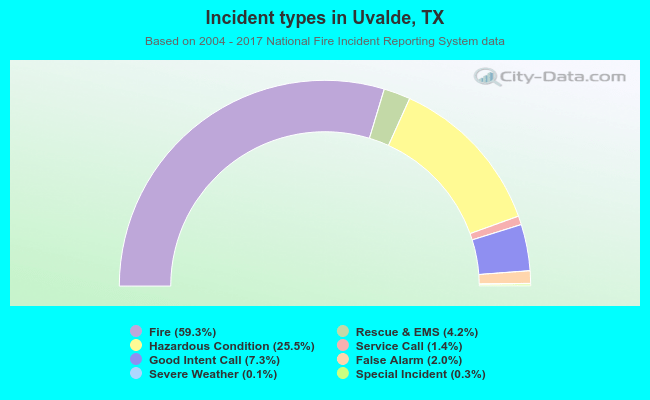 Out of all 1,308 cases reported during the years 2004 - 2017, the most belonged to the categories: Fire (59.3%), Rescue & EMS (25.5%), and Service Call (7.3%).
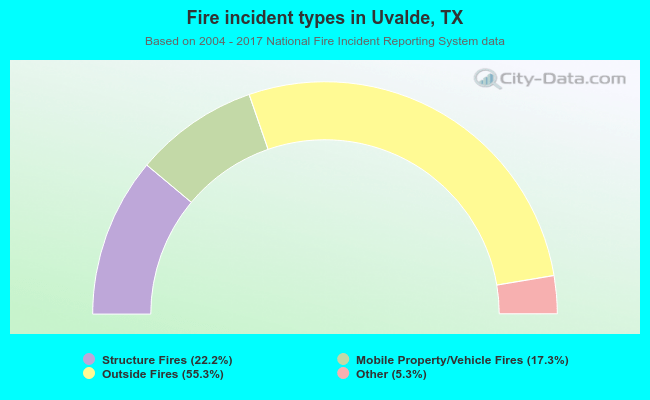 When looking into fire subcategories, the most incidents belonged to: Outside Fires (55.3%), and Structure Fires (22.2%).