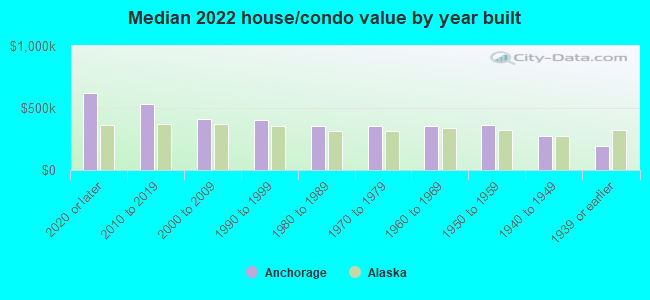
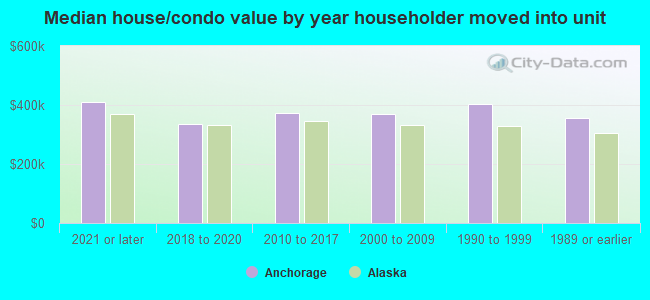
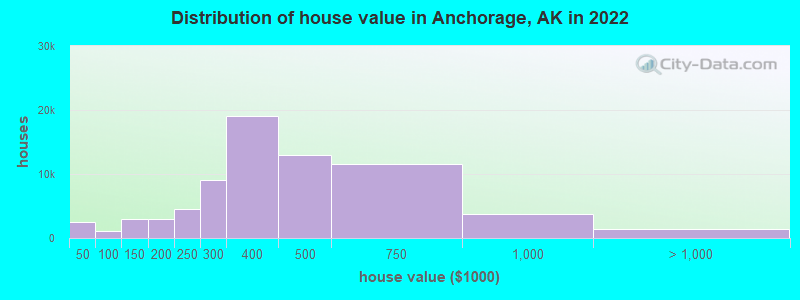
Median price asked for vacant for-sale houses and condos in 2022: $210,757.
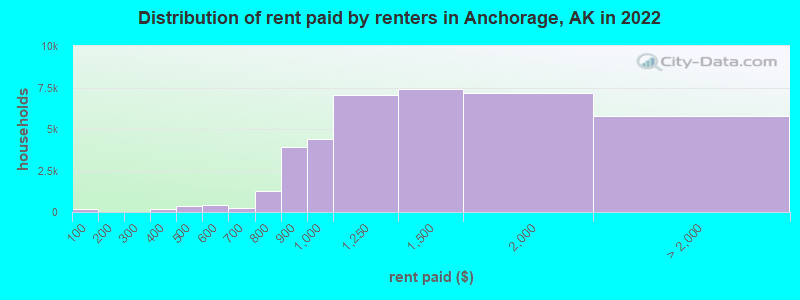
Median contract rent in 2022: $1,274 (lower quartile is $963, upper quartile is $1,687)
Median rent asked for vacant for-rent units in 2022: $1,540
Median gross rent in Anchorage, AK in 2022: $1,381
Housing units in Anchorage with a mortgage: 50,467 (2,510 second mortgage, 534 home equity loan, 1,556 both second mortgage and home equity loan) Houses without a mortgage: 1,005
Median household income for houses/condos with a mortgage: $132,687
Median household income for apartments without a mortgage: $104,155
37,825 married couples with children.
23,378 single-parent households (6,058 men, 17,320 women).
82.4% of residents of Anchorage speak English at home.
4.7% of residents speak Spanish at home (76% speak English very well, 13% speak English well, 9% speak English not well, 2% don't speak English at all).
2.6% of residents speak other Indo-European language at home (77% speak English very well, 11% speak English well, 11% speak English not well, 1% don't speak English at all).
9.0% of residents speak Asian or Pacific Island language at home (60% speak English very well, 25% speak English well, 13% speak English not well, 2% don't speak English at all).
1.6% of residents speak other language at home (76% speak English very well, 13% speak English well, 11% speak English not well).
Foreign born population: 29,742 (10.4%)
(71.7% of them are naturalized citizens)
Percentage of workers working in this county: 96.6% Number of people working at home: 17,867 (11.9% of all workers)
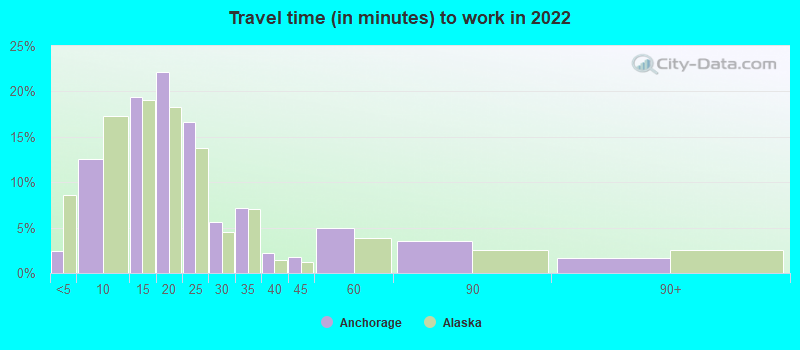
Travel time to work (commute)
Less than 5 minutes: 2,614
5 to 9 minutes: 17,512
10 to 14 minutes: 27,806
15 to 19 minutes: 30,727
20 to 24 minutes: 23,404
25 to 29 minutes: 7,652
30 to 34 minutes: 10,312
35 to 39 minutes: 3,049
40 to 44 minutes: 1,935
45 to 59 minutes: 2,989
60 to 89 minutes: 1,928
90 or more minutes: 2,804
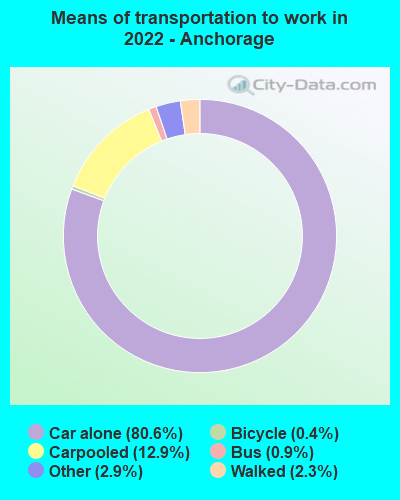
Means of transportation to work:
Drove a car alone: 114,458 (71.6%)
Carpooled: 18,317 (11.5%)
Bus: 1,274 (0.8%)
Taxi: 4,095 (2.6%)
Bicycle: 625 (0.4%)
Walked: 3,208 (2.0%)
Worked at home: 17,867 (11.2%)
Unemployment by race in 2022
Unemployment rate for White non-Hispanic residents
2.7%Males
2.5%Females
Unemployment rate for Black residents
9.2%Males
15.2%Females
Unemployment rate for American Indian and Alaska Native residents
9.1%Males
9.0%Females
Unemployment rate for Asian residents
4.7%Males
2.6%Females
Unemployment rate for other race residents
7.7%Males
7.7%Females
Unemployment rate for two or more race residents
6.7%Males
2.7%Females
Unemployment rate for Hispanic or Latino residents
3.7%Males
1.1%Females
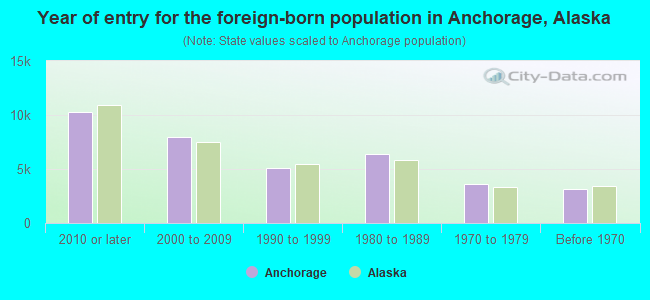
Year of entry for the foreign-born population in Anchorage, Alaska
10,2332010 or later
7,9442000 to 2009
5,0781990 to 1999
6,3571980 to 1989
3,5741970 to 1979
3,174Before 1970
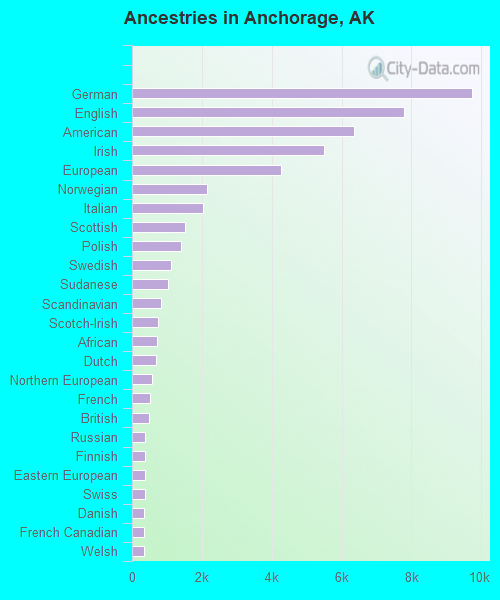
First ancestries reported:
German: 9,732 (7.4%)
English: 7,781 (5.9%)
American: 6,341 (4.8%)
Irish: 5,487 (4.2%)
European: 4,276 (3.3%)
Norwegian: 2,152 (1.6%)
Italian: 2,023 (1.5%)
Scottish: 1,527 (1.2%)
Polish: 1,398 (1.1%)
Swedish: 1,116 (0.9%)
Sudanese: 1,023 (0.8%)
Scandinavian: 834 (0.6%)
Scotch-Irish: 749 (0.6%)
African: 704 (0.5%)
Dutch: 678 (0.5%)
Northern European: 586 (0.4%)
French: 528 (0.4%)
British: 480 (0.4%)
Russian: 381 (0.3%)
Finnish: 380 (0.3%)
Eastern European: 372 (0.3%)
Swiss: 360 (0.3%)
Danish: 356 (0.3%)
French Canadian: 343 (0.3%)
Welsh: 330 (0.3%)
Czech: 319 (0.2%)
Iranian: 282 (0.2%)
Ukrainian: 276 (0.2%)
Albanian: 243 (0.2%)
Somali: 193 (0.1%)
Nigerian: 188 (0.1%)
Greek: 176 (0.1%)
Lithuanian: 170 (0.1%)
Haitian: 168 (0.1%)
Canadian: 158 (0.1%)
Serbian: 127 (0.10%)
Portuguese: 124 (0.09%)
Jamaican: 123 (0.09%)
Austrian: 121 (0.09%)
Ethiopian: 119 (0.09%)
Icelander: 114 (0.09%)
Hungarian: 102 (0.08%)
Brazilian: 95 (0.07%)
Czechoslovakian: 94 (0.07%)
Liberian: 86 (0.07%)
Slovak: 84 (0.06%)
Arab: 84 (0.06%)
German Russian: 82 (0.06%)
Zimbabwean: 81 (0.06%)
Slavic: 74 (0.06%)
Romanian: 72 (0.06%)
Egyptian: 62 (0.05%)
Bulgarian: 60 (0.05%)
Guyanese: 59 (0.05%)
South African: 58 (0.04%)
Celtic: 45 (0.03%)
Turkish: 45 (0.03%)
Belgian: 43 (0.03%)
Australian: 37 (0.03%)
Cajun: 35 (0.03%)
Slovene: 34 (0.03%)
Latvian: 31 (0.02%)
Yugoslavian: 31 (0.02%)
Lebanese: 28 (0.02%)
Kenyan: 27 (0.02%)
Trinidadian and Tobagonian: 25 (0.02%)
Croatian: 24 (0.02%)
Armenian: 18 (0.01%)
Estonian: 12 (0.01%)
Pennsylvania German: 12 (0.01%)
Palestinian: 10 (0.01%)
Moroccan: 8 (0.01%)
Most common places of birth for foreign-born residents (%):
Philippines
Anchorage:
29.5% (9,457)
Alaska:
33.1% (19,195)
Oceania, n.e.c.
Anchorage:
7.0% (2,233)
Alaska:
5.3% (3,101)
Korea
Anchorage:
6.5% (2,094)
Alaska:
5.8% (3,384)
Mexico
Anchorage:
6.1% (1,951)
Alaska:
6.6% (3,837)
Thailand
Anchorage:
5.9% (1,886)
Alaska:
3.6% (2,080)
Canada
Anchorage:
4.1% (1,307)
Alaska:
5.0% (2,924)
Laos
Anchorage:
2.8% (911)
Alaska:
2.0% (1,137)
Dominican Republic
Anchorage:
2.2% (695)
Alaska:
1.4% (840)
China, excluding Hong Kong and Taiwan
Anchorage:
1.8% (565)
Alaska:
2.2% (1,300)
Germany
Anchorage:
1.6% (526)
Alaska:
2.4% (1,382)
Colombia
Anchorage:
1.5% (488)
Alaska:
1.0% (599)
Place of birth for U.S.-born residents:
This state: 115,579
Other state: 132,045
Northeast: 15,845
Midwest: 28,212
South: 35,142
West: 52,846
84.5% of Anchorage residents lived in the same house 1 years ago. Out of people who lived in different houses, 36.8% lived in this county. Out of people who lived in different counties, 19.5% lived in Alaska.
Anchorage:
84.5%
State average:
84.8%
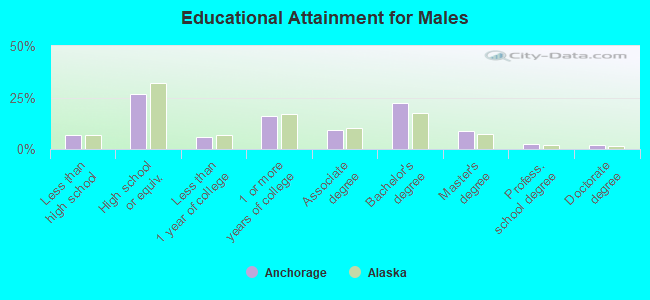
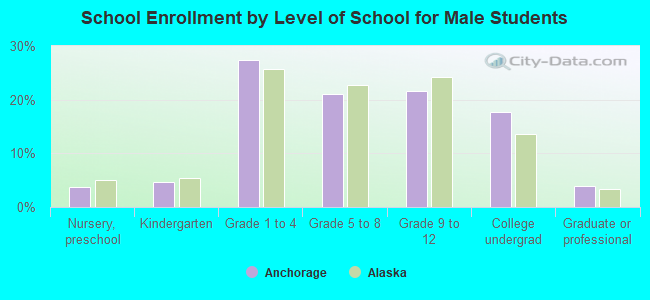
Education attainment for males 25 years and older:
No schooling: 1,385
Nursery to 4th grade: 413
5th and 6th grade: 52
7th and 8th grade: 426
9th grade: 172
10th grade: 904
11th grade: 1,145
12th grade, no diploma: 1,947
High school graduate (or equivalency): 26,237
Less than 1 year of college: 5,836
Some college more than 1 year, no degree: 15,500
Associate degree: 9,024
Bachelor's degree: 21,562
Master's degree: 8,452
Professional school degree: 2,556
Doctorate degree: 1,917
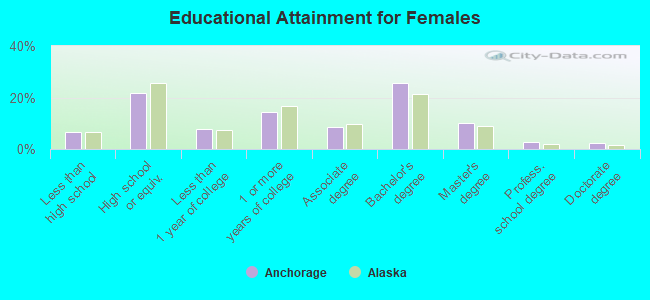
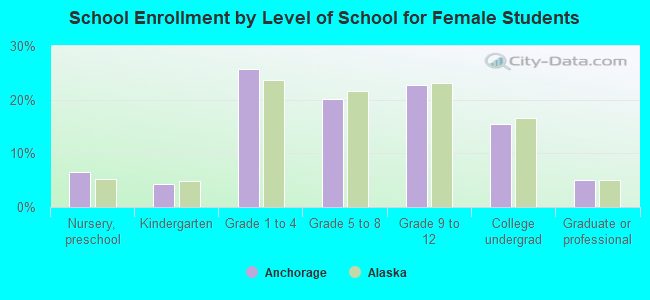
Education attainment for females 25 years and older:
No schooling: 1,338
Nursery to 4th grade: 551
5th and 6th grade: 286
7th and 8th grade: 221
9th grade: 509
10th grade: 583
11th grade: 669
12th grade, no diploma: 2,302
High school graduate (or equivalency): 20,825
Less than 1 year of college: 7,242
Some college more than 1 year, no degree: 13,805
Associate degree: 8,253
Bachelor's degree: 24,263
Master's degree: 9,470
Professional school degree: 2,510
Doctorate degree: 2,318
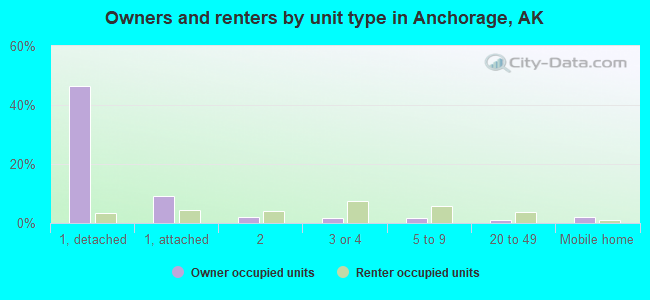
Housing units in structures:
One, detached: 58,516
One, attached: 15,499
Two: 7,433
3 or 4: 12,398
5 to 9: 8,956
10 to 19: 4,901
20 to 49: 6,452
50 or more: 2,904
Mobile homes: 3,737
Boats, RVs, vans, etc.: 75
Median worth of mobile homes: $36,200
Housing units lacking complete plumbing facilities in 2022: 1.3%
Housing units lacking complete kitchen facilities in 2022: 1.1%