Lakes, AK (Alaska) Houses and Residents
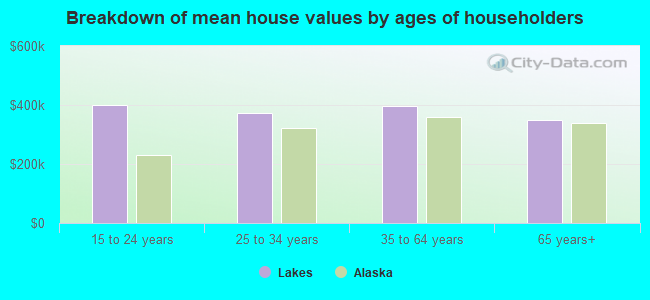
| Lakes: | $369,823 |
| Alaska: | $336,900 |
Total population: 8,364 (Urban population: 5,511 (all inside urban clusters), Rural population: 1,164 (all nonfarm))
Houses: 3,367 (3,048 occupied: 2,694 owner occupied, 521 renter occupied)
| % of renters here: | 16% |
| State: | 34% |
Housing density: 247 houses/condos per square mile
Median price asked for vacant for-sale houses and condos in 2022: $286,489.
Median contract rent in 2022: $1,249 (lower quartile is $976, upper quartile is $1,668)
Median rent asked for vacant for-rent units in 2022: $870
Median gross rent in Lakes, AK in 2022: $1,383
Housing units in Lakes with a mortgage: 1,795 (17 second mortgage, 122 home equity loan, 0 both second mortgage and home equity loan)
Houses without a mortgage: 749
Median household income for houses/condos with a mortgage: $114,233
Median household income for apartments without a mortgage: $93,268
Median monthly housing costs: $1,668
Compare current foreclosures near Lakes, AK:
| Photo | Address | Area | Beds / Baths | Price | Details |
|---|---|---|---|---|---|

|
#1
N Glenn Highway
Sutton, AK 99674
|
1,188 sq. feet
|
2 baths 3 beds |
$230,000
|
show details |

|
#2
N Prospect Dr
Wasilla, AK 99623
|
384 sq. feet
|
1 baths - beds |
$96,900
|
show details |

|
#3
S Gon Fishin Dr
Wasilla, AK 99654
|
- sq. feet
|
4 baths 5 beds |
$849,900
|
show details |

|
#4
N Tanana Dr
Wasilla, AK 99654
|
1,488 sq. feet
|
2 baths 3 beds |
show details | |

|
#5
W Cormorant Way
Wasilla, AK 99623
|
- sq. feet
|
1 baths 3 beds |
show details | |

|
#6
N Sasbo Bluff Loop
Wasilla, AK 99623
|
- sq. feet
|
1 baths 1 beds |
show details | |

|
#7
N Barbi Dr
Wasilla, AK 99623
|
1,000 sq. feet
|
1 baths 2 beds |
show details | |

|
#8
W Tia Terrace Dr
Wasilla, AK 99623
|
1,352 sq. feet
|
2 baths 3 beds |
show details | |

|
#9
S Pinnacle Peak Dr
Wasilla, AK 99623
|
3,216 sq. feet
|
2 baths 5 beds |
show details | |

|
#10
N Ebro Cir
Wasilla, AK 99654
|
- sq. feet
|
1 baths 2 beds |
show details |
| Photo | Address | Area | Beds / Baths | Price | Details |
|---|---|---|---|---|---|

|
#11
W Riffle St
Wasilla, AK 99654
|
816 sq. feet
|
1 baths 2 beds |
show details | |

|
#12
Hilltop Dr
Palmer, AK 99645
|
- sq. feet
|
1 baths 2 beds |
show details | |

|
#13
N Meadow Lakes Loop
Wasilla, AK 99623
|
- sq. feet
|
1 baths 2 beds |
show details | |

|
#14
W Crazy Pearsons Rd
Wasilla, AK 99654
|
- sq. feet
|
2 baths 4 beds |
show details | |

|
#15
W Ogrady Dr
Wasilla, AK 99623
|
320 sq. feet
|
- baths - beds |
show details | |

|
#16
Silver Tip Dr
Palmer, AK 99645
|
2,008 sq. feet
|
- baths - beds |
show details | |

|
#17
W Lanark Dr Apt D
Wasilla, AK 99654
|
4,554 sq. feet
|
- baths - beds |
show details | |

|
#18
Ski Rd
Chugiak, AK 99567
|
3,524 sq. feet
|
5 baths - beds |
show details | |

|
#19
W Swan Dr
Wasilla, AK 99623
|
1,000 sq. feet
|
- baths - beds |
show details | |

|
#20
W Tracy Lynn Cir
Wasilla, AK 99623
|
2,228 sq. feet
|
- baths - beds |
show details |
| Photo | Address | Area | Beds / Baths | Price | Details |
|---|---|---|---|---|---|

|
#21
W Hobbit Rd
Wasilla, AK 99623
|
1,008 sq. feet
|
- baths - beds |
show details | |

|
#22
E Aspen St
Wasilla, AK 99654
|
2,788 sq. feet
|
- baths - beds |
show details | |

|
#23
S Yankee Circle
Wasilla, AK 99654
|
3,238 sq. feet
|
- baths - beds |
show details | |

|
#24
W Wellington Dr
Wasilla, AK 99623
|
2,080 sq. feet
|
- baths - beds |
show details | |

|
#25
S Loussac Ln
Wasilla, AK 99654
|
2,660 sq. feet
|
- baths - beds |
show details | |

|
#26
S Leora Dr
Wasilla, AK 99623
|
- sq. feet
|
- baths - beds |
show details | |

|
#27
S Ridgecrest Rd
Wasilla, AK 99623
|
- sq. feet
|
- baths - beds |
show details | |

|
#28
W Bunting St
Wasilla, AK 99623
|
- sq. feet
|
- baths - beds |
show details | |

|
#29
W Tia Terrace Dr
Wasilla, AK 99623
|
1,352 sq. feet
|
- baths - beds |
show details | |

|
#30
W Admiralty Cir
Wasilla, AK 99623
|
- sq. feet
|
- baths - beds |
show details |
| Photo | Address | Area | Beds / Baths | Price | Details |
|---|---|---|---|---|---|

|
#31
S Hallie Dr
Wasilla, AK 99623
|
- sq. feet
|
- baths - beds |
show details | |

|
#32
S Rue De La Paix Loop
Wasilla, AK 99623
|
1,344 sq. feet
|
- baths - beds |
show details | |

|
#33
W Secluded Meadows Loop
Wasilla, AK 99623
|
- sq. feet
|
- baths - beds |
show details | |

|
#34
S Well Site Rd
Wasilla, AK 99654
|
2,208 sq. feet
|
- baths - beds |
show details | |

|
#35
N Edenfield Rd
Wasilla, AK 99623
|
1,048 sq. feet
|
- baths - beds |
show details | |

|
#36
E Nelson Ave
Wasilla, AK 99654
|
- sq. feet
|
- baths - beds |
show details | |

|
#37
E Fallbrooks Ave
Wasilla, AK 99654
|
1,352 sq. feet
|
- baths - beds |
show details | |

|
#38
N Pioneer Peak Dr
Wasilla, AK 99654
|
512 sq. feet
|
- baths - beds |
show details | |

|
#39
S Withers Rd
Wasilla, AK 99654
|
- sq. feet
|
- baths - beds |
show details | |

|
#40
E Mulchatna Dr
Wasilla, AK 99654
|
3,834 sq. feet
|
- baths - beds |
show details |
| Photo | Address | Area | Beds / Baths | Price | Details |
|---|---|---|---|---|---|

|
#41
N Saint Hermans St
Wasilla, AK 99654
|
1,736 sq. feet
|
- baths - beds |
show details | |

|
#42
E Susitna Dr
Wasilla, AK 99654
|
1,512 sq. feet
|
- baths - beds |
show details | |

|
#43
N Citation Cir
Palmer, AK 99645
|
2,416 sq. feet
|
- baths - beds |
show details | |

|
#44
E Alder Dr
Wasilla, AK 99654
|
1,140 sq. feet
|
- baths - beds |
show details | |

|
#45
S Rogers Cir # G8
Wasilla, AK 99654
|
- sq. feet
|
- baths - beds |
show details | |

|
#46
E Frost Cir
Wasilla, AK 99654
|
- sq. feet
|
- baths - beds |
show details | |

|
#47
Irene St
Palmer, AK 99645
|
- sq. feet
|
- baths - beds |
show details | |

|
#48
N Jade Cir
Wasilla, AK 99654
|
- sq. feet
|
- baths - beds |
show details | |

|
#49
W Tiller Ave
Wasilla, AK 99654
|
1,258 sq. feet
|
- baths - beds |
show details | |

|
Check over 1 million property listings on Foreclosure.com!
|
browse all offers | |||

Latest news about housing in Lakes, AK collected exclusively by city-data.com from local newspapers, TV, and radio stations

 | The Current Heatwave (124 replies) |
| Anchorage Record Crime and Property Theft 2018 (111 replies) |
| Young Family: Orange County, CA to AK (105 replies) |
| 17 Foot 100 Pound Dangerous Snake On the Loose In Wasilla. (42 replies) |
| Recommendations for good food or beverages (26 replies) |
| True feeling of Alaska? (4 replies) |

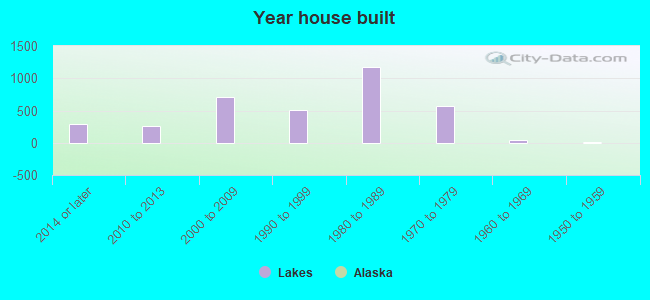
Median year apartment built: 1986
Household type by relationship:
Households: 10,459- Male householders: 1,610 (290 living alone), Female householders: 1,401 (185 living alone)
1,999 spouses (1,999 opposite-sex spouses), 116 unmarried partners, (116 opposite-sex unmarried partners), 3,979 children (3,616 natural, 193 adopted, 169 stepchildren), 144 grandchildren, 63 brothers or sisters, 222 parents, 21 foster children, 170 other relatives, 664 non-relatives
- In group quarters: 65
Size of family households: 1,068 2-persons, 429 3-persons, 405 4-persons, 265 5-persons, 113 6-persons, 108 7-or-more-persons.
Size of nonfamily households: 526 1-person, 162 2-persons, 15 3-persons, 3 4-persons.
2,018 married couples with children.
421 single-parent households (99 men, 322 women).
96.4% of residents of Lakes speak English at home.
1.0% of residents speak Spanish at home (83% speak English very well, 17% speak English well).
1.3% of residents speak other Indo-European language at home (54% speak English very well, 29% speak English well, 16% speak English not well).
1.1% of residents speak Asian or Pacific Island language at home (79% speak English very well, 21% speak English well).
0.2% of residents speak other language at home (100% speak English very well).
Foreign born population: 271 (2.6%)
(49.8% of them are naturalized citizens)
| Here: | 6.3 |
| State: | 5.6 |
| Here: | 4.7 |
| State: | 3.9 |
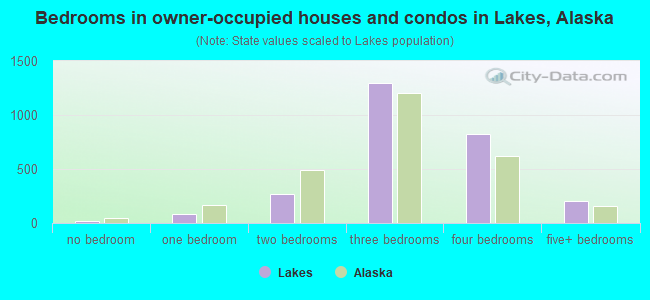
- Bedrooms in owner-occupied houses and condos in Lakes, Alaska
- 20no bedroom
- 831 bedroom
- 2662 bedrooms
- 1,2933 bedrooms
- 8274 bedrooms
- 2055+ bedrooms
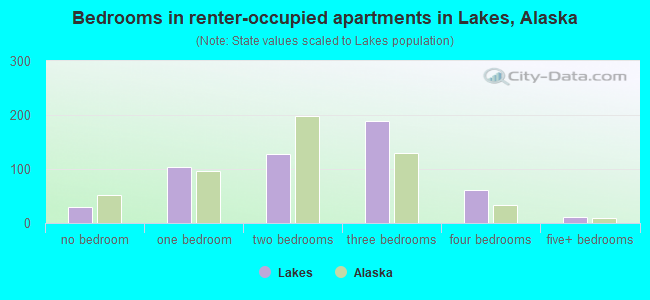
- Bedrooms in renter-occupied apartments in Lakes, Alaska
- 30no bedroom
- 1031 bedroom
- 1282 bedrooms
- 1893 bedrooms
- 614 bedrooms
- 115+ bedrooms
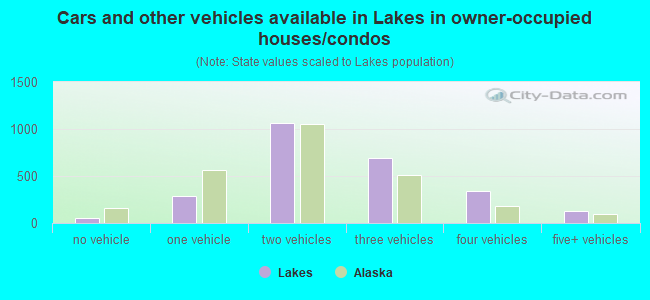
- Cars and other vehicles available in Lakes in owner-occupied houses/condos
- 52no vehicle
- 2911 vehicle
- 1,0592 vehicles
- 6933 vehicles
- 3414 vehicles
- 1235+ vehicles
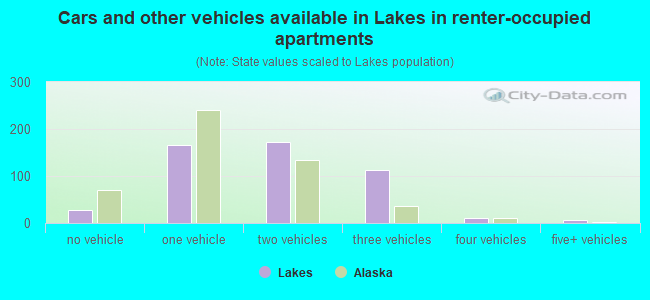
- Cars and other vehicles available in Lakes in renter-occupied apartments
- 28no vehicle
- 1651 vehicle
- 1722 vehicles
- 1123 vehicles
- 104 vehicles
- 75+ vehicles
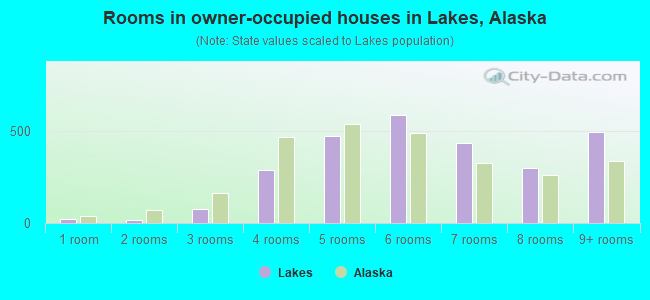
- Rooms in owner-occupied houses in Lakes, Alaska
- 201 room
- 182 rooms
- 743 rooms
- 2904 rooms
- 4735 rooms
- 5886 rooms
- 4367 rooms
- 3018 rooms
- 4969+ rooms
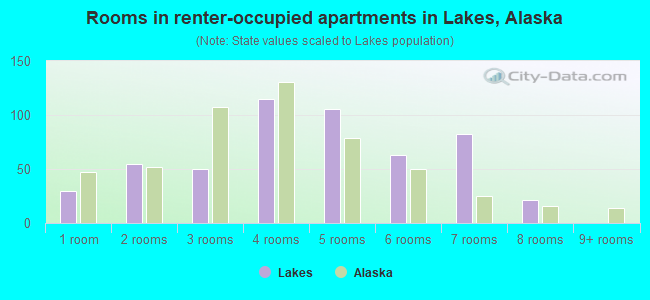
- Rooms in renter-occupied apartments in Lakes, Alaska
- 301 room
- 552 rooms
- 503 rooms
- 1154 rooms
- 1065 rooms
- 636 rooms
- 827 rooms
- 218 rooms
- 09+ rooms
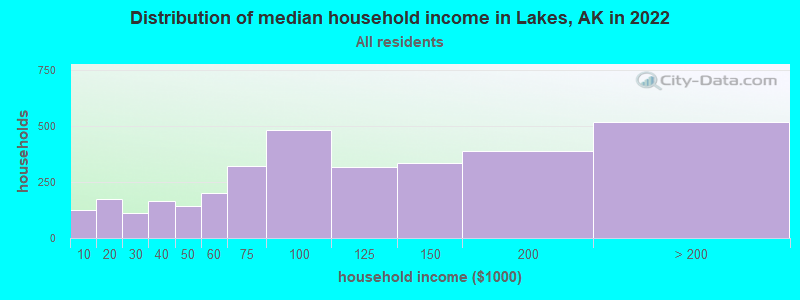
Lakes, AK household income distribution

- 124Less than $10,000
- 174$10,000 to $19,999
- 113$20,000 to $29,999
- 166$30,000 to $39,999
- 144$40,000 to $49,999
- 199$50,000 to $59,999
- 321$60,000 to $74,999
- 481$75,000 to $99,999
- 316$100,000 to $124,999
- 334$125,000 to $149,999
- 387$150,000 to $199,999
- 518$200,000 or more
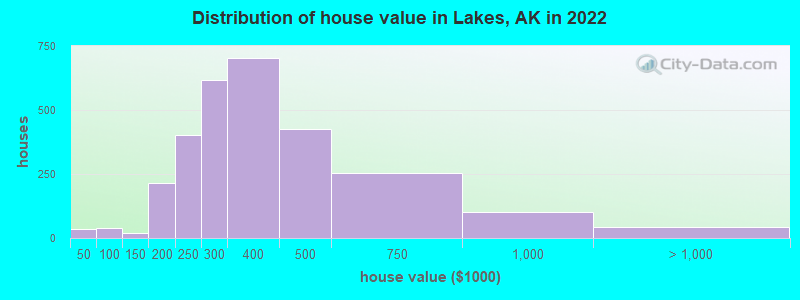
Home value of owner - occupied houses in 2022 in Lakes, AK
-
- 9Less than $10,000
- 7$30,000 to $34,999
- 18$35,000 to $39,999
- 27$50,000 to $59,999
- 3$60,000 to $69,999
- 9$70,000 to $79,999
- 6$100,000 to $124,999
- 12$125,000 to $149,999
- 84$150,000 to $174,999
- 130$175,000 to $199,999
- 402$200,000 to $249,999
- 615$250,000 to $299,999
- 705$300,000 to $399,999
- 424$400,000 to $499,999
- 253$500,000 to $749,999
- 101$750,000 to $999,999
- 26$1,000,000 to $1,499,999
- 17$2,000,000 or more
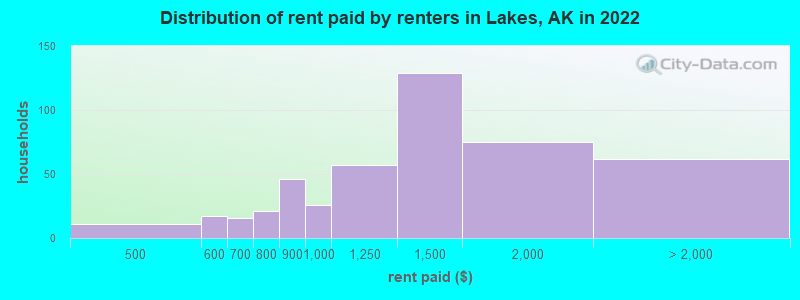
Rent paid by renters in 2022 in Lakes, AK
-
- 11$400 to $449
- 4$500 to $549
- 11$550 to $599
- 15$600 to $649
- 3$700 to $749
- 16$750 to $799
- 46$800 to $899
- 26$900 to $999
- 56$1,000 to $1,249
- 128$1,250 to $1,499
- 74$1,500 to $1,999
- 26$2,000 to $2,499
- 35No cash rent
Percentage of workers working in this county: 64.5%
Number of people working at home: 408 (9.5% of all workers)
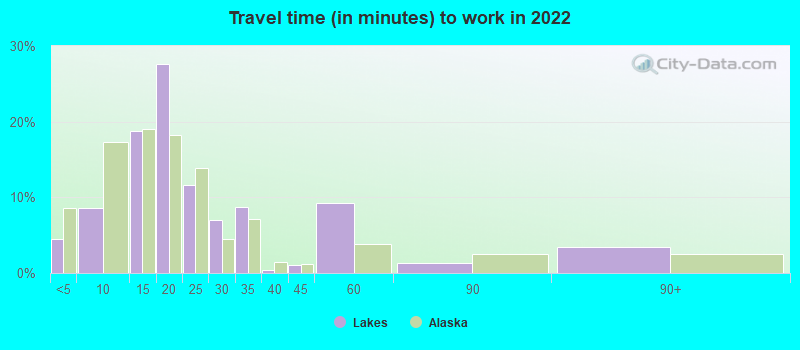
Travel time to work (commute)
- Less than 5 minutes: 140
- 5 to 9 minutes: 263
- 10 to 14 minutes: 682
- 15 to 19 minutes: 834
- 20 to 24 minutes: 274
- 25 to 29 minutes: 128
- 30 to 34 minutes: 142
- 35 to 39 minutes: 36
- 40 to 44 minutes: 103
- 45 to 59 minutes: 779
- 60 to 89 minutes: 350
- 90 or more minutes: 244
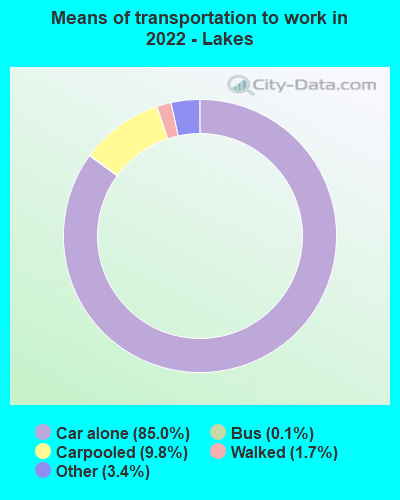
Means of transportation to work:
- Drove a car alone: 1,510 (73.8%)
- Carpooled: 171 (8.4%)
- Bus: 1 (0.0%)
- Taxi: 64 (3.1%)
- Walked: 29 (1.4%)
- Worked at home: 360 (17.6%)
- Unemployment by race in 2022
- Unemployment rate for White non-Hispanic residents
- 3.5%Males
- 7.4%Females
- Unemployment rate for American Indian and Alaska Native residents
- 2.8%Males
- 18.1%Females
- Unemployment rate for two or more race residents
- 17.6%Males
- Unemployment rate for Hispanic or Latino residents
- 8.7%Males
- 50.8%Females
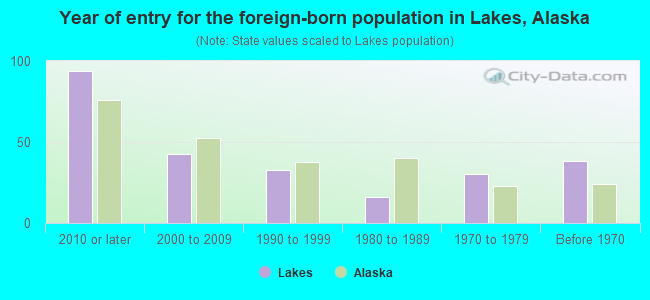
- Year of entry for the foreign-born population in Lakes, Alaska
- 942010 or later
- 422000 to 2009
- 331990 to 1999
- 161980 to 1989
- 301970 to 1979
- 38Before 1970
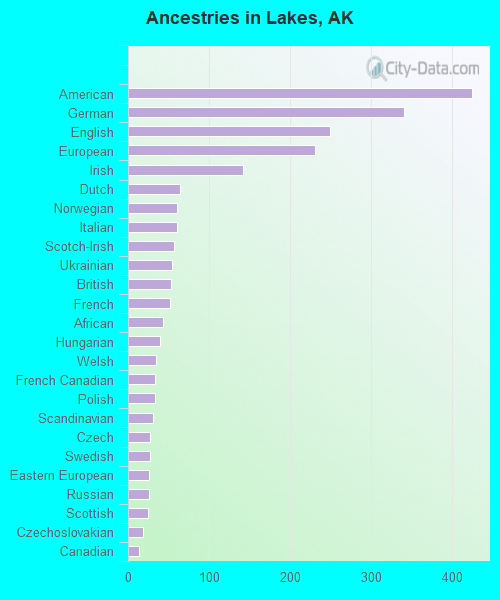
First ancestries reported:
- American: 424 (11.5%)
- German: 340 (9.2%)
- English: 249 (6.8%)
- European: 230 (6.2%)
- Irish: 142 (3.9%)
- Dutch: 64 (1.7%)
- Norwegian: 61 (1.7%)
- Italian: 60 (1.6%)
- Scotch-Irish: 57 (1.5%)
- Ukrainian: 54 (1.5%)
- British: 53 (1.4%)
- French: 52 (1.4%)
- African: 43 (1.2%)
- Hungarian: 39 (1.1%)
- Welsh: 34 (0.9%)
- French Canadian: 33 (0.9%)
- Polish: 33 (0.9%)
- Scandinavian: 31 (0.8%)
- Czech: 27 (0.7%)
- Swedish: 27 (0.7%)
- Eastern European: 26 (0.7%)
- Russian: 26 (0.7%)
- Scottish: 25 (0.7%)
- Czechoslovakian: 19 (0.5%)
- Canadian: 13 (0.4%)
- Cajun: 10 (0.3%)
- Serbian: 10 (0.3%)
- Lebanese: 7 (0.2%)
- Lithuanian: 7 (0.2%)
- Danish: 5 (0.1%)
- Finnish: 5 (0.1%)
- Greek: 5 (0.1%)
Most common places of birth for foreign-born residents (%):
| Lakes: | 31.2% (70) |
| Alaska: | 100.0% (-1) |
| Lakes: | 8.0% (18) |
| Alaska: | 100.0% (-1) |
| Lakes: | 8.0% (18) |
| Alaska: | 100.0% (-1) |
| Lakes: | 7.1% (16) |
| Alaska: | 100.0% (-1) |
| Lakes: | 6.2% (14) |
| Alaska: | 100.0% (-1) |
| Lakes: | 6.2% (14) |
| Alaska: | 100.0% (-1) |
| Lakes: | 6.2% (14) |
| Alaska: | 100.0% (-1) |
| Lakes: | 5.8% (13) |
| Alaska: | 100.0% (-1) |
| Lakes: | 4.9% (11) |
| Alaska: | 100.0% (-1) |
| Lakes: | 4.9% (11) |
| Alaska: | 100.0% (-1) |
| Lakes: | 4.5% (10) |
| Alaska: | 100.0% (-1) |
| Lakes: | 3.6% (8) |
| Alaska: | 100.0% (-1) |
| Lakes: | 2.7% (6) |
| Alaska: | 100.0% (-1) |
| Lakes: | 2.2% (5) |
| Alaska: | 100.0% (-1) |
Place of birth for U.S.-born residents:
- This state: 4,277
- Other state: 5,684
- Northeast: 699
- Midwest: 1,290
- South: 1,397
- West: 2,299
85.8% of Lakes residents lived in the same house 1 years ago.
Out of people who lived in different houses, 35.0% lived in this county.
Out of people who lived in different counties, 54.1% lived in Alaska.
| Lakes: | 85.8% |
| State average: | 84.8% |
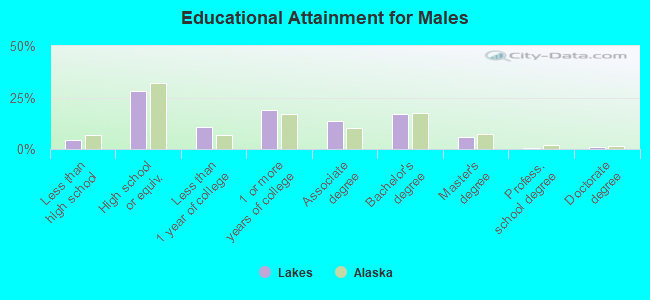
Education attainment for males 25 years and older:
- No schooling: 12
- Nursery to 4th grade: 0
- 5th and 6th grade: 11
- 7th and 8th grade: 11
- 9th grade: 32
- 10th grade: 25
- 11th grade: 12
- 12th grade, no diploma: 56
- High school graduate (or equivalency): 969
- Less than 1 year of college: 367
- Some college more than 1 year, no degree: 656
- Associate degree: 464
- Bachelor's degree: 579
- Master's degree: 199
- Professional school degree: 21
- Doctorate degree: 32
Education attainment for females 25 years and older:
- No schooling: 0
- Nursery to 4th grade: 0
- 5th and 6th grade: 3
- 7th and 8th grade: 3
- 9th grade: 10
- 10th grade: 37
- 11th grade: 34
- 12th grade, no diploma: 4
- High school graduate (or equivalency): 1,178
- Less than 1 year of college: 260
- Some college more than 1 year, no degree: 616
- Associate degree: 298
- Bachelor's degree: 539
- Master's degree: 194
- Professional school degree: 25
- Doctorate degree: 26


Housing units in structures:
- One, detached: 2,927
- One, attached: 54
- Two: 77
- 3 or 4: 69
- 5 to 9: 96
- 10 to 19: 31
- 20 to 49: 7
- Mobile homes: 102
Median worth of mobile homes: $41,588
Housing units lacking complete kitchen facilities in 2022: 2.1%
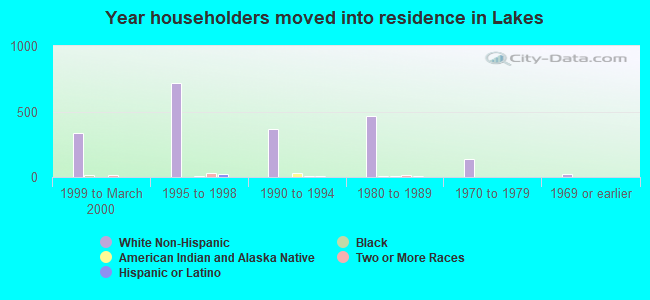
House/condo owner moved in on average 13 years ago
Renter moved in on average 1 years ago
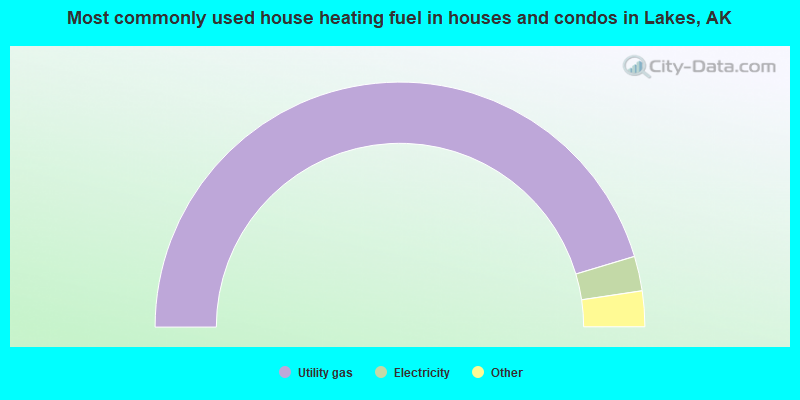
- 90.8%Utility gas
- 4.6%Electricity
- 2.6%Wood
- 1.4%Fuel oil, kerosene, etc.
- 0.4%Other fuel
- 0.3%Bottled, tank, or LP gas
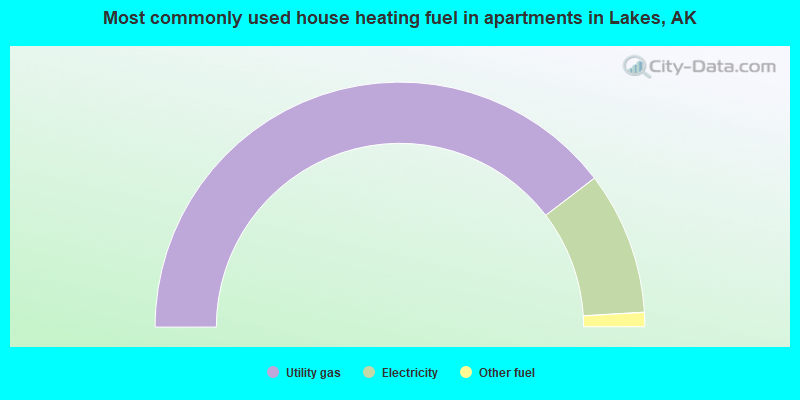
- 79.2%Utility gas
- 18.9%Electricity
- 1.9%Other fuel
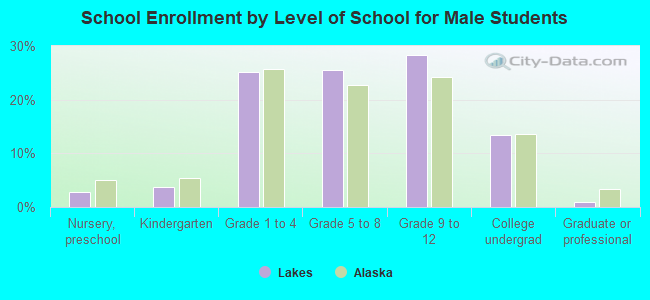
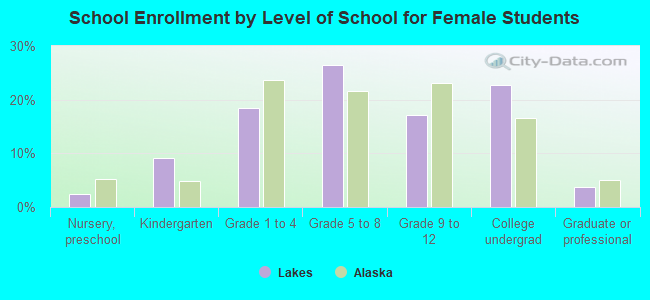
Private vs. public school enrollment:
| Here: | 20.2% |
| Alaska: | 15.7% |
| Here: | 12.6% |
| Alaska: | 13.7% |
| Here: | 41.2% |
| Alaska: | 14.7% |