Langley Park, MD (Maryland) Houses and Residents
| Langley Park: | $370,314 |
| Maryland: | $398,100 |
Total population: 18,755 (Urban population: 16,214, Rural population: 0)
Houses: 5,322 (5,267 occupied: 1,208 owner occupied, 4,083 renter occupied)
| % of renters here: | 77% |
| State: | 32% |
Housing density: 6,459 houses/condos per square mile
Median price asked for vacant for-sale houses and condos in 2022 in this county: $422,373.
Median contract rent in 2022: $1,412 (lower quartile is $1,256, upper quartile is $1,765)
Median rent asked for vacant for-rent units in 2022: $2,169
Median gross rent in Langley Park, MD in 2022: $1,564
Housing units in Langley Park with a mortgage: 751 (93 second mortgage, 0 home equity loan, 60 both second mortgage and home equity loan)
Houses without a mortgage: 99
Median household income for houses/condos with a mortgage: $99,052
Median household income for apartments without a mortgage: $76,356
Median monthly housing costs: $1,494
Compare current foreclosures near Langley Park, MD:
| Photo | Address | Area | Beds / Baths | Price | Details |
|---|---|---|---|---|---|

|
#1
Pickett Dr
Suitland, MD 20746
|
1,296 sq. feet
|
1 baths 2 beds |
$335,000
|
show details |

|
#2
Henson Ln
Temple Hills, MD 20748
|
1,566 sq. feet
|
2 baths 3 beds |
$300,000
|
show details |

|
#3
3rd St
Lanham, MD 20706
|
1,104 sq. feet
|
2 baths 3 beds |
$369,200
|
show details |

|
#4
Cathedral Ave NW Apt 108
Washington, DC 20016
|
765 sq. feet
|
1 baths 1 beds |
$259,900
|
show details |

|
#5
17th St NW Apt 504
Washington, DC 20009
|
800 sq. feet
|
1 baths 1 beds |
$395,000
|
show details |

|
#6
Brooke Knolls Rd
Gaithersburg, MD 20882
|
1,704 sq. feet
|
3 baths 4 beds |
$681,500
|
show details |

|
#7
Elkhorn Ln
Bowie, MD 20716
|
1,514 sq. feet
|
2 baths 3 beds |
$415,000
|
show details |

|
#8
23rd Pl
Hyattsville, MD 20783
|
1,188 sq. feet
|
2 baths 4 beds |
$379,600
|
show details |

|
#9
Hammersmith Cir
Silver Spring, MD 20906
|
1,152 sq. feet
|
1 baths 3 beds |
$328,600
|
show details |

|
#10
S Leisure World Blvd # 29-1d
Silver Spring, MD 20906
|
990 sq. feet
|
1 baths 1 beds |
$129,900
|
show details |
| Photo | Address | Area | Beds / Baths | Price | Details |
|---|---|---|---|---|---|

|
#11
Buchanan St NE
Washington, DC 20017
|
1,240 sq. feet
|
2 baths 3 beds |
$325,000
|
show details |

|
#12
Heming Ln
Bowie, MD 20716
|
1,800 sq. feet
|
2 baths 3 beds |
$400,000
|
show details |

|
#13
Crafford Pl
Fort Washington, MD 20744
|
1,890 sq. feet
|
1 baths 3 beds |
$265,900
|
show details |

|
#14
24th Pl
Hyattsville, MD 20782
|
1,216 sq. feet
|
1 baths 3 beds |
$289,900
|
show details |

|
#15
Monroe St NW
Washington, DC 20010
|
- sq. feet
|
2 baths 2 beds |
$665,000
|
show details |

|
#16
Trubador Dr
Clinton, MD 20735
|
1,144 sq. feet
|
3 baths 4 beds |
$481,500
|
show details |

|
#17
Wilson Ln Apt 204
Mc Lean, VA 22102
|
925 sq. feet
|
1 baths 2 beds |
$359,900
|
show details |

|
#18
Pooks Hill Rd Apt 1612s
Bethesda, MD 20814
|
1,250 sq. feet
|
1 baths 2 beds |
$289,000
|
show details |

|
#19
Fitzgibbon Ct
Bowie, MD 20721
|
1,300 sq. feet
|
2 baths 3 beds |
$369,200
|
show details |

|
#20
Applegarth Pl
Capitol Heights, MD 20743
|
1,200 sq. feet
|
1 baths 3 beds |
$314,900
|
show details |
| Photo | Address | Area | Beds / Baths | Price | Details |
|---|---|---|---|---|---|

|
#21
Interlachen Dr Apt 111
Silver Spring, MD 20906
|
965 sq. feet
|
1 baths 2 beds |
$148,000
|
show details |

|
#22
Snowflower Blvd
Oxon Hill, MD 20745
|
- sq. feet
|
2 baths 3 beds |
$331,760
|
show details |

|
#23
Delaware Ave SW Apt N720
Washington, DC 20024
|
- sq. feet
|
1 baths 1 beds |
$139,900
|
show details |

|
#24
Brooke Ln
Upper Marlboro, MD 20772
|
- sq. feet
|
5 baths 6 beds |
$949,000
|
show details |

|
#25
T St SE Apt 3
Washington, DC 20020
|
- sq. feet
|
2 baths 4 beds |
$307,500
|
show details |

|
#26
Wilson Bridge Dr Unit #6770 A-2
Oxon Hill, MD 20745
|
- sq. feet
|
1 baths 1 beds |
$99,750
|
show details |

|
#27
Oakwood St SE Apt B5
Washington, DC 20032
|
628 sq. feet
|
1 baths 1 beds |
show details | |

|
#28
Yoakum Pkwy Apt 22304
Alexandria, VA 22304
|
1,098 sq. feet
|
2 baths 1 beds |
show details | |

|
#29
Beechcliff Dr
Alexandria, VA 22306
|
2,365 sq. feet
|
3 baths 3 beds |
show details | |

|
#30
Piano Ln # 99
Silver Spring, MD 20904
|
1,377 sq. feet
|
2 baths 3 beds |
show details |
| Photo | Address | Area | Beds / Baths | Price | Details |
|---|---|---|---|---|---|

|
#31
Malcolm X Ave SE
Washington, DC 20032
|
1,254 sq. feet
|
2 baths 4 beds |
show details | |

|
#32
Adams St NE Apt 1
Washington, DC 20018
|
697 sq. feet
|
2 baths 2 beds |
show details | |

|
#33
Buena Vista Terrace SE
Washington, DC 20020
|
3,800 sq. feet
|
3 baths 6 beds |
show details | |

|
#34
Lanham Severn Rd
Bowie, MD 20720
|
3,268 sq. feet
|
3 baths 5 beds |
show details | |

|
#35
Hunter Pl SE Apt 101
Washington, DC 20020
|
791 sq. feet
|
1 baths 2 beds |
show details | |

|
#36
Columbia Rd NW
Washington, DC 20001
|
1,122 sq. feet
|
1 baths 3 beds |
show details | |

|
#37
8th St SE Apt 6
Washington, DC 20032
|
537 sq. feet
|
1 baths 1 beds |
show details | |

|
#38
Tobias Dr SE
Washington, DC 20020
|
2,160 sq. feet
|
3 baths 3 beds |
show details | |

|
#39
Harvard St NW # T1
Washington, DC 20009
|
640 sq. feet
|
1 baths 1 beds |
show details | |

|
#40
Savannah Pl SE
Washington, DC 20020
|
850 sq. feet
|
1 baths 2 beds |
show details |
| Photo | Address | Area | Beds / Baths | Price | Details |
|---|---|---|---|---|---|

|
#41
Talbert Ter SE
Washington, DC 20020
|
1,560 sq. feet
|
1 baths 4 beds |
show details | |

|
#42
2nd St SE
Washington, DC 20032
|
1,836 sq. feet
|
2 baths 3 beds |
show details | |

|
#43
Lamont St NW
Washington, DC 20010
|
2,718 sq. feet
|
3 baths 6 beds |
show details | |

|
#44
Channing St NE
Washington, DC 20018
|
1,650 sq. feet
|
2 baths 3 beds |
show details | |

|
#45
4th St NE Apt 1
Washington, DC 20002
|
954 sq. feet
|
2 baths 2 beds |
show details | |

|
#46
28th Pkwy
Temple Hills, MD 20748
|
1,000 sq. feet
|
1 baths 3 beds |
show details | |

|
#47
Lincoln Rd NE
Washington, DC 20002
|
1,530 sq. feet
|
1 baths 3 beds |
show details | |

|
#48
Douglas St NE
Washington, DC 20018
|
1,729 sq. feet
|
3 baths 5 beds |
show details | |

|
#49
9th Pl SE
Washington, DC 20032
|
1,474 sq. feet
|
3 baths 4 beds |
show details | |

|
Check over 1 million property listings on Foreclosure.com!
|
browse all offers | |||


Median year apartment built: 1970
Household type by relationship:
Households: 21,545- Male householders: 2,986 (354 living alone), Female householders: 2,155 (469 living alone)
1,368 spouses (1,368 opposite-sex spouses), 925 unmarried partners, (903 opposite-sex unmarried partners), 6,896 children (6,422 natural, 184 adopted, 289 stepchildren), 886 grandchildren, 1,064 brothers or sisters, 604 parents, 0 foster children, 1,774 other relatives, 2,796 non-relatives
- In group quarters: 86
Size of family households: 342 2-persons, 908 3-persons, 1,096 4-persons, 807 5-persons, 306 6-persons, 468 7-or-more-persons.
Size of nonfamily households: 811 1-person, 152 2-persons, 209 3-persons, 45 4-persons, 99 5-persons, 45 7-or-more-persons.
2,220 married couples with children.
3,405 single-parent households (1,498 men, 1,907 women).
12.0% of residents of Langley Park speak English at home.
82.8% of residents speak Spanish at home (20% speak English very well, 15% speak English well, 32% speak English not well, 33% don't speak English at all).
5.1% of residents speak other Indo-European language at home (35% speak English very well, 51% speak English well, 3% speak English not well, 11% don't speak English at all).
0.5% of residents speak Asian or Pacific Island language at home (34% speak English very well, 56% speak English well, 10% don't speak English at all).
2.8% of residents speak other language at home (66% speak English very well, 21% speak English well, 13% speak English not well).
Foreign born population: 15,301 (71.0%)
(16.6% of them are naturalized citizens)
| Here: | 5.8 |
| State: | 7.3 |
| Here: | 3.9 |
| State: | 4.2 |

- Bedrooms in owner-occupied houses and condos in Langley Park, Maryland
- 0no bedroom
- 271 bedroom
- 2492 bedrooms
- 5173 bedrooms
- 1894 bedrooms
- 2255+ bedrooms

- Bedrooms in renter-occupied apartments in Langley Park, Maryland
- 98no bedroom
- 1,3651 bedroom
- 2,0072 bedrooms
- 4723 bedrooms
- 1424 bedrooms
- 05+ bedrooms

- Cars and other vehicles available in Langley Park in owner-occupied houses/condos
- 139no vehicle
- 2821 vehicle
- 3712 vehicles
- 2493 vehicles
- 1344 vehicles
- 335+ vehicles

- Cars and other vehicles available in Langley Park in renter-occupied apartments
- 1,039no vehicle
- 1,5431 vehicle
- 1,1852 vehicles
- 1963 vehicles
- 964 vehicles
- 235+ vehicles

- Rooms in owner-occupied houses in Langley Park, Maryland
- 01 room
- 02 rooms
- 273 rooms
- 1864 rooms
- 2565 rooms
- 2876 rooms
- 1747 rooms
- 828 rooms
- 1959+ rooms

- Rooms in renter-occupied apartments in Langley Park, Maryland
- 881 room
- 962 rooms
- 1,0533 rooms
- 2,1234 rooms
- 5375 rooms
- 1706 rooms
- 187 rooms
- 08 rooms
- 09+ rooms


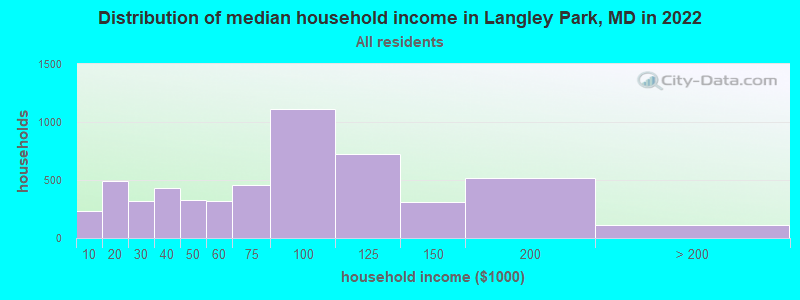
Langley Park, MD household income distribution

- 232Less than $10,000
- 493$10,000 to $19,999
- 316$20,000 to $29,999
- 428$30,000 to $39,999
- 330$40,000 to $49,999
- 319$50,000 to $59,999
- 459$60,000 to $74,999
- 1,115$75,000 to $99,999
- 722$100,000 to $124,999
- 313$125,000 to $149,999
- 513$150,000 to $199,999
- 116$200,000 or more
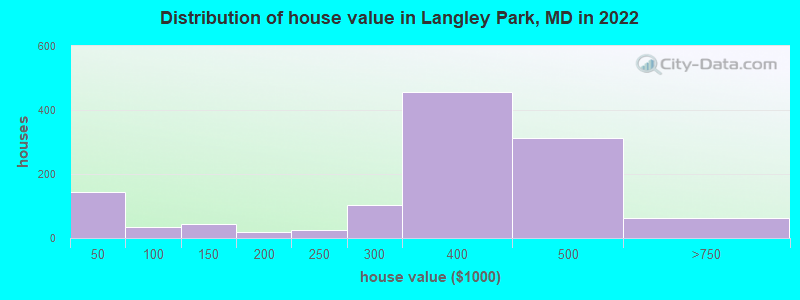
Home value of owner - occupied houses in 2022 in Langley Park, MD
-
- 142Less than $10,000
- 26$70,000 to $79,999
- 8$90,000 to $99,999
- 45$100,000 to $124,999
- 4$150,000 to $174,999
- 14$175,000 to $199,999
- 24$200,000 to $249,999
- 102$250,000 to $299,999
- 454$300,000 to $399,999
- 310$400,000 to $499,999
- 63$500,000 to $749,999
Rent paid by renters in 2022 in Langley Park, MD
-
- 16$100 to $149
- 30$400 to $449
- 10$750 to $799
- 8$800 to $899
- 9$900 to $999
- 703$1,000 to $1,249
- 1,557$1,250 to $1,499
- 1,306$1,500 to $1,999
- 402$2,000 to $2,499
- 10$2,500 to $2,999
- 25No cash rent


Percentage of workers working in this county: 30.3%
Number of people working at home: 403 (4.2% of all workers)
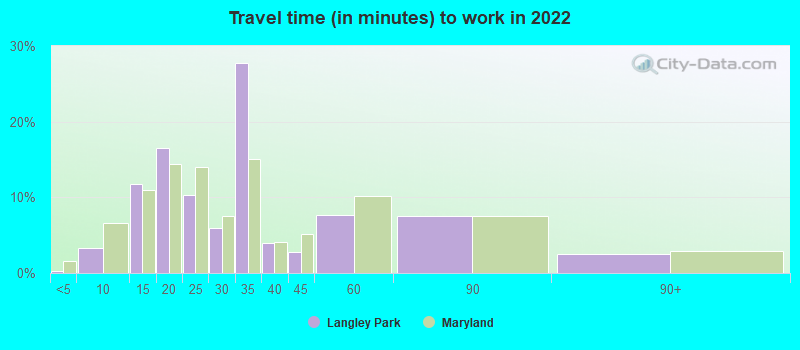
Travel time to work (commute)
- Less than 5 minutes: 5
- 5 to 9 minutes: 128
- 10 to 14 minutes: 657
- 15 to 19 minutes: 330
- 20 to 24 minutes: 825
- 25 to 29 minutes: 222
- 30 to 34 minutes: 1,826
- 35 to 39 minutes: 586
- 40 to 44 minutes: 945
- 45 to 59 minutes: 1,365
- 60 to 89 minutes: 1,363
- 90 or more minutes: 337
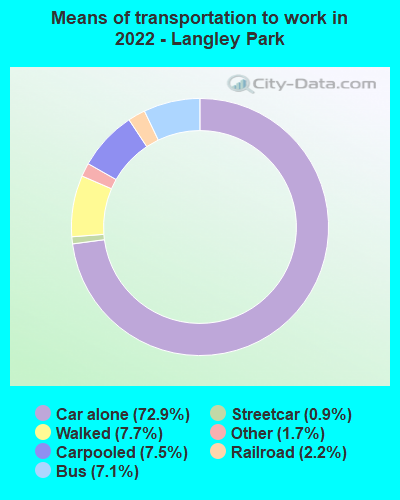
Means of transportation to work:
- Drove a car alone: 1,295 (59.4%)
- Carpooled: 120 (5.5%)
- Bus: 90 (4.1%)
- Subway or elevated rail: 11 (0.5%)
- Light rail, streetcar or trolley: 40 (1.8%)
- Taxi: 38 (1.7%)
- Walked: 136 (6.2%)
- Worked at home: 403 (18.5%)

- Unemployment by race in 2022
- Unemployment rate for White non-Hispanic residents
- 7.0%Males
- 9.3%Females
- Unemployment rate for Black residents
- 14.8%Males
- 5.1%Females
- Unemployment rate for Asian residents
- 8.2%Males
- 43.4%Females
- Unemployment rate for other race residents
- 3.0%Males
- 5.4%Females
- Unemployment rate for Hispanic or Latino residents
- 3.2%Males
- 7.1%Females

- Year of entry for the foreign-born population in Langley Park, Maryland
- 8,5132010 or later
- 4,5572000 to 2009
- 9971990 to 1999
- 3,1101980 to 1989
- 7071970 to 1979
- 180Before 1970

First ancestries reported:
- Jamaican: 328 (1.8%)
- Ethiopian: 106 (0.6%)
- American: 101 (0.5%)
- Nigerian: 100 (0.5%)
- British West Indian: 97 (0.5%)
- Trinidadian and Tobagonian: 85 (0.5%)
- Moroccan: 26 (0.1%)
- Sierra Leonean: 25 (0.1%)
- Turkish: 16 (0.09%)
- French: 15 (0.08%)
- German: 15 (0.08%)
- Lithuanian: 12 (0.06%)
- Haitian: 12 (0.06%)
- African: 9 (0.05%)
- Barbadian: 5 (0.03%)
- Greek: 3 (0.02%)
- European: 2 (0.01%)
- English: 1 (0.01%)
- Irish: 1 (0.01%)
Most common places of birth for foreign-born residents (%):
| Langley Park: | 44.1% (6,651) |
| Maryland: | 4.4% (42,350) |
| Langley Park: | 27.1% (4,091) |
| Maryland: | 12.0% (115,412) |
| Langley Park: | 9.2% (1,384) |
| Maryland: | 2.5% (24,026) |
| Langley Park: | 2.3% (341) |
| Maryland: | 3.2% (30,870) |
| Langley Park: | 2.2% (336) |
| Maryland: | 0.7% (6,317) |
| Langley Park: | 2.1% (312) |
| Maryland: | 2.8% (27,444) |
| Langley Park: | 1.6% (241) |
| Maryland: | 0.6% (5,899) |
Place of birth for U.S.-born residents:
- This state: 5,097
- Other state: 2,221
- Northeast: 325
- Midwest: 184
- South: 1,608
- West: 100
94.9% of Langley Park residents lived in the same house 1 years ago.
Out of people who lived in different houses, 43.2% lived in this county.
Out of people who lived in different counties, 31.3% lived in Maryland.
| Langley Park: | 94.9% |
| State average: | 88.5% |
Education attainment for males 25 years and older:
- No schooling: 700
- Nursery to 4th grade: 1,058
- 5th and 6th grade: 1,738
- 7th and 8th grade: 364
- 9th grade: 311
- 10th grade: 162
- 11th grade: 74
- 12th grade, no diploma: 259
- High school graduate (or equivalency): 1,380
- Less than 1 year of college: 74
- Some college more than 1 year, no degree: 308
- Associate degree: 204
- Bachelor's degree: 326
- Master's degree: 187
- Professional school degree: 6
- Doctorate degree: 7

Education attainment for females 25 years and older:
- No schooling: 458
- Nursery to 4th grade: 611
- 5th and 6th grade: 861
- 7th and 8th grade: 148
- 9th grade: 210
- 10th grade: 45
- 11th grade: 78
- 12th grade, no diploma: 87
- High school graduate (or equivalency): 1,252
- Less than 1 year of college: 27
- Some college more than 1 year, no degree: 179
- Associate degree: 508
- Bachelor's degree: 388
- Master's degree: 113
- Professional school degree: 0
- Doctorate degree: 35


Housing units in structures:
- One, detached: 1,076
- One, attached: 299
- Two: 72
- 3 or 4: 402
- 5 to 9: 1,530
- 10 to 19: 1,155
- 20 to 49: 572
- 50 or more: 176
- Mobile homes: 36
House/condo owner moved in on average 21 years ago
Renter moved in on average 5 years ago

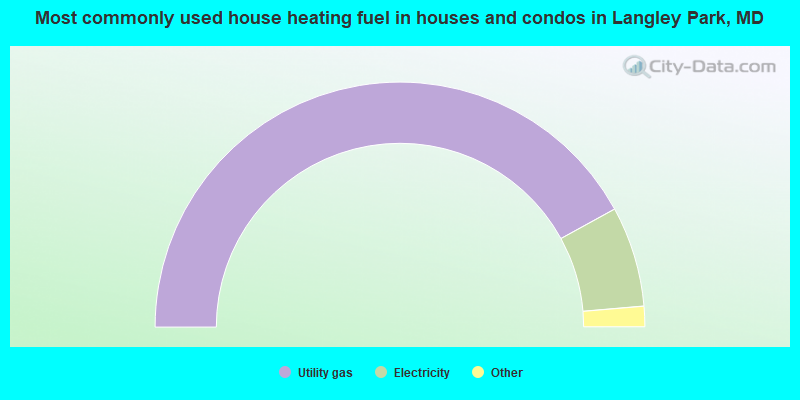
- 84.1%Utility gas
- 13.3%Electricity
- 1.6%Other fuel
- 1.0%No fuel used
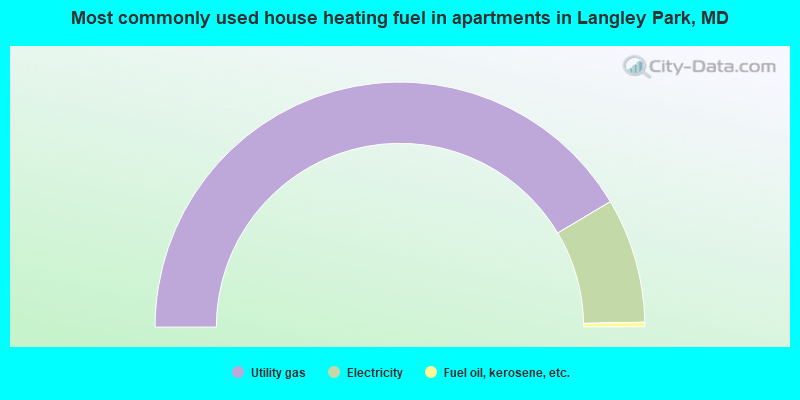
- 82.9%Utility gas
- 16.5%Electricity
- 0.6%Fuel oil, kerosene, etc.
Private vs. public school enrollment:
| Here: | 6.2% |
| Maryland: | 15.2% |
| Here: | 9.2% |
| Maryland: | 14.4% |
| Here: | 20.3% |
| Maryland: | 20.2% |


