South Valley, NM (New Mexico) Houses and Residents
| South Valley: | $214,226 |
| New Mexico: | $243,100 |
Total population: 40,976 (Urban population: 38,805, Rural population: 447 (34 farm, 413 nonfarm))
Houses: 14,527 (13,296 occupied: 9,607 owner occupied, 3,802 renter occupied)
| % of renters here: | 28% |
| State: | 29% |
Housing density: 492 houses/condos per square mile
Median price asked for vacant for-sale houses and condos in 2022: $244,131.
Median contract rent in 2022: $739 (lower quartile is $537, upper quartile is $908)
Median rent asked for vacant for-rent units in 2022: $901
Median gross rent in South Valley, NM in 2022: $888
Housing units in South Valley with a mortgage: 5,488 (440 second mortgage, 6 home equity loan, 304 both second mortgage and home equity loan)
Houses without a mortgage: 113
Median household income for houses/condos with a mortgage: $69,803
Median household income for apartments without a mortgage: $48,935
Median monthly housing costs: $846
Compare current foreclosures near South Valley, NM:
| Photo | Address | Area | Beds / Baths | Price | Details |
|---|---|---|---|---|---|

|
#1
Brush Pl NE
Albuquerque, NM 87123
|
1,079 sq. feet
|
2 baths 3 beds |
show details | |

|
#2
Clinton Blvd SW
Albuquerque, NM 87105
|
1,550 sq. feet
|
2 baths 2 beds |
show details | |

|
#3
Glorieta St NE
Albuquerque, NM 87111
|
1,788 sq. feet
|
2 baths 4 beds |
show details | |

|
#4
Spain Rd NE
Albuquerque, NM 87111
|
1,537 sq. feet
|
2 baths 3 beds |
show details | |

|
#5
Sawgrass Pl NW
Albuquerque, NM 87121
|
1,465 sq. feet
|
2 baths 3 beds |
show details | |

|
#6
60th St NW
Albuquerque, NM 87105
|
1,198 sq. feet
|
1 baths 2 beds |
show details | |

|
#7
Christy Ave NE
Albuquerque, NM 87109
|
1,935 sq. feet
|
2 baths 3 beds |
show details | |

|
#8
Morris St NE
Albuquerque, NM 87112
|
1,392 sq. feet
|
1 baths 3 beds |
show details | |

|
#9
Towner Ave NE
Albuquerque, NM 87112
|
3,102 sq. feet
|
4 baths 4 beds |
show details | |

|
#10
Leander Ave NE
Albuquerque, NM 87109
|
2,320 sq. feet
|
3 baths 3 beds |
show details |
| Photo | Address | Area | Beds / Baths | Price | Details |
|---|---|---|---|---|---|

|
#11
60th St NW
Albuquerque, NM 87105
|
972 sq. feet
|
1 baths 2 beds |
show details | |

|
#12
57th St NW
Albuquerque, NM 87105
|
1,728 sq. feet
|
2 baths 2 beds |
show details | |

|
#13
Avenida La Costa NE
Albuquerque, NM 87109
|
1,594 sq. feet
|
2 baths 3 beds |
show details | |

|
#14
62nd St NW
Albuquerque, NM 87105
|
1,576 sq. feet
|
1 baths 2 beds |
show details | |

|
#15
Baldwin Ave NE
Albuquerque, NM 87112
|
2,358 sq. feet
|
2 baths 3 beds |
show details | |

|
#16
Muriel St NE
Albuquerque, NM 87112
|
1,111 sq. feet
|
1 baths 2 beds |
show details | |

|
#17
Figueroa St NE
Albuquerque, NM 87123
|
1,387 sq. feet
|
2 baths 2 beds |
show details | |

|
#18
San Rafael Ave SE
Albuquerque, NM 87106
|
1,710 sq. feet
|
1 baths 3 beds |
show details | |

|
#19
58th St NW
Albuquerque, NM 87105
|
1,464 sq. feet
|
2 baths 2 beds |
show details | |

|
#20
Ranchitos Rd
Bosque Farms, NM 87068
|
1,820 sq. feet
|
2 baths 3 beds |
show details |
| Photo | Address | Area | Beds / Baths | Price | Details |
|---|---|---|---|---|---|

|
#21
Colleen Ave NE
Albuquerque, NM 87109
|
1,456 sq. feet
|
2 baths 3 beds |
show details | |

|
#22
Arno St NE
Albuquerque, NM 87102
|
1,316 sq. feet
|
1 baths 2 beds |
show details | |

|
#23
Los Ranchos Rd NW
Albuquerque, NM 87107
|
1,654 sq. feet
|
1 baths 1 beds |
show details | |

|
#24
Baronet Pl NE
Albuquerque, NM 87123
|
1,094 sq. feet
|
2 baths 2 beds |
show details | |

|
#25
Torreon Dr NE
Albuquerque, NM 87109
|
2,202 sq. feet
|
2 baths 3 beds |
show details | |

|
#26
Muriel St NE
Albuquerque, NM 87112
|
2,940 sq. feet
|
4 baths 4 beds |
show details | |

|
#27
Britt St NE
Albuquerque, NM 87112
|
1,828 sq. feet
|
2 baths 3 beds |
show details | |

|
#28
Congress Ave NW
Albuquerque, NM 87114
|
1,595 sq. feet
|
2 baths 3 beds |
show details | |

|
#29
Summit Hills Dr NE
Albuquerque, NM 87112
|
2,657 sq. feet
|
3 baths 3 beds |
show details | |

|
#30
Russell Dr NW
Albuquerque, NM 87114
|
1,840 sq. feet
|
2 baths 3 beds |
show details |
| Photo | Address | Area | Beds / Baths | Price | Details |
|---|---|---|---|---|---|

|
#31
La Rocca Rd NW
Albuquerque, NM 87114
|
2,785 sq. feet
|
3 baths 4 beds |
show details | |

|
#32
Chantilly Rd NW
Albuquerque, NM 87114
|
1,904 sq. feet
|
2 baths 3 beds |
show details | |

|
#33
Churchill Rd SW
Albuquerque, NM 87105
|
1,868 sq. feet
|
2 baths 2 beds |
show details | |

|
#34
Towner Ave NE
Albuquerque, NM 87112
|
1,985 sq. feet
|
2 baths 3 beds |
show details | |

|
#35
Escobar Ct SW
Albuquerque, NM 87121
|
1,860 sq. feet
|
2 baths 3 beds |
show details | |

|
#36
Rio Puerco Trl SW
Albuquerque, NM 87121
|
2,010 sq. feet
|
3 baths 3 beds |
show details | |

|
#37
57th St SW
Albuquerque, NM 87121
|
1,555 sq. feet
|
2 baths 3 beds |
show details | |

|
#38
97th St SW
Albuquerque, NM 87121
|
1,467 sq. feet
|
2 baths 3 beds |
show details | |

|
#39
King Ranch Ln SW
Albuquerque, NM 87121
|
2,300 sq. feet
|
2 baths 4 beds |
show details | |

|
#40
Tree Line Ave NW
Albuquerque, NM 87114
|
2,292 sq. feet
|
4 baths 4 beds |
show details |
| Photo | Address | Area | Beds / Baths | Price | Details |
|---|---|---|---|---|---|

|
#41
Rafael Rd SW
Albuquerque, NM 87121
|
1,598 sq. feet
|
2 baths 3 beds |
show details | |

|
#42
Terracotta Pl SW
Albuquerque, NM 87121
|
1,820 sq. feet
|
2 baths 4 beds |
show details | |

|
#43
Cold Creek Ave NW
Albuquerque, NM 87114
|
1,568 sq. feet
|
2 baths 2 beds |
show details | |

|
#44
Powers Way Rd SW
Albuquerque, NM 87121
|
1,290 sq. feet
|
1 baths 2 beds |
show details | |

|
#45
La Media Rd SW
Albuquerque, NM 87105
|
2,480 sq. feet
|
1 baths 2 beds |
show details | |

|
#46
Via Del Oro SW
Albuquerque, NM 87121
|
1,194 sq. feet
|
2 baths 3 beds |
show details | |

|
#47
Jewel Pl NE
Albuquerque, NM 87123
|
1,769 sq. feet
|
2 baths 4 beds |
show details | |

|
#48
Elfego Baca Dr SW
Albuquerque, NM 87121
|
1,456 sq. feet
|
3 baths 4 beds |
show details | |

|
#49
46th St NW
Albuquerque, NM 87105
|
1,560 sq. feet
|
2 baths 3 beds |
show details | |

|
Check over 1 million property listings on Foreclosure.com!
|
browse all offers | |||


 | South Valley Well Water Availability & Maintenance (0 replies) |
| I'm fascinated by the history of "The War Zone" (59 replies) |
| Apartments with a Good Noise Insulation (8 replies) |
| ALB neighborhoods (27 replies) |
| Leaving Las Cruces (182 replies) |
| Looking for recommendations on housing near Kirtland AFB (30 replies) |

Median year apartment built: 1969
Household type by relationship:
Households: 37,479- Male householders: 6,555 (2,261 living alone), Female householders: 6,562 (1,564 living alone)
5,786 spouses (5,725 opposite-sex spouses), 838 unmarried partners, (778 opposite-sex unmarried partners), 11,963 children (11,313 natural, 149 adopted, 500 stepchildren), 1,828 grandchildren, 654 brothers or sisters, 650 parents, 61 foster children, 1,119 other relatives, 927 non-relatives
- In group quarters: 530
Size of family households: 3,598 2-persons, 1,952 3-persons, 1,569 4-persons, 976 5-persons, 439 6-persons, 276 7-or-more-persons.
Size of nonfamily households: 4,006 1-person, 454 2-persons, 39 3-persons, 5 4-persons.
3,752 married couples with children.
2,606 single-parent households (588 men, 2,018 women).
51.8% of residents of South Valley speak English at home.
47.2% of residents speak Spanish at home (66% speak English very well, 18% speak English well, 10% speak English not well, 5% don't speak English at all).
0.5% of residents speak other Indo-European language at home (99% speak English very well, 1% speak English well).
0.1% of residents speak Asian or Pacific Island language at home (100% speak English very well).
0.4% of residents speak other language at home (77% speak English very well, 6% speak English well, 17% speak English not well).
Foreign born population: 5,356 (14.3%)
(46.0% of them are naturalized citizens)
| Here: | 5.9 |
| State: | 5.9 |
| Here: | 4.8 |
| State: | 4.2 |

- Bedrooms in owner-occupied houses and condos in South Valley, New Mexico
- 82no bedroom
- 3541 bedroom
- 2,1362 bedrooms
- 4,9523 bedrooms
- 1,8334 bedrooms
- 2525+ bedrooms

- Bedrooms in renter-occupied apartments in South Valley, New Mexico
- 74no bedroom
- 5101 bedroom
- 1,7502 bedrooms
- 1,1233 bedrooms
- 2944 bedrooms
- 515+ bedrooms

- Cars and other vehicles available in South Valley in owner-occupied houses/condos
- 442no vehicle
- 2,3151 vehicle
- 3,6072 vehicles
- 1,9483 vehicles
- 8384 vehicles
- 4585+ vehicles

- Cars and other vehicles available in South Valley in renter-occupied apartments
- 433no vehicle
- 1,4511 vehicle
- 1,2552 vehicles
- 5253 vehicles
- 1054 vehicles
- 345+ vehicles

- Rooms in owner-occupied houses in South Valley, New Mexico
- 561 room
- 502 rooms
- 1703 rooms
- 1,2364 rooms
- 2,3295 rooms
- 2,1416 rooms
- 1,5967 rooms
- 7828 rooms
- 1,2489+ rooms

- Rooms in renter-occupied apartments in South Valley, New Mexico
- 741 room
- 1042 rooms
- 7393 rooms
- 6734 rooms
- 9005 rooms
- 6626 rooms
- 3667 rooms
- 1358 rooms
- 1519+ rooms


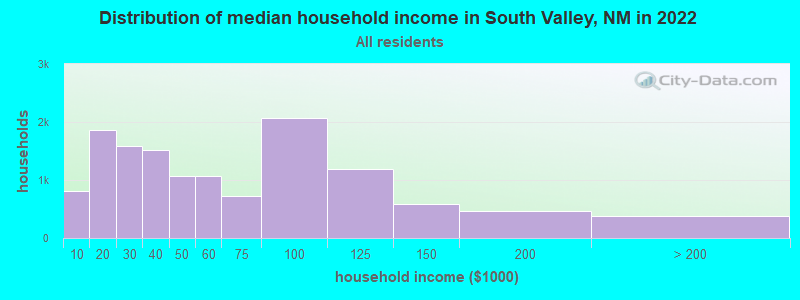
South Valley, NM household income distribution

- 812Less than $10,000
- 1,870$10,000 to $19,999
- 1,582$20,000 to $29,999
- 1,521$30,000 to $39,999
- 1,064$40,000 to $49,999
- 1,064$50,000 to $59,999
- 723$60,000 to $74,999
- 2,072$75,000 to $99,999
- 1,188$100,000 to $124,999
- 591$125,000 to $149,999
- 467$150,000 to $199,999
- 373$200,000 or more
Home value of owner - occupied houses in 2022 in South Valley, NM
-
- 153Less than $10,000
- 241$10,000 to $14,999
- 73$15,000 to $19,999
- 150$20,000 to $24,999
- 9$25,000 to $29,999
- 270$30,000 to $34,999
- 161$35,000 to $39,999
- 376$40,000 to $49,999
- 37$50,000 to $59,999
- 285$60,000 to $69,999
- 55$70,000 to $79,999
- 175$80,000 to $89,999
- 74$90,000 to $99,999
- 408$100,000 to $124,999
- 573$125,000 to $149,999
- 1,041$150,000 to $174,999
- 431$175,000 to $199,999
- 1,665$200,000 to $249,999
- 827$250,000 to $299,999
- 1,210$300,000 to $399,999
- 523$400,000 to $499,999
- 535$500,000 to $749,999
- 75$750,000 to $999,999
- 40$1,000,000 to $1,499,999
- 23$2,000,000 or more

Rent paid by renters in 2022 in South Valley, NM
-
- 8Less than $100
- 52$100 to $149
- 35$150 to $199
- 42$200 to $249
- 20$250 to $299
- 17$300 to $349
- 107$350 to $399
- 114$400 to $449
- 138$450 to $499
- 441$500 to $549
- 97$550 to $599
- 209$600 to $649
- 52$650 to $699
- 413$700 to $749
- 237$750 to $799
- 343$800 to $899
- 175$900 to $999
- 234$1,000 to $1,249
- 101$1,250 to $1,499
- 104$1,500 to $1,999
- 625No cash rent


Percentage of workers working in this county: 92.3%
Number of people working at home: 1,498 (9.6% of all workers)
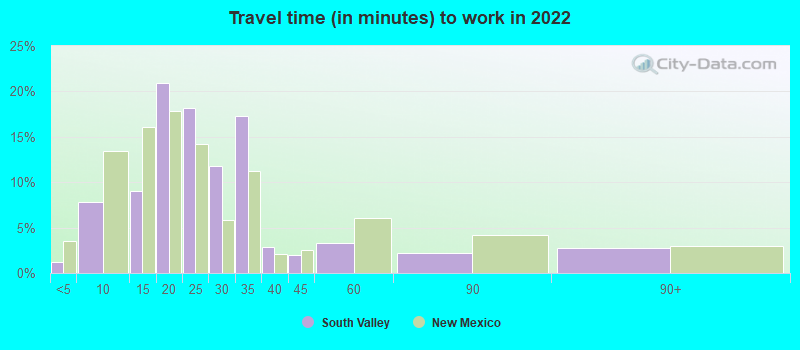
Travel time to work (commute)
- Less than 5 minutes: 111
- 5 to 9 minutes: 651
- 10 to 14 minutes: 1,389
- 15 to 19 minutes: 2,395
- 20 to 24 minutes: 2,993
- 25 to 29 minutes: 1,320
- 30 to 34 minutes: 2,222
- 35 to 39 minutes: 477
- 40 to 44 minutes: 345
- 45 to 59 minutes: 888
- 60 to 89 minutes: 865
- 90 or more minutes: 405
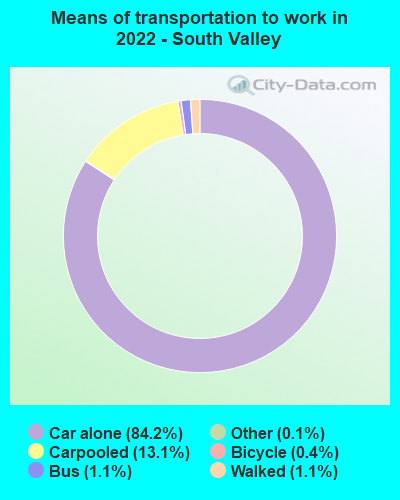
Means of transportation to work:
- Drove a car alone: 6,107 (69.4%)
- Carpooled: 1,082 (12.3%)
- Bus: 82 (0.9%)
- Taxi: 7 (0.1%)
- Bicycle: 43 (0.5%)
- Walked: 81 (0.9%)
- Worked at home: 1,498 (17.0%)

- Unemployment by race in 2022
- Unemployment rate for White non-Hispanic residents
- 2.5%Males
- 7.0%Females
- Unemployment rate for Black residents
- 36.9%Males
- Unemployment rate for Asian residents
- 49.2%Males
- Unemployment rate for other race residents
- 7.7%Males
- 14.6%Females
- Unemployment rate for two or more race residents
- 0.9%Males
- Unemployment rate for Hispanic or Latino residents
- 5.4%Males
- 3.7%Females

- Year of entry for the foreign-born population in South Valley, New Mexico
- 1,0732010 or later
- 1,2472000 to 2009
- 1,4881990 to 1999
- 1,4521980 to 1989
- 7211970 to 1979
- 332Before 1970

First ancestries reported:
- American: 877 (3.7%)
- German: 514 (2.2%)
- English: 329 (1.4%)
- European: 244 (1.0%)
- Irish: 148 (0.6%)
- Italian: 146 (0.6%)
- Ukrainian: 75 (0.3%)
- Scotch-Irish: 58 (0.2%)
- Hungarian: 43 (0.2%)
- French Canadian: 40 (0.2%)
- Greek: 38 (0.2%)
- Northern European: 36 (0.2%)
- British: 34 (0.1%)
- Danish: 34 (0.1%)
- Scottish: 32 (0.1%)
- Lebanese: 26 (0.1%)
- Dutch: 20 (0.08%)
- French: 17 (0.07%)
- Egyptian: 15 (0.06%)
- Croatian: 13 (0.05%)
- Swedish: 13 (0.05%)
- Nigerian: 12 (0.05%)
- Jamaican: 11 (0.05%)
- Czech: 10 (0.04%)
- Polish: 10 (0.04%)
- Russian: 7 (0.03%)
- Scandinavian: 7 (0.03%)
- Eastern European: 6 (0.03%)
- Slavic: 2 (0.01%)
Most common places of birth for foreign-born residents (%):
| South Valley: | 86.6% (4,867) |
| New Mexico: | 66.5% (129,316) |
| South Valley: | 3.2% (178) |
| New Mexico: | 1.5% (2,989) |
| South Valley: | 2.0% (112) |
| New Mexico: | 0.2% (383) |
Place of birth for U.S.-born residents:
- This state: 25,167
- Other state: 6,421
- Northeast: 728
- Midwest: 1,210
- South: 1,522
- West: 2,939
93.6% of South Valley residents lived in the same house 1 years ago.
Out of people who lived in different houses, 38.9% lived in this county.
Out of people who lived in different counties, 21.9% lived in New Mexico.
| South Valley: | 93.6% |
| State average: | 88.2% |
Education attainment for males 25 years and older:
- No schooling: 497
- Nursery to 4th grade: 122
- 5th and 6th grade: 792
- 7th and 8th grade: 160
- 9th grade: 439
- 10th grade: 358
- 11th grade: 296
- 12th grade, no diploma: 386
- High school graduate (or equivalency): 5,073
- Less than 1 year of college: 763
- Some college more than 1 year, no degree: 1,533
- Associate degree: 1,025
- Bachelor's degree: 1,183
- Master's degree: 611
- Professional school degree: 46
- Doctorate degree: 129

Education attainment for females 25 years and older:
- No schooling: 338
- Nursery to 4th grade: 140
- 5th and 6th grade: 395
- 7th and 8th grade: 174
- 9th grade: 294
- 10th grade: 381
- 11th grade: 264
- 12th grade, no diploma: 147
- High school graduate (or equivalency): 4,469
- Less than 1 year of college: 963
- Some college more than 1 year, no degree: 1,615
- Associate degree: 1,066
- Bachelor's degree: 1,145
- Master's degree: 642
- Professional school degree: 43
- Doctorate degree: 60


Housing units in structures:
- One, detached: 11,188
- One, attached: 249
- Two: 374
- 3 or 4: 280
- 5 to 9: 186
- 10 to 19: 77
- 20 to 49: 55
- 50 or more: 150
- Mobile homes: 1,962
Median worth of mobile homes: $52,300
Housing units lacking complete kitchen facilities in 2022: 3.2%
House/condo owner moved in on average 19 years ago
Renter moved in on average 5 years ago

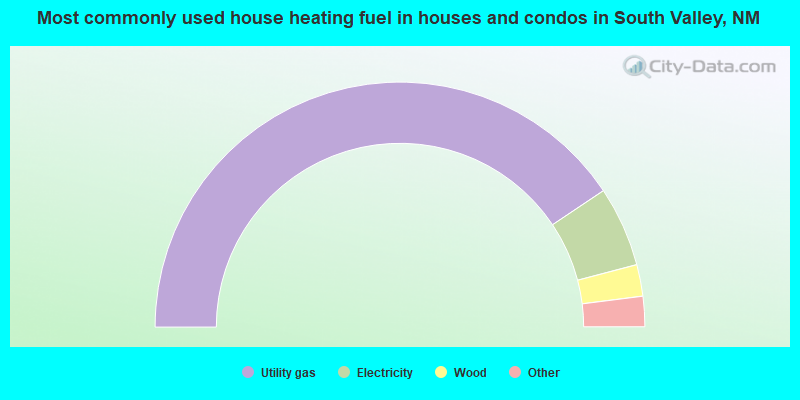
- 81.3%Utility gas
- 10.6%Electricity
- 4.2%Wood
- 1.5%Bottled, tank, or LP gas
- 1.0%Solar energy
- 1.0%Other fuel
- 0.5%No fuel used
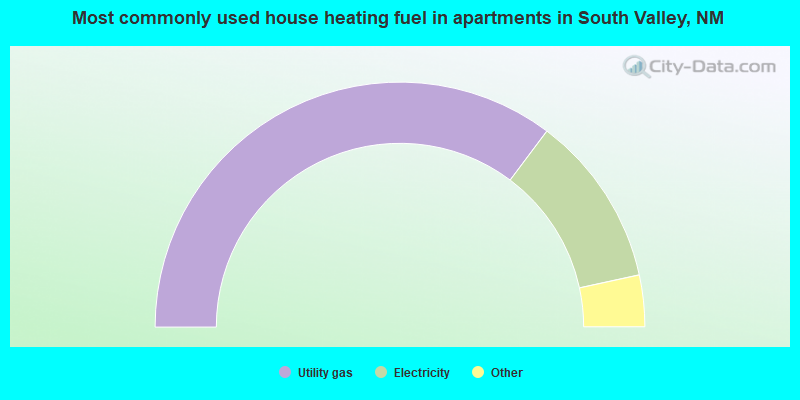
- 70.5%Utility gas
- 22.7%Electricity
- 3.2%Bottled, tank, or LP gas
- 1.6%Wood
- 1.3%Other fuel
- 0.7%No fuel used
Private vs. public school enrollment:
| Here: | 6.5% |
| New Mexico: | 10.2% |
| Here: | 11.1% |
| New Mexico: | 10.0% |
| Here: | 9.4% |
| New Mexico: | 12.3% |


