Laurel, Virginia Submit your own pictures of this place and show them to the world
OSM Map
General Map
Google Map
MSN Map
OSM Map
General Map
Google Map
MSN Map
OSM Map
General Map
Google Map
MSN Map
OSM Map
General Map
Google Map
MSN Map
Please wait while loading the map...
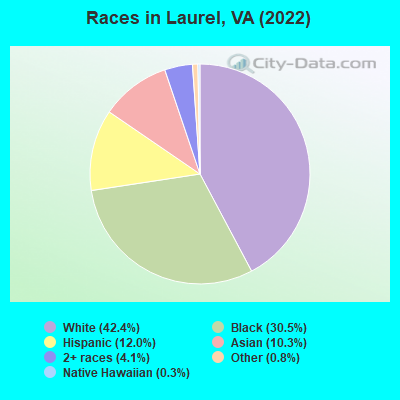
Population in 2010: 16,713. Population change since 2000: +12.4%Males: 8,204 Females: 8,509
March 2022 cost of living index in Laurel: 93.5 (less than average, U.S. average is 100) Percentage of residents living in poverty in 2022: 8.5%for White Non-Hispanic residents , 12.0% for Black residents , 15.4% for Hispanic or Latino residents , 22.3% for other race residents , 1.8% for two or more races residents )Business Search - 14 Million verified businesses
Data:
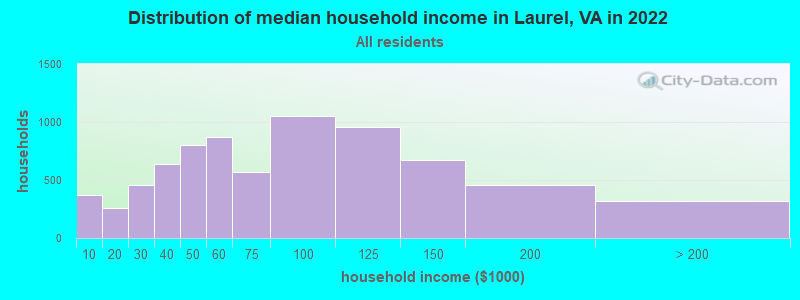
Median household income ($)
Median household income (% change since 2000)
Household income diversity
Ratio of average income to average house value (%)
Ratio of average income to average rent
Median household income ($) - White
Median household income ($) - Black or African American
Median household income ($) - Asian
Median household income ($) - Hispanic or Latino
Median household income ($) - American Indian and Alaska Native
Median household income ($) - Multirace
Median household income ($) - Other Race
Median household income for houses/condos with a mortgage ($)
Median household income for apartments without a mortgage ($)
Races - White alone (%)
Races - White alone (% change since 2000)
Races - Black alone (%)
Races - Black alone (% change since 2000)
Races - American Indian alone (%)
Races - American Indian alone (% change since 2000)
Races - Asian alone (%)
Races - Asian alone (% change since 2000)
Races - Hispanic (%)
Races - Hispanic (% change since 2000)
Races - Native Hawaiian and Other Pacific Islander alone (%)
Races - Native Hawaiian and Other Pacific Islander alone (% change since 2000)
Races - Two or more races (%)
Races - Two or more races (% change since 2000)
Races - Other race alone (%)
Races - Other race alone (% change since 2000)
Racial diversity
Unemployment (%)
Unemployment (% change since 2000)
Unemployment (%) - White
Unemployment (%) - Black or African American
Unemployment (%) - Asian
Unemployment (%) - Hispanic or Latino
Unemployment (%) - American Indian and Alaska Native
Unemployment (%) - Multirace
Unemployment (%) - Other Race
Population density (people per square mile)
Population - Males (%)
Population - Females (%)
Population - Males (%) - White
Population - Males (%) - Black or African American
Population - Males (%) - Asian
Population - Males (%) - Hispanic or Latino
Population - Males (%) - American Indian and Alaska Native
Population - Males (%) - Multirace
Population - Males (%) - Other Race
Population - Females (%) - White
Population - Females (%) - Black or African American
Population - Females (%) - Asian
Population - Females (%) - Hispanic or Latino
Population - Females (%) - American Indian and Alaska Native
Population - Females (%) - Multirace
Population - Females (%) - Other Race
Coronavirus confirmed cases (Jun 10, 2024)
Deaths caused by coronavirus (Jun 10, 2024)
Coronavirus confirmed cases (per 100k population) (Jun 10, 2024)
Deaths caused by coronavirus (per 100k population) (Jun 10, 2024)
Daily increase in number of cases (Jun 10, 2024)
Weekly increase in number of cases (Jun 10, 2024)
Cases doubled (in days) (Jun 10, 2024)
Hospitalized patients (Apr 18, 2022)
Negative test results (Apr 18, 2022)
Total test results (Apr 18, 2022)
COVID Vaccine doses distributed (per 100k population) (Sep 19, 2023)
COVID Vaccine doses administered (per 100k population) (Sep 19, 2023)
COVID Vaccine doses distributed (Sep 19, 2023)
COVID Vaccine doses administered (Sep 19, 2023)
Likely homosexual households (%)
Likely homosexual households (% change since 2000)
Likely homosexual households - Lesbian couples (%)
Likely homosexual households - Lesbian couples (% change since 2000)
Likely homosexual households - Gay men (%)
Likely homosexual households - Gay men (% change since 2000)
Cost of living index
Median gross rent ($)
Median contract rent ($)
Median monthly housing costs ($)
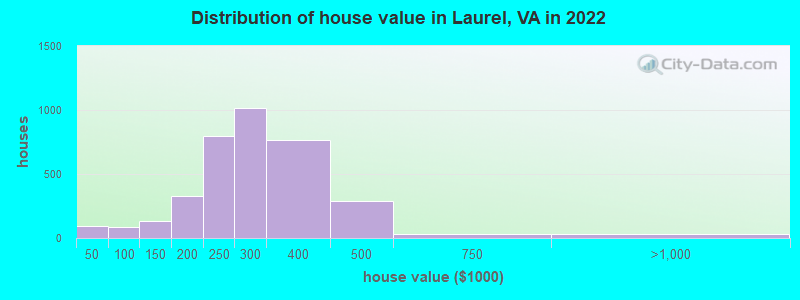
Median house or condo value ($)
Median house or condo value ($ change since 2000)
Mean house or condo value by units in structure - 1, detached ($)
Mean house or condo value by units in structure - 1, attached ($)
Mean house or condo value by units in structure - 2 ($)
Mean house or condo value by units in structure by units in structure - 3 or 4 ($)
Mean house or condo value by units in structure - 5 or more ($)
Mean house or condo value by units in structure - Boat, RV, van, etc. ($)
Mean house or condo value by units in structure - Mobile home ($)
Median house or condo value ($) - White
Median house or condo value ($) - Black or African American
Median house or condo value ($) - Asian
Median house or condo value ($) - Hispanic or Latino
Median house or condo value ($) - American Indian and Alaska Native
Median house or condo value ($) - Multirace
Median house or condo value ($) - Other Race
Median resident age
Resident age diversity
Median resident age - Males
Median resident age - Females
Median resident age - White
Median resident age - Black or African American
Median resident age - Asian
Median resident age - Hispanic or Latino
Median resident age - American Indian and Alaska Native
Median resident age - Multirace
Median resident age - Other Race
Median resident age - Males - White
Median resident age - Males - Black or African American
Median resident age - Males - Asian
Median resident age - Males - Hispanic or Latino
Median resident age - Males - American Indian and Alaska Native
Median resident age - Males - Multirace
Median resident age - Males - Other Race
Median resident age - Females - White
Median resident age - Females - Black or African American
Median resident age - Females - Asian
Median resident age - Females - Hispanic or Latino
Median resident age - Females - American Indian and Alaska Native
Median resident age - Females - Multirace
Median resident age - Females - Other Race
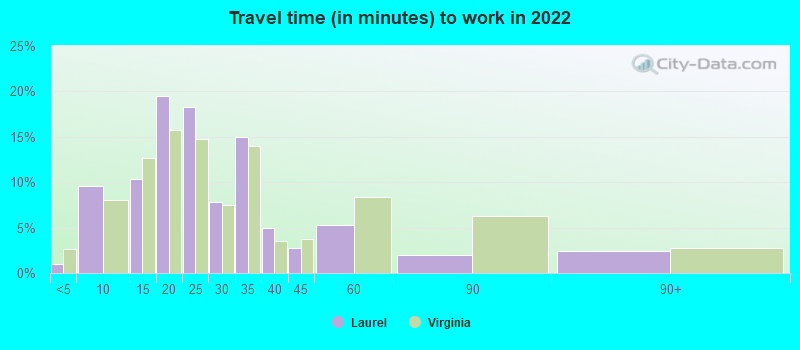
Commute - mean travel time to work (minutes)
Travel time to work - Less than 5 minutes (%)
Travel time to work - Less than 5 minutes (% change since 2000)
Travel time to work - 5 to 9 minutes (%)
Travel time to work - 5 to 9 minutes (% change since 2000)
Travel time to work - 10 to 19 minutes (%)
Travel time to work - 10 to 19 minutes (% change since 2000)
Travel time to work - 20 to 29 minutes (%)
Travel time to work - 20 to 29 minutes (% change since 2000)
Travel time to work - 30 to 39 minutes (%)
Travel time to work - 30 to 39 minutes (% change since 2000)
Travel time to work - 40 to 59 minutes (%)
Travel time to work - 40 to 59 minutes (% change since 2000)
Travel time to work - 60 to 89 minutes (%)
Travel time to work - 60 to 89 minutes (% change since 2000)
Travel time to work - 90 or more minutes (%)
Travel time to work - 90 or more minutes (% change since 2000)
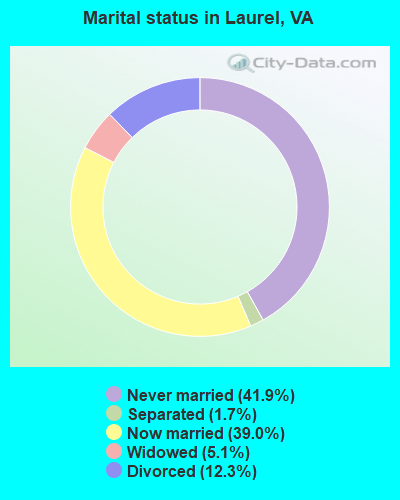
Marital status - Never married (%)
Marital status - Now married (%)
Marital status - Separated (%)
Marital status - Widowed (%)
Marital status - Divorced (%)
Median family income ($)
Median family income (% change since 2000)
Median non-family income ($)
Median non-family income (% change since 2000)
Median per capita income ($)
Median per capita income (% change since 2000)
Median family income ($) - White
Median family income ($) - Black or African American
Median family income ($) - Asian
Median family income ($) - Hispanic or Latino
Median family income ($) - American Indian and Alaska Native
Median family income ($) - Multirace
Median family income ($) - Other Race
Median year house/condo built
Median year apartment built
Year house built - Built 2005 or later (%)
Year house built - Built 2000 to 2004 (%)
Year house built - Built 1990 to 1999 (%)
Year house built - Built 1980 to 1989 (%)
Year house built - Built 1970 to 1979 (%)
Year house built - Built 1960 to 1969 (%)
Year house built - Built 1950 to 1959 (%)
Year house built - Built 1940 to 1949 (%)
Year house built - Built 1939 or earlier (%)
Average household size
Household density (households per square mile)
Average household size - White
Average household size - Black or African American
Average household size - Asian
Average household size - Hispanic or Latino
Average household size - American Indian and Alaska Native
Average household size - Multirace
Average household size - Other Race
Occupied housing units (%)
Vacant housing units (%)
Owner occupied housing units (%)
Renter occupied housing units (%)
Vacancy status - For rent (%)
Vacancy status - For sale only (%)
Vacancy status - Rented or sold, not occupied (%)
Vacancy status - For seasonal, recreational, or occasional use (%)
Vacancy status - For migrant workers (%)
Vacancy status - Other vacant (%)
Residents with income below the poverty level (%)
Residents with income below 50% of the poverty level (%)
Children below poverty level (%)
Poor families by family type - Married-couple family (%)
Poor families by family type - Male, no wife present (%)
Poor families by family type - Female, no husband present (%)
Poverty status for native-born residents (%)
Poverty status for foreign-born residents (%)
Poverty among high school graduates not in families (%)
Poverty among people who did not graduate high school not in families (%)
Residents with income below the poverty level (%) - White
Residents with income below the poverty level (%) - Black or African American
Residents with income below the poverty level (%) - Asian
Residents with income below the poverty level (%) - Hispanic or Latino
Residents with income below the poverty level (%) - American Indian and Alaska Native
Residents with income below the poverty level (%) - Multirace
Residents with income below the poverty level (%) - Other Race
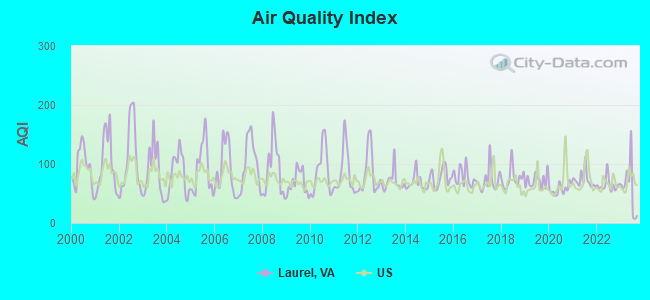
Air pollution - Air Quality Index (AQI)
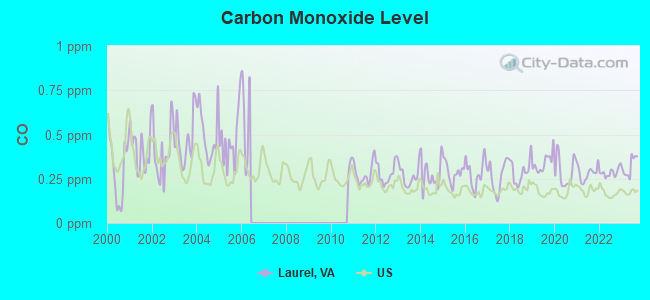
Air pollution - CO
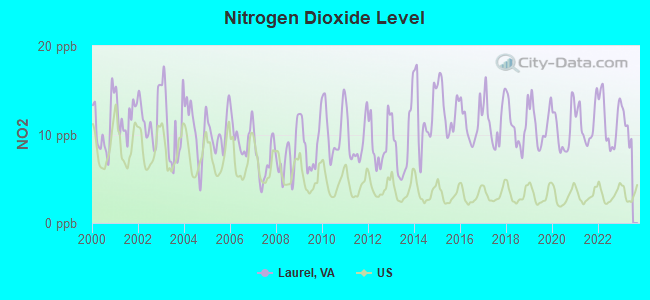
Air pollution - NO2
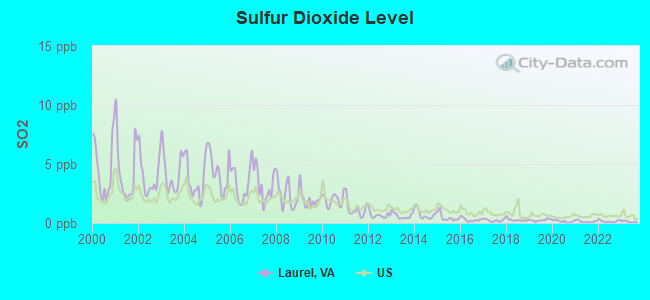
Air pollution - SO2
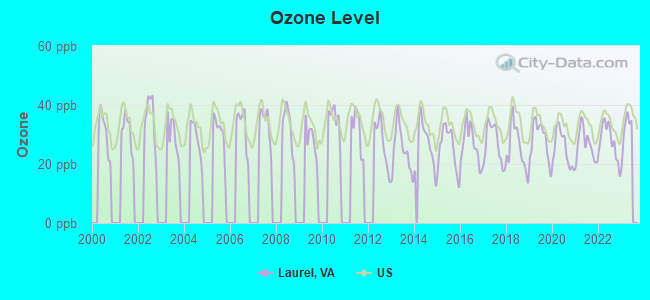
Air pollution - Ozone
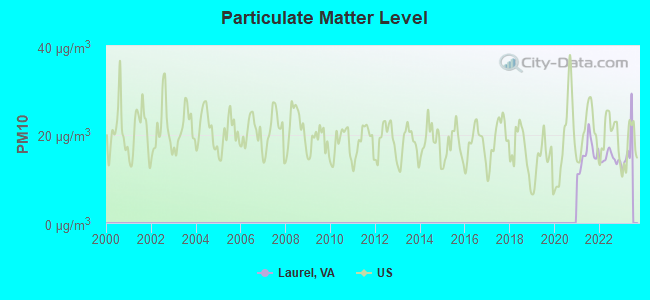
Air pollution - PM10
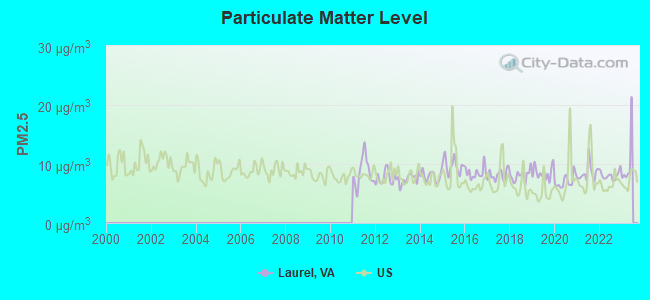
Air pollution - PM25
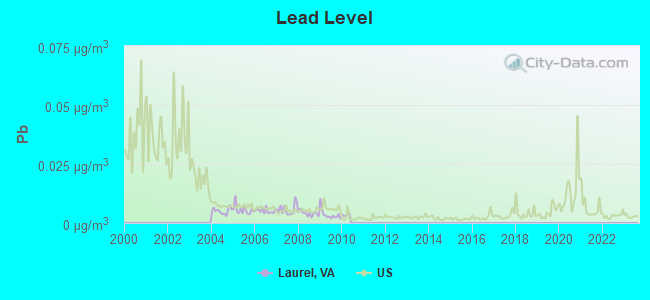
Air pollution - Pb
Crime - Murders per 100,000 population
Crime - Rapes per 100,000 population
Crime - Robberies per 100,000 population
Crime - Assaults per 100,000 population
Crime - Burglaries per 100,000 population
Crime - Thefts per 100,000 population
Crime - Auto thefts per 100,000 population
Crime - Arson per 100,000 population
Crime - City-data.com crime index
Crime - Violent crime index
Crime - Property crime index
Crime - Murders per 100,000 population (5 year average)
Crime - Rapes per 100,000 population (5 year average)
Crime - Robberies per 100,000 population (5 year average)
Crime - Assaults per 100,000 population (5 year average)
Crime - Burglaries per 100,000 population (5 year average)
Crime - Thefts per 100,000 population (5 year average)
Crime - Auto thefts per 100,000 population (5 year average)
Crime - Arson per 100,000 population (5 year average)
Crime - City-data.com crime index (5 year average)
Crime - Violent crime index (5 year average)
Crime - Property crime index (5 year average)
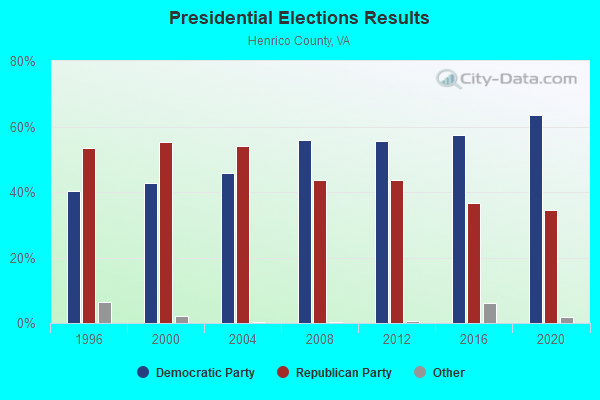
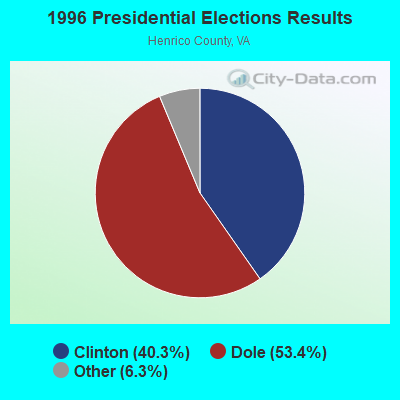
1996 Presidential Elections Results (%) - Democratic Party (Clinton)
1996 Presidential Elections Results (%) - Republican Party (Dole)
1996 Presidential Elections Results (%) - Other
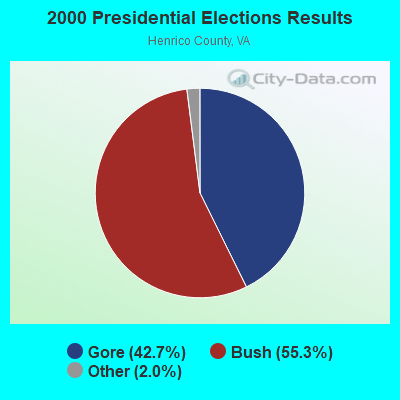
2000 Presidential Elections Results (%) - Democratic Party (Gore)
2000 Presidential Elections Results (%) - Republican Party (Bush)
2000 Presidential Elections Results (%) - Other
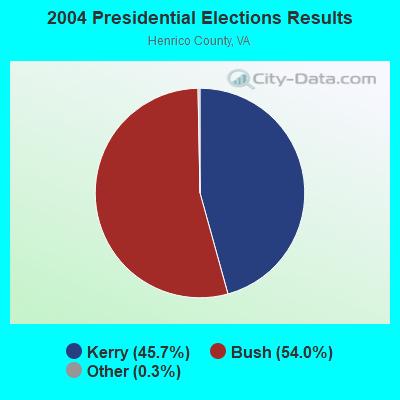
2004 Presidential Elections Results (%) - Democratic Party (Kerry)
2004 Presidential Elections Results (%) - Republican Party (Bush)
2004 Presidential Elections Results (%) - Other
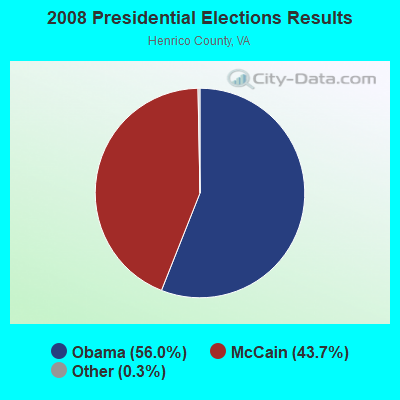
2008 Presidential Elections Results (%) - Democratic Party (Obama)
2008 Presidential Elections Results (%) - Republican Party (McCain)
2008 Presidential Elections Results (%) - Other
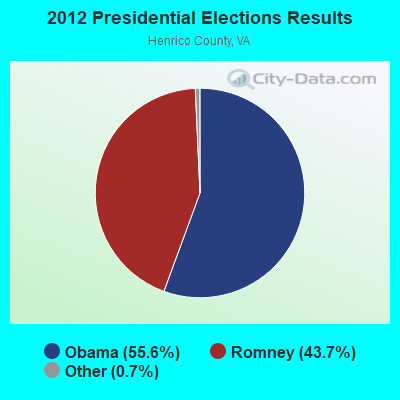
2012 Presidential Elections Results (%) - Democratic Party (Obama)
2012 Presidential Elections Results (%) - Republican Party (Romney)
2012 Presidential Elections Results (%) - Other
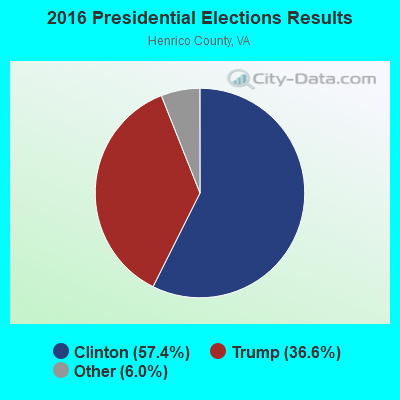
2016 Presidential Elections Results (%) - Democratic Party (Clinton)
2016 Presidential Elections Results (%) - Republican Party (Trump)
2016 Presidential Elections Results (%) - Other
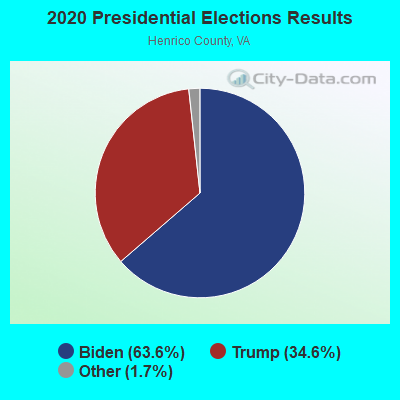
2020 Presidential Elections Results (%) - Democratic Party (Biden)
2020 Presidential Elections Results (%) - Republican Party (Trump)
2020 Presidential Elections Results (%) - Other
Ancestries Reported - Arab (%)
Ancestries Reported - Czech (%)
Ancestries Reported - Danish (%)
Ancestries Reported - Dutch (%)
Ancestries Reported - English (%)
Ancestries Reported - French (%)
Ancestries Reported - French Canadian (%)
Ancestries Reported - German (%)
Ancestries Reported - Greek (%)
Ancestries Reported - Hungarian (%)
Ancestries Reported - Irish (%)
Ancestries Reported - Italian (%)
Ancestries Reported - Lithuanian (%)
Ancestries Reported - Norwegian (%)
Ancestries Reported - Polish (%)
Ancestries Reported - Portuguese (%)
Ancestries Reported - Russian (%)
Ancestries Reported - Scotch-Irish (%)
Ancestries Reported - Scottish (%)
Ancestries Reported - Slovak (%)
Ancestries Reported - Subsaharan African (%)
Ancestries Reported - Swedish (%)
Ancestries Reported - Swiss (%)
Ancestries Reported - Ukrainian (%)
Ancestries Reported - United States (%)
Ancestries Reported - Welsh (%)
Ancestries Reported - West Indian (%)
Ancestries Reported - Other (%)
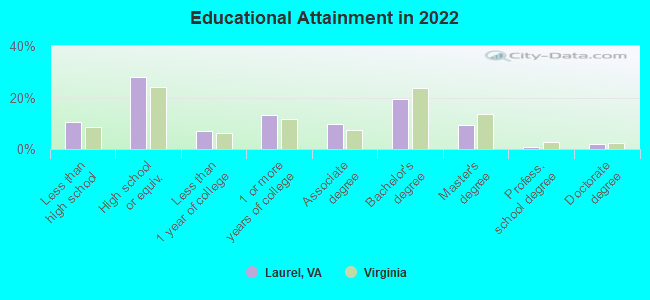
Educational Attainment - No schooling completed (%)
Educational Attainment - Less than high school (%)
Educational Attainment - High school or equivalent (%)
Educational Attainment - Less than 1 year of college (%)
Educational Attainment - 1 or more years of college (%)
Educational Attainment - Associate degree (%)
Educational Attainment - Bachelor's degree (%)
Educational Attainment - Master's degree (%)
Educational Attainment - Professional school degree (%)
Educational Attainment - Doctorate degree (%)
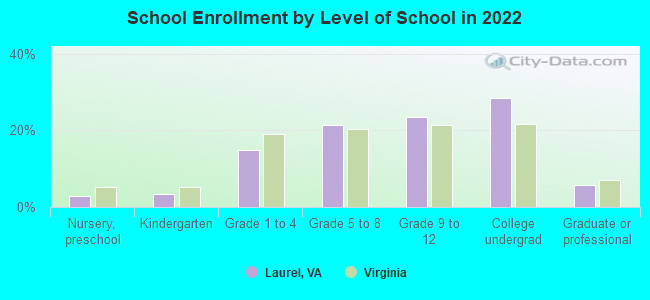
School Enrollment - Nursery, preschool (%)
School Enrollment - Kindergarten (%)
School Enrollment - Grade 1 to 4 (%)
School Enrollment - Grade 5 to 8 (%)
School Enrollment - Grade 9 to 12 (%)
School Enrollment - College undergrad (%)
School Enrollment - Graduate or professional (%)
School Enrollment - Not enrolled in school (%)
School enrollment - Public schools (%)
School enrollment - Private schools (%)
School enrollment - Not enrolled (%)
Median number of rooms in houses and condos
Median number of rooms in apartments
Housing units lacking complete plumbing facilities (%)
Housing units lacking complete kitchen facilities (%)
Density of houses
Urban houses (%)
Rural houses (%)
Households with people 60 years and over (%)
Households with people 65 years and over (%)
Households with people 75 years and over (%)
Households with one or more nonrelatives (%)
Households with no nonrelatives (%)
Population in households (%)
Family households (%)
Nonfamily households (%)
Population in families (%)
Family households with own children (%)
Median number of bedrooms in owner occupied houses
Mean number of bedrooms in owner occupied houses
Median number of bedrooms in renter occupied houses
Mean number of bedrooms in renter occupied houses
Median number of vehichles in owner occupied houses
Mean number of vehichles in owner occupied houses
Median number of vehichles in renter occupied houses
Mean number of vehichles in renter occupied houses
Mortgage status - with mortgage (%)
Mortgage status - with second mortgage (%)
Mortgage status - with home equity loan (%)
Mortgage status - with both second mortgage and home equity loan (%)
Mortgage status - without a mortgage (%)
Average family size
Average family size - White
Average family size - Black or African American
Average family size - Asian
Average family size - Hispanic or Latino
Average family size - American Indian and Alaska Native
Average family size - Multirace
Average family size - Other Race
Geographical mobility - Same house 1 year ago (%)
Geographical mobility - Moved within same county (%)
Geographical mobility - Moved from different county within same state (%)
Geographical mobility - Moved from different state (%)
Geographical mobility - Moved from abroad (%)
Place of birth - Born in state of residence (%)
Place of birth - Born in other state (%)
Place of birth - Native, outside of US (%)
Place of birth - Foreign born (%)
Housing units in structures - 1, detached (%)
Housing units in structures - 1, attached (%)
Housing units in structures - 2 (%)
Housing units in structures - 3 or 4 (%)
Housing units in structures - 5 to 9 (%)
Housing units in structures - 10 to 19 (%)
Housing units in structures - 20 to 49 (%)
Housing units in structures - 50 or more (%)
Housing units in structures - Mobile home (%)
Housing units in structures - Boat, RV, van, etc. (%)
House/condo owner moved in on average (years ago)
Renter moved in on average (years ago)
Year householder moved into unit - Moved in 1999 to March 2000 (%)
Year householder moved into unit - Moved in 1995 to 1998 (%)
Year householder moved into unit - Moved in 1990 to 1994 (%)
Year householder moved into unit - Moved in 1980 to 1989 (%)
Year householder moved into unit - Moved in 1970 to 1979 (%)
Year householder moved into unit - Moved in 1969 or earlier (%)
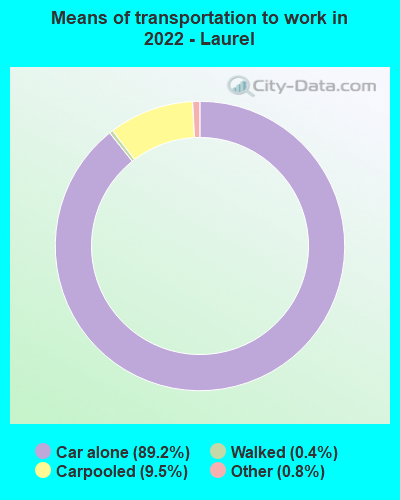
Means of transportation to work - Drove car alone (%)
Means of transportation to work - Carpooled (%)
Means of transportation to work - Public transportation (%)
Means of transportation to work - Bus or trolley bus (%)
Means of transportation to work - Streetcar or trolley car (%)
Means of transportation to work - Subway or elevated (%)
Means of transportation to work - Railroad (%)
Means of transportation to work - Ferryboat (%)
Means of transportation to work - Taxicab (%)
Means of transportation to work - Motorcycle (%)
Means of transportation to work - Bicycle (%)
Means of transportation to work - Walked (%)
Means of transportation to work - Other means (%)
Working at home (%)
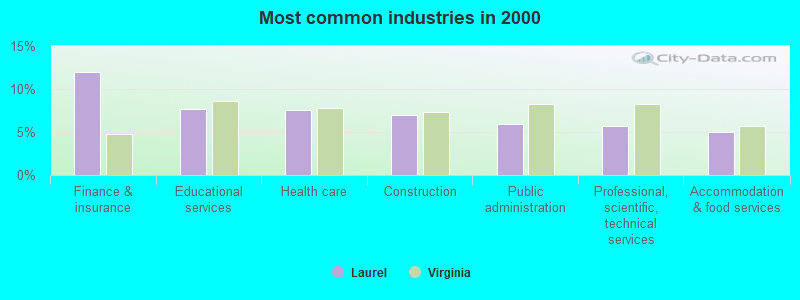
Industry diversity
Most Common Industries - Agriculture, forestry, fishing and hunting, and mining (%)
Most Common Industries - Agriculture, forestry, fishing and hunting (%)
Most Common Industries - Mining, quarrying, and oil and gas extraction (%)
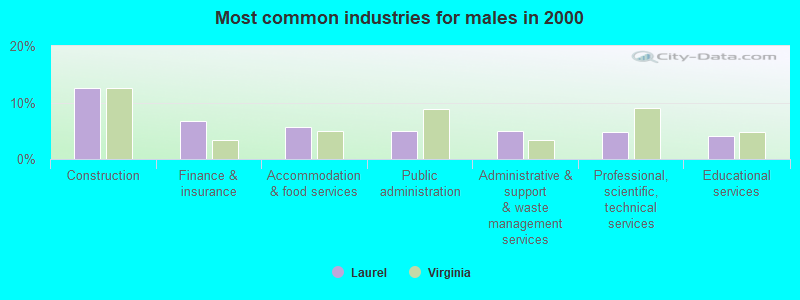
Most Common Industries - Construction (%)
Most Common Industries - Manufacturing (%)
Most Common Industries - Wholesale trade (%)
Most Common Industries - Retail trade (%)
Most Common Industries - Transportation and warehousing, and utilities (%)
Most Common Industries - Transportation and warehousing (%)
Most Common Industries - Utilities (%)
Most Common Industries - Information (%)
Most Common Industries - Finance and insurance, and real estate and rental and leasing (%)
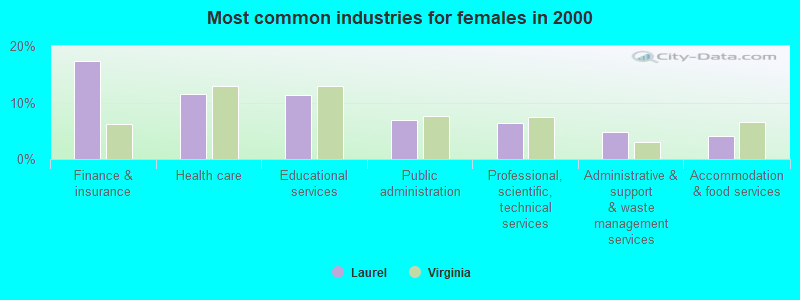
Most Common Industries - Finance and insurance (%)
Most Common Industries - Real estate and rental and leasing (%)
Most Common Industries - Professional, scientific, and management, and administrative and waste management services (%)
Most Common Industries - Professional, scientific, and technical services (%)
Most Common Industries - Management of companies and enterprises (%)
Most Common Industries - Administrative and support and waste management services (%)
Most Common Industries - Educational services, and health care and social assistance (%)
Most Common Industries - Educational services (%)
Most Common Industries - Health care and social assistance (%)
Most Common Industries - Arts, entertainment, and recreation, and accommodation and food services (%)
Most Common Industries - Arts, entertainment, and recreation (%)
Most Common Industries - Accommodation and food services (%)
Most Common Industries - Other services, except public administration (%)
Most Common Industries - Public administration (%)
Occupation diversity
Most Common Occupations - Management, business, science, and arts occupations (%)
Most Common Occupations - Management, business, and financial occupations (%)
Most Common Occupations - Management occupations (%)
Most Common Occupations - Business and financial operations occupations (%)
Most Common Occupations - Computer, engineering, and science occupations (%)
Most Common Occupations - Computer and mathematical occupations (%)
Most Common Occupations - Architecture and engineering occupations (%)
Most Common Occupations - Life, physical, and social science occupations (%)
Most Common Occupations - Education, legal, community service, arts, and media occupations (%)
Most Common Occupations - Community and social service occupations (%)
Most Common Occupations - Legal occupations (%)
Most Common Occupations - Education, training, and library occupations (%)
Most Common Occupations - Arts, design, entertainment, sports, and media occupations (%)
Most Common Occupations - Healthcare practitioners and technical occupations (%)
Most Common Occupations - Health diagnosing and treating practitioners and other technical occupations (%)
Most Common Occupations - Health technologists and technicians (%)
Most Common Occupations - Service occupations (%)
Most Common Occupations - Healthcare support occupations (%)
Most Common Occupations - Protective service occupations (%)
Most Common Occupations - Fire fighting and prevention, and other protective service workers including supervisors (%)
Most Common Occupations - Law enforcement workers including supervisors (%)
Most Common Occupations - Food preparation and serving related occupations (%)
Most Common Occupations - Building and grounds cleaning and maintenance occupations (%)
Most Common Occupations - Personal care and service occupations (%)
Most Common Occupations - Sales and office occupations (%)
Most Common Occupations - Sales and related occupations (%)
Most Common Occupations - Office and administrative support occupations (%)
Most Common Occupations - Natural resources, construction, and maintenance occupations (%)
Most Common Occupations - Farming, fishing, and forestry occupations (%)
Most Common Occupations - Construction and extraction occupations (%)
Most Common Occupations - Installation, maintenance, and repair occupations (%)
Most Common Occupations - Production, transportation, and material moving occupations (%)
Most Common Occupations - Production occupations (%)
Most Common Occupations - Transportation occupations (%)
Most Common Occupations - Material moving occupations (%)
People in Group quarters - Institutionalized population (%)
People in Group quarters - Correctional institutions (%)
People in Group quarters - Federal prisons and detention centers (%)
People in Group quarters - Halfway houses (%)
People in Group quarters - Local jails and other confinement facilities (including police lockups) (%)
People in Group quarters - Military disciplinary barracks (%)
People in Group quarters - State prisons (%)
People in Group quarters - Other types of correctional institutions (%)
People in Group quarters - Nursing homes (%)
People in Group quarters - Hospitals/wards, hospices, and schools for the handicapped (%)
People in Group quarters - Hospitals/wards and hospices for chronically ill (%)
People in Group quarters - Hospices or homes for chronically ill (%)
People in Group quarters - Military hospitals or wards for chronically ill (%)
People in Group quarters - Other hospitals or wards for chronically ill (%)
People in Group quarters - Hospitals or wards for drug/alcohol abuse (%)
People in Group quarters - Mental (Psychiatric) hospitals or wards (%)
People in Group quarters - Schools, hospitals, or wards for the mentally retarded (%)
People in Group quarters - Schools, hospitals, or wards for the physically handicapped (%)
People in Group quarters - Institutions for the deaf (%)
People in Group quarters - Institutions for the blind (%)
People in Group quarters - Orthopedic wards and institutions for the physically handicapped (%)
People in Group quarters - Wards in general hospitals for patients who have no usual home elsewhere (%)
People in Group quarters - Wards in military hospitals for patients who have no usual home elsewhere (%)
People in Group quarters - Juvenile institutions (%)
People in Group quarters - Long-term care (%)
People in Group quarters - Homes for abused, dependent, and neglected children (%)
People in Group quarters - Residential treatment centers for emotionally disturbed children (%)
People in Group quarters - Training schools for juvenile delinquents (%)
People in Group quarters - Short-term care, detention or diagnostic centers for delinquent children (%)
People in Group quarters - Type of juvenile institution unknown (%)
People in Group quarters - Noninstitutionalized population (%)
People in Group quarters - College dormitories (includes college quarters off campus) (%)
People in Group quarters - Military quarters (%)
People in Group quarters - On base (%)
People in Group quarters - Barracks, unaccompanied personnel housing (UPH), (Enlisted/Officer), ;and similar group living quarters for military personnel (%)
People in Group quarters - Transient quarters for temporary residents (%)
People in Group quarters - Military ships (%)
People in Group quarters - Group homes (%)
People in Group quarters - Homes or halfway houses for drug/alcohol abuse (%)
People in Group quarters - Homes for the mentally ill (%)
People in Group quarters - Homes for the mentally retarded (%)
People in Group quarters - Homes for the physically handicapped (%)
People in Group quarters - Other group homes (%)
People in Group quarters - Religious group quarters (%)
People in Group quarters - Dormitories (%)
People in Group quarters - Agriculture workers' dormitories on farms (%)
People in Group quarters - Job Corps and vocational training facilities (%)
People in Group quarters - Other workers' dormitories (%)
People in Group quarters - Crews of maritime vessels (%)
People in Group quarters - Other nonhousehold living situations (%)
People in Group quarters - Other noninstitutional group quarters (%)
Residents speaking English at home (%)
Residents speaking English at home - Born in the United States (%)
Residents speaking English at home - Native, born elsewhere (%)
Residents speaking English at home - Foreign born (%)
Residents speaking Spanish at home (%)
Residents speaking Spanish at home - Born in the United States (%)
Residents speaking Spanish at home - Native, born elsewhere (%)
Residents speaking Spanish at home - Foreign born (%)
Residents speaking other language at home (%)
Residents speaking other language at home - Born in the United States (%)
Residents speaking other language at home - Native, born elsewhere (%)
Residents speaking other language at home - Foreign born (%)
Class of Workers - Employee of private company (%)
Class of Workers - Self-employed in own incorporated business (%)
Class of Workers - Private not-for-profit wage and salary workers (%)
Class of Workers - Local government workers (%)
Class of Workers - State government workers (%)
Class of Workers - Federal government workers (%)
Class of Workers - Self-employed workers in own not incorporated business and Unpaid family workers (%)
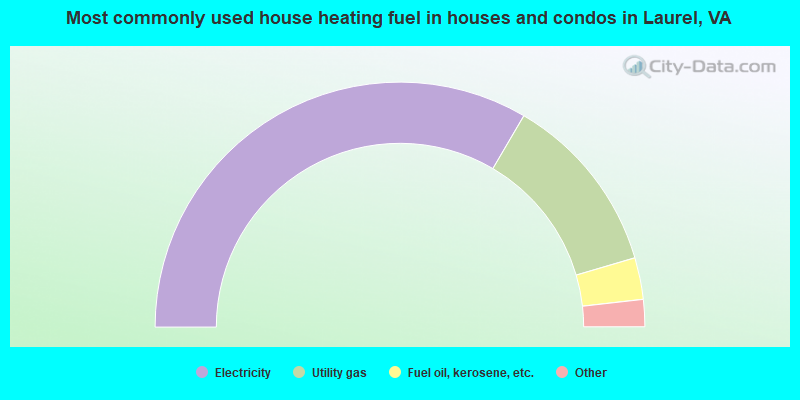
House heating fuel used in houses and condos - Utility gas (%)
House heating fuel used in houses and condos - Bottled, tank, or LP gas (%)
House heating fuel used in houses and condos - Electricity (%)
House heating fuel used in houses and condos - Fuel oil, kerosene, etc. (%)
House heating fuel used in houses and condos - Coal or coke (%)
House heating fuel used in houses and condos - Wood (%)
House heating fuel used in houses and condos - Solar energy (%)
House heating fuel used in houses and condos - Other fuel (%)
House heating fuel used in houses and condos - No fuel used (%)
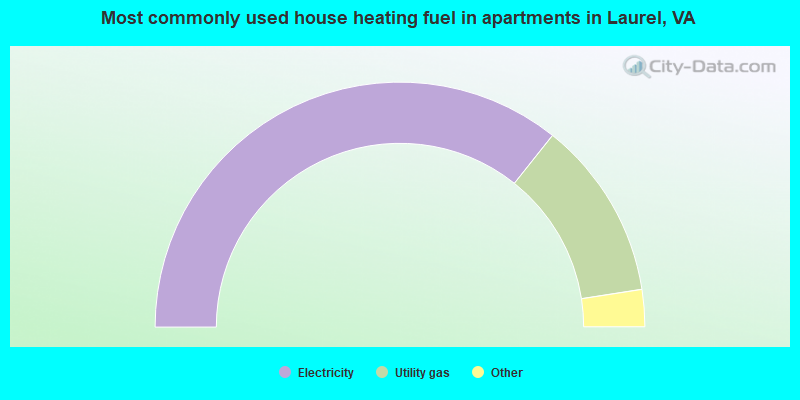
House heating fuel used in apartments - Utility gas (%)
House heating fuel used in apartments - Bottled, tank, or LP gas (%)
House heating fuel used in apartments - Electricity (%)
House heating fuel used in apartments - Fuel oil, kerosene, etc. (%)
House heating fuel used in apartments - Coal or coke (%)
House heating fuel used in apartments - Wood (%)
House heating fuel used in apartments - Solar energy (%)
House heating fuel used in apartments - Other fuel (%)
House heating fuel used in apartments - No fuel used (%)
Armed forces status - In Armed Forces (%)
Armed forces status - Civilian (%)
Armed forces status - Civilian - Veteran (%)
Armed forces status - Civilian - Nonveteran (%)
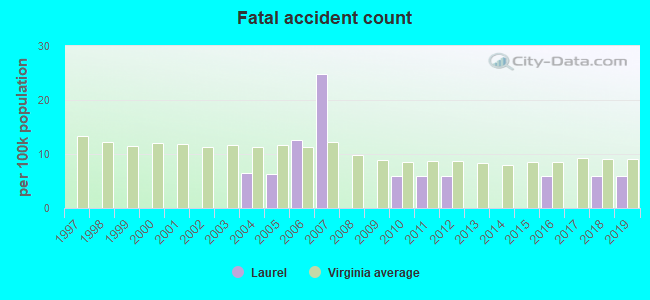
Fatal accidents locations in years 2005-2021
Fatal accidents locations in 2005
Fatal accidents locations in 2006
Fatal accidents locations in 2007
Fatal accidents locations in 2008
Fatal accidents locations in 2009
Fatal accidents locations in 2010
Fatal accidents locations in 2011
Fatal accidents locations in 2012
Fatal accidents locations in 2013
Fatal accidents locations in 2014
Fatal accidents locations in 2015
Fatal accidents locations in 2016
Fatal accidents locations in 2017
Fatal accidents locations in 2018
Fatal accidents locations in 2019
Fatal accidents locations in 2020
Fatal accidents locations in 2021
Alcohol use - People drinking some alcohol every month (%)
Alcohol use - People not drinking at all (%)
Alcohol use - Average days/month drinking alcohol
Alcohol use - Average drinks/week
Alcohol use - Average days/year people drink much
Audiometry - Average condition of hearing (%)
Audiometry - People that can hear a whisper from across a quiet room (%)
Audiometry - People that can hear normal voice from across a quiet room (%)
Audiometry - Ears ringing, roaring, buzzing (%)
Audiometry - Had a job exposure to loud noise (%)
Audiometry - Had off-work exposure to loud noise (%)
Blood Pressure & Cholesterol - Has high blood pressure (%)
Blood Pressure & Cholesterol - Checking blood pressure at home (%)
Blood Pressure & Cholesterol - Frequently checking blood cholesterol (%)
Blood Pressure & Cholesterol - Has high cholesterol level (%)
Consumer Behavior - Money monthly spent on food at supermarket/grocery store
Consumer Behavior - Money monthly spent on food at other stores
Consumer Behavior - Money monthly spent on eating out
Consumer Behavior - Money monthly spent on carryout/delivered foods
Consumer Behavior - Income spent on food at supermarket/grocery store (%)
Consumer Behavior - Income spent on food at other stores (%)
Consumer Behavior - Income spent on eating out (%)
Consumer Behavior - Income spent on carryout/delivered foods (%)
Current Health Status - General health condition (%)
Current Health Status - Blood donors (%)
Current Health Status - Has blood ever tested for HIV virus (%)
Current Health Status - Left-handed people (%)
Dermatology - People using sunscreen (%)
Diabetes - Diabetics (%)
Diabetes - Had a blood test for high blood sugar (%)
Diabetes - People taking insulin (%)
Diet Behavior & Nutrition - Diet health (%)
Diet Behavior & Nutrition - Milk product consumption (# of products/month)
Diet Behavior & Nutrition - Meals not home prepared (#/week)
Diet Behavior & Nutrition - Meals from fast food or pizza place (#/week)
Diet Behavior & Nutrition - Ready-to-eat foods (#/month)
Diet Behavior & Nutrition - Frozen meals/pizza (#/month)
Drug Use - People that ever used marijuana or hashish (%)
Drug Use - Ever used hard drugs (%)
Drug Use - Ever used any form of cocaine (%)
Drug Use - Ever used heroin (%)
Drug Use - Ever used methamphetamine (%)
Health Insurance - People covered by health insurance (%)
Kidney Conditions-Urology - Avg. # of times urinating at night
Medical Conditions - People with asthma (%)
Medical Conditions - People with anemia (%)
Medical Conditions - People with psoriasis (%)
Medical Conditions - People with overweight (%)
Medical Conditions - Elderly people having difficulties in thinking or remembering (%)
Medical Conditions - People who ever received blood transfusion (%)
Medical Conditions - People having trouble seeing even with glass/contacts (%)
Medical Conditions - People with arthritis (%)
Medical Conditions - People with gout (%)
Medical Conditions - People with congestive heart failure (%)
Medical Conditions - People with coronary heart disease (%)
Medical Conditions - People with angina pectoris (%)
Medical Conditions - People who ever had heart attack (%)
Medical Conditions - People who ever had stroke (%)
Medical Conditions - People with emphysema (%)
Medical Conditions - People with thyroid problem (%)
Medical Conditions - People with chronic bronchitis (%)
Medical Conditions - People with any liver condition (%)
Medical Conditions - People who ever had cancer or malignancy (%)
Mental Health - People who have little interest in doing things (%)
Mental Health - People feeling down, depressed, or hopeless (%)
Mental Health - People who have trouble sleeping or sleeping too much (%)
Mental Health - People feeling tired or having little energy (%)
Mental Health - People with poor appetite or overeating (%)
Mental Health - People feeling bad about themself (%)
Mental Health - People who have trouble concentrating on things (%)
Mental Health - People moving or speaking slowly or too fast (%)
Mental Health - People having thoughts they would be better off dead (%)
Oral Health - Average years since last visit a dentist
Oral Health - People embarrassed because of mouth (%)
Oral Health - People with gum disease (%)
Oral Health - General health of teeth and gums (%)
Oral Health - Average days a week using dental floss/device
Oral Health - Average days a week using mouthwash for dental problem
Oral Health - Average number of teeth
Pesticide Use - Households using pesticides to control insects (%)
Pesticide Use - Households using pesticides to kill weeds (%)
Physical Activity - People doing vigorous-intensity work activities (%)
Physical Activity - People doing moderate-intensity work activities (%)
Physical Activity - People walking or bicycling (%)
Physical Activity - People doing vigorous-intensity recreational activities (%)
Physical Activity - People doing moderate-intensity recreational activities (%)
Physical Activity - Average hours a day doing sedentary activities
Physical Activity - Average hours a day watching TV or videos
Physical Activity - Average hours a day using computer
Physical Functioning - People having limitations keeping them from working (%)
Physical Functioning - People limited in amount of work they can do (%)
Physical Functioning - People that need special equipment to walk (%)
Physical Functioning - People experiencing confusion/memory problems (%)
Physical Functioning - People requiring special healthcare equipment (%)
Prescription Medications - Average number of prescription medicines taking
Preventive Aspirin Use - Adults 40+ taking low-dose aspirin (%)
Reproductive Health - Vaginal deliveries (%)
Reproductive Health - Cesarean deliveries (%)
Reproductive Health - Deliveries resulted in a live birth (%)
Reproductive Health - Pregnancies resulted in a delivery (%)
Reproductive Health - Women breastfeeding newborns (%)
Reproductive Health - Women that had a hysterectomy (%)
Reproductive Health - Women that had both ovaries removed (%)
Reproductive Health - Women that have ever taken birth control pills (%)
Reproductive Health - Women taking birth control pills (%)
Reproductive Health - Women that have ever used Depo-Provera or injectables (%)
Reproductive Health - Women that have ever used female hormones (%)
Sexual Behavior - People 18+ that ever had sex (vaginal, anal, or oral) (%)
Sexual Behavior - Males 18+ that ever had vaginal sex with a woman (%)
Sexual Behavior - Males 18+ that ever performed oral sex on a woman (%)
Sexual Behavior - Males 18+ that ever had anal sex with a woman (%)
Sexual Behavior - Males 18+ that ever had any sex with a man (%)
Sexual Behavior - Females 18+ that ever had vaginal sex with a man (%)
Sexual Behavior - Females 18+ that ever performed oral sex on a man (%)
Sexual Behavior - Females 18+ that ever had anal sex with a man (%)
Sexual Behavior - Females 18+ that ever had any kind of sex with a woman (%)
Sexual Behavior - Average age people first had sex
Sexual Behavior - Average number of female sex partners in lifetime (males 18+)
Sexual Behavior - Average number of female vaginal sex partners in lifetime (males 18+)
Sexual Behavior - Average age people first performed oral sex on a woman (18+)
Sexual Behavior - Average number of woman performed oral sex on in lifetime (18+)
Sexual Behavior - Average number of male sex partners in lifetime (males 18+)
Sexual Behavior - Average number of male anal sex partners in lifetime (males 18+)
Sexual Behavior - Average age people first performed oral sex on a man (18+)
Sexual Behavior - Average number of male oral sex partners in lifetime (18+)
Sexual Behavior - People using protection when performing oral sex (%)
Sexual Behavior - Average number of times people have vaginal or anal sex a year
Sexual Behavior - People having sex without condom (%)
Sexual Behavior - Average number of male sex partners in lifetime (females 18+)
Sexual Behavior - Average number of male vaginal sex partners in lifetime (females 18+)
Sexual Behavior - Average number of female sex partners in lifetime (females 18+)
Sexual Behavior - Circumcised males 18+ (%)
Sleep Disorders - Average hours sleeping at night
Sleep Disorders - People that has trouble sleeping (%)
Smoking-Cigarette Use - People smoking cigarettes (%)
Taste & Smell - People 40+ having problems with smell (%)
Taste & Smell - People 40+ having problems with taste (%)
Taste & Smell - People 40+ that ever had wisdom teeth removed (%)
Taste & Smell - People 40+ that ever had tonsils teeth removed (%)
Taste & Smell - People 40+ that ever had a loss of consciousness because of a head injury (%)
Taste & Smell - People 40+ that ever had a broken nose or other serious injury to face or skull (%)
Taste & Smell - People 40+ that ever had two or more sinus infections (%)
Weight - Average height (inches)
Weight - Average weight (pounds)
Weight - Average BMI
Weight - People that are obese (%)
Weight - People that ever were obese (%)
Weight - People trying to lose weight (%)
According to our research of Virginia and other state lists, there was 1 registered sex offender living in Laurel, Virginia as of June 10, 2024 . The ratio of all residents to sex offenders in Laurel is 16,994 to 1.The ratio of registered sex offenders to all residents in this city is much lower than the state average.
Latest news from Laurel, VA collected exclusively by city-data.com from local newspapers, TV, and radio stations
Ancestries: American (7.3%), English (5.2%), German (2.8%), Irish (2.4%), African (2.2%), European (1.8%).
Current Local Time:
Land area: 5.48 square miles.
Population density: 3,049 people per square mile (average).
3,496 residents are foreign born (8.6% Asia , 6.7% Latin America , 1.9% Africa ).
This place:
18.9%Virginia:
12.6%
Median real estate property taxes paid for housing units with mortgages in 2022: $1,774 (0.6%)Median real estate property taxes paid for housing units with no mortgage in 2022: $1,899 (0.6%)
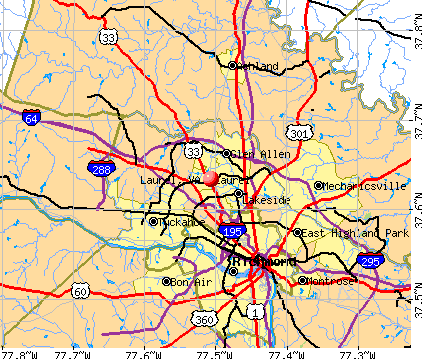
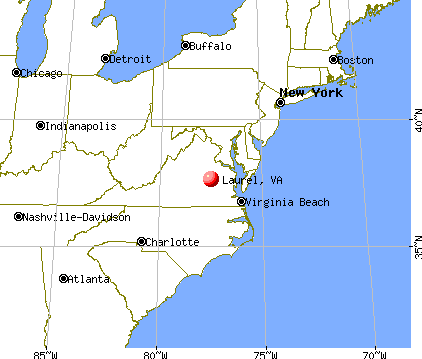
Nearest city with pop. 50,000+: Richmond, VA
Nearest city with pop. 200,000+: Norfolk, VA
Nearest city with pop. 1,000,000+: Philadelphia, PA
Nearest cities:
Short Pump, VA (2.6 miles),
Latitude: 37.63 N, Longitude: 77.51 W
Daytime population change due to commuting: -21 (-0.1%)Workers who live and work in this place: 2,228 (20.9%)
Area code commonly used in this area: 804
Unemployment in December 2023:
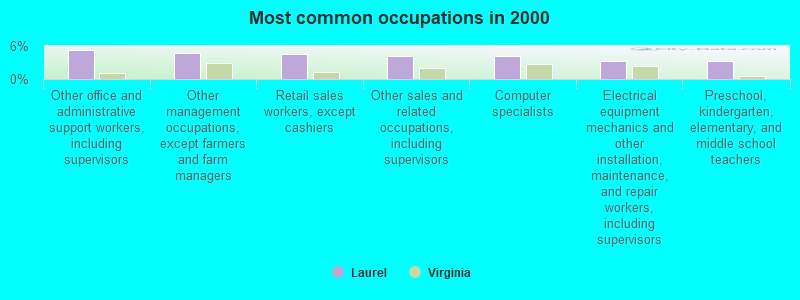
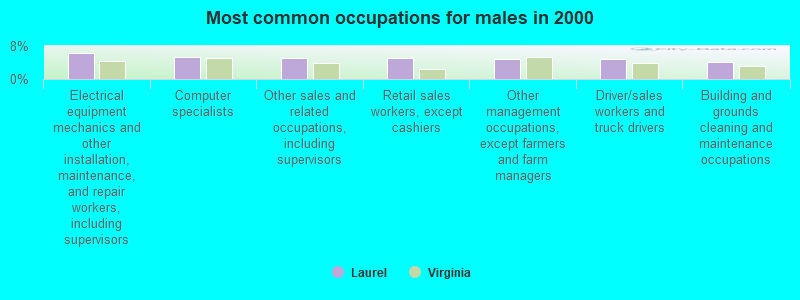
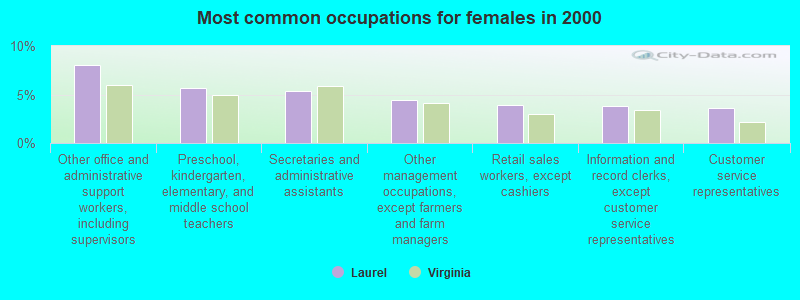
Most common occupations in Laurel, VA (%)
Both Males Females
Other office and administrative support workers, including supervisors (5.3%)
Other management occupations, except farmers and farm managers (4.7%)
Retail sales workers, except cashiers (4.6%)
Other sales and related occupations, including supervisors (4.2%)
Computer specialists (4.1%)
Electrical equipment mechanics and other installation, maintenance, and repair workers, including supervisors (3.4%)
Preschool, kindergarten, elementary, and middle school teachers (3.2%)
Electrical equipment mechanics and other installation, maintenance, and repair workers, including supervisors (6.4%)
Computer specialists (5.2%)
Other sales and related occupations, including supervisors (5.2%)
Retail sales workers, except cashiers (5.2%)
Other management occupations, except farmers and farm managers (4.9%)
Driver/sales workers and truck drivers (4.9%)
Building and grounds cleaning and maintenance occupations (4.1%)
Other office and administrative support workers, including supervisors (8.0%)
Preschool, kindergarten, elementary, and middle school teachers (5.6%)
Secretaries and administrative assistants (5.4%)
Other management occupations, except farmers and farm managers (4.4%)
Retail sales workers, except cashiers (4.0%)
Information and record clerks, except customer service representatives (3.8%)
Customer service representatives (3.6%)
Tornado activity:
Laurel-area historical tornado activity is slightly above Virginia state average. It is 9% smaller than the overall U.S. average.
On 8/6/1993, a category F4 (max. wind speeds 207-260 mph) tornado 25.3 miles away from the Laurel place center killed 4 people and injured 246 people and caused between $5,000,000 and $50,000,000 in damages.
On 4/1/1998, a category F3 (max. wind speeds 158-206 mph) tornado 17.1 miles away from the place center killed 2 people and caused $800,000 in damages.
Earthquake activity:
Laurel-area historical earthquake activity is significantly above Virginia state average. It is 53% smaller than the overall U.S. average. On 8/23/2011 at 17:51:04, a magnitude 5.8 (5.8 MW, Depth: 3.7 mi, Class: Moderate, Intensity: VI - VII) earthquake occurred 30.3 miles away from Laurel center On 12/9/2003 at 20:59:14, a magnitude 4.5 (4.5 MB, 4.5 LG, Class: Light, Intensity: IV - V) earthquake occurred 22.0 miles away from Laurel center On 8/25/2011 at 05:07:52, a magnitude 4.5 (4.5 ML, Depth: 4.2 mi) earthquake occurred 33.2 miles away from Laurel center On 12/9/2003 at 20:59:18, a magnitude 4.5 (4.5 ML, Depth: 6.2 mi) earthquake occurred 33.9 miles away from the city center On 8/9/2020 at 12:07:37, a magnitude 5.1 (5.1 MW, Depth: 4.7 mi) earthquake occurred 213.6 miles away from Laurel center On 8/24/2011 at 00:04:36, a magnitude 4.2 (4.2 ML) earthquake occurred 31.2 miles away from Laurel center Magnitude types: regional Lg-wave magnitude (LG), body-wave magnitude (MB), local magnitude (ML), moment magnitude (MW) Natural disasters: The number of natural disasters in Henrico County (18) is near the US average (15).Major Disasters (Presidential) Declared: 13Emergencies Declared: 5Hurricanes: 7, Floods: 4, Storms: 4, Winter Storms: 3, Blizzard: 1, Drought: 1, Ice Storm: 1, Snowstorm: 1, Tornado: 1, Tropical Depression: 1, Tropical Storm: 1, Other: 1 (Note: some incidents may be assigned to more than one category). Hospitals and medical centers near Laurel: PARHAM HEALTH CARE AND REHAB CEN (Nursing Home, about 1 miles away; RICHMOND, VA)
HENRICO DOCTORS HOSPITAL PARHAM (Hospital, about 2 miles away; RICHMOND, VA)
GENTIVA HEALTH SERVICES - RICHMOND (Home Health Center, about 2 miles away; RICHMOND, VA)
MANORCARE HEALTH SERVICES-STRATFORD HALL (Nursing Home, about 3 miles away; RICHMOND, VA)
WESTPORT HEALTH CENTER (Nursing Home, about 3 miles away; RICHMOND, VA)
ODYSSEY HEALTHCARE OF RICHMOND (Hospital, about 3 miles away; RICHMOND, VA)
HOSPICE OF VIRGINIA (Hospital, about 3 miles away; RICHMOND, VA)
Amtrak stations near Laurel: 2 miles: RICHMOND (7519 STAPLES MILL RD.) Services: ticket office, partially wheelchair accessible, enclosed waiting area, public restrooms, public payphones, snack bar and vending machines, ATM, paid short-term parking, paid long-term parking, call for car rental service, taxi stand, public transit connection.
9 miles: RICHMOND, MAIN STREET (RICHMOND, 1500 MAIN STREET) Services: enclosed waiting area, public restrooms.
9 miles: ASHLAND (112 RAILROAD AVE.) Services: partially wheelchair accessible, enclosed waiting area, free short-term parking, free long-term parking, call for car rental service, call for taxi service.
Colleges/universities with over 2000 students nearest to Laurel:
J Sargeant Reynolds Community College (about 2 miles; Richmond, VA ; Full-time enrollment: 8,271)
University of Richmond (about 5 miles; University of Richmond, VA ; FT enrollment: 3,745)
Virginia Union University (about 6 miles; Richmond, VA ; FT enrollment: 2,028)
Virginia Commonwealth University (about 7 miles; Richmond, VA ; FT enrollment: 26,647)
John Tyler Community College (about 21 miles; Chester, VA ; FT enrollment: 5,864)
Virginia State University (about 28 miles; Petersburg, VA ; FT enrollment: 5,815)
University of Mary Washington (about 47 miles; Fredericksburg, VA ; FT enrollment: 4,506)
Notable locations in Laurel: (A) , Hermitage Industrial Center (B) , Henrico County Division of Fire Administration (C) , Henrico County Juvenile Center (D) , Henrico County Jail (E) , Henrico County Courthouse (F) , Henrico County Administration Building (G) , Henrico County Sheriff's Office (H) , Richmond Public Library Municipal Government and Law Branch Library (I) . Display/hide their locations on the map
Shopping Centers: (1) , Staples Mill Plaza Shopping Center (2) , Fountain Square Shopping Center (3) . Display/hide their locations on the map
Churches in Laurel include: (A) , Goodwill Church (B) , Laurel Park Church (C) , Mount Vernon Church (D) , North Run Church (E) , Our Lady of Lourdes Church (F) . Display/hide their locations on the map
Cemetery: (1) . Display/hide its location on the map
Reservoir: (A) . Display/hide its location on the map
Streams, rivers, and creeks: (A) . Display/hide its location on the map
Henrico County has a predicted average indoor radon screening level less than 2 pCi/L (pico curies per liter) - Low Potential Average household size: This place:
2.3 peopleVirginia:
2.5 people
Percentage of family households: This place:
56.3%Whole state:
67.0%
Percentage of households with unmarried partners: This place:
7.2%Whole state:
5.7%
Likely homosexual households (counted as self-reported same-sex unmarried-partner households)
Lesbian couples: 0.5% of all households Gay men: 0.2% of all households
People in group quarters in Laurel in 2010:
679 people in local jails and other municipal confinement facilities
160 people in nursing facilities/skilled-nursing facilities
24 people in correctional facilities intended for juveniles
7 people in group homes intended for adults
People in group quarters in Laurel in 2000:
537 people in local jails and other confinement facilities (including police lockups)
168 people in nursing homes
48 people in unknown juvenile institutions
11 people in homes for the mentally retarded
For population 15 years and over in Laurel:
Never married: 41.9%Now married: 39.0%Separated: 1.7%Widowed: 5.1%Divorced: 12.3% For population 25 years and over in Laurel:
High school or higher: 90.1%Bachelor's degree or higher: 29.7%Graduate or professional degree: 10.9%Unemployed: 3.2%Mean travel time to work (commute): 17.6 minutes
Education Gini index (Inequality in education) Here:
12.5Virginia average:
12.1
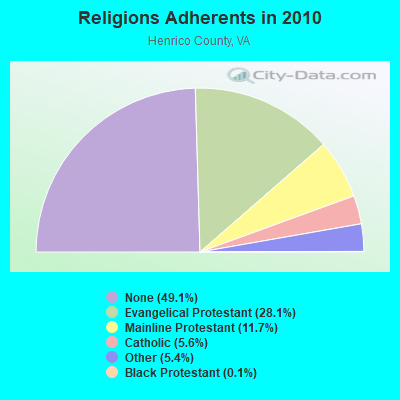
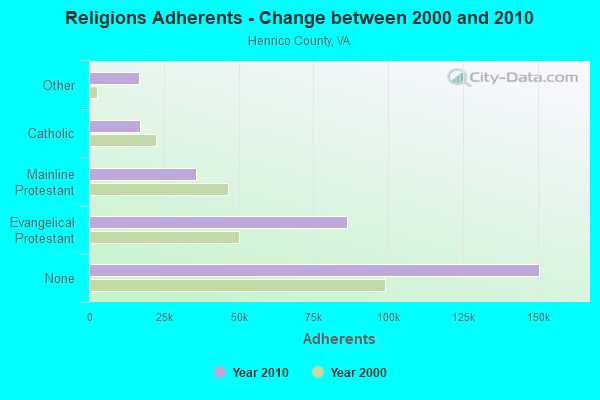
Religion statistics for Laurel, VA (based on Henrico County data)
Religion Adherents Congregations Evangelical Protestant 86,344 139 Mainline Protestant 35,802 56 Catholic 17,097 6 Other 16,624 17 Black Protestant 370 9 Orthodox 135 2 None 150,563 -
Source: Clifford Grammich, Kirk Hadaway, Richard Houseal, Dale E.Jones, Alexei Krindatch, Richie Stanley and Richard H.Taylor. 2012. 2010 U.S.Religion Census: Religious Congregations & Membership Study. Association of Statisticians of American Religious Bodies. Jones, Dale E., et al. 2002. Congregations and Membership in the United States 2000. Nashville, TN: Glenmary Research Center. Graphs represent county-level data
Food Environment Statistics: Number of grocery stores : 71Henrico County :
2.45 / 10,000 pop.Virginia :
2.03 / 10,000 pop.
Number of supercenters and club stores : 4Here :
0.14 / 10,000 pop.Virginia :
0.17 / 10,000 pop.
Number of convenience stores (no gas) : 42Henrico County :
1.45 / 10,000 pop.State :
1.43 / 10,000 pop.
Number of convenience stores (with gas) : 100Henrico County :
3.45 / 10,000 pop.Virginia :
4.03 / 10,000 pop.
Number of full-service restaurants : 226Henrico County :
7.81 / 10,000 pop.Virginia :
7.65 / 10,000 pop.
Low-income preschool obesity rate : Henrico County :
15.2%Virginia :
18.6%
Health and Nutrition: Healthy diet rate : This city:
50.5%Virginia:
50.6%
Average overall health of teeth and gums : Laurel:
48.4%Virginia:
48.6%
Average BMI : This city:
28.5Virginia:
28.6
People feeling badly about themselves : Laurel:
18.8%Virginia:
20.2%
People not drinking alcohol at all : Laurel:
11.3%Virginia:
10.5%
Average hours sleeping at night : Overweight people : Laurel:
32.0%Virginia:
33.5%
General health condition : This city:
57.9%Virginia:
57.4%
Average condition of hearing : Laurel:
81.5%Virginia:
80.5%
More about Health and Nutrition of Laurel, VA Residents
9.10% of this county's 2020 resident taxpayers moved to other counties in 2021 ($73,526 average adjusted gross income )
Here:
9.10%Virginia average:
10.20%
0.02% of residents moved to foreign countries ($111 average AGI )Henrico County:
0.02%Virginia average:
0.09%
Top counties to which taxpayers relocated from this county between 2020 and 2021: Strongest AM radio stations in Laurel:
WRNL (910 AM; 5 kW; RICHMOND, VA; Owner: CLEAR CHANNEL BROADCASTING LICENSES, INC.)
WBTK (1380 AM; 5 kW; RICHMOND, VA; Owner: SCA LICENSE CORPORATION)
WREJ (1540 AM; 10 kW; RICHMOND, VA)
WRVA (1140 AM; 50 kW; RICHMOND, VA; Owner: CLEAR CHANNEL BROADCASTING LICENSES, INC.)
WXGI (950 AM; 4 kW; RICHMOND, VA; Owner: GEE COMMUNICATIONS, INC.)
WGGM (820 AM; 10 kW; CHESTER, VA; Owner: HOFFMAN COMMUNICATIONS, INC.)
WLEE (1320 AM; 5 kW; RICHMOND, VA; Owner: 4M OF RICHMOND, INC)
WFTH (1590 AM; 5 kW; RICHMOND, VA; Owner: TRI-CITY CHRISTIAN RADIO, INC.)
WDZY (1290 AM; 25 kW; COLONIAL HEIGHTS, VA; Owner: ABC, INC.)
WVNZ (1320 AM; 5 kW; RICHMOND, VA)
WTAR (850 AM; 50 kW; NORFOLK, VA; Owner: SINCLAIR COMMUNICATIONS)
WRJR (670 AM; 20 kW; CLAREMONT, VA; Owner: CHESAPEAKE-PORTSMOUTH BROADCASTING CORPORATION)
WHAN (1430 AM; 1 kW; ASHLAND, VA; Owner: FIFTH ESTATE COMMUNICATIONS, LLC)
Strongest FM radio stations in Laurel:
WCDX (92.1 FM; MECHANICSVILLE, VA; Owner: RADIO ONE LICENSES, LLC)
WCVE-FM (88.9 FM; RICHMOND, VA; Owner: COMMONWEALTH PUBLIC BROADCASTING CORPORATION)
WMXB (103.7 FM; RICHMOND, VA; Owner: COX RADIO, INC.)
WRXL (102.1 FM; RICHMOND, VA; Owner: CLEAR CHANNEL BROADCASTING LICENSES, INC.)
WBTJ (106.5 FM; RICHMOND, VA; Owner: CAPSTAR TX LIMITED PARTNERSHIP)
WJMO-FM (105.7 FM; RICHMOND, VA; Owner: RADIO ONE LICENSES, LLC)
WYFJ (100.1 FM; ASHLAND, VA; Owner: BIBLE BROADCASTING NETWORK, INC.)
W219CX (91.7 FM; LAKESIDE/RICHMOND, VA; Owner: CALVARY CHAPEL OF TWIN FALLS, INC.)
WBBT-FM (107.3 FM; POWHATAN, VA; Owner: MAINQUAD, INC.)
WDCE (90.1 FM; RICHMOND, VA; Owner: UNIVERSITY OF RICHMOND)
WDYL (101.1 FM; CHESTER, VA; Owner: CXR HOLDINGS, INC.)
WKJS (104.7 FM; CREWE, VA; Owner: RADIO ONE LICENSES, LLC)
WKHK (95.3 FM; COLONIAL HEIGHTS, VA; Owner: COX RADIO, INC.)
WRVQ (94.5 FM; RICHMOND, VA; Owner: CLEAR CHANNEL BROADCASTING LICENSES, INC.)
WWUZ (96.9 FM; BOWLING GREEN, VA; Owner: THE FREE LANCE-STAR PUBLISHING CO. OF FREDERICKSBURG, VA)
WAUQ (89.7 FM; CHARLES CITY, VA; Owner: AMERICAN FAMILY ASSOCIATION)
WJZV (93.1 FM; ETTRICK, VA; Owner: RICHMOND BROADCASTING, INC)
WZEZ (100.5 FM; GOOCHLAND, VA; Owner: HUBERT N. HOFFMAN JR. FAMILY TRUST)
WTVR-FM (98.1 FM; RICHMOND, VA; Owner: CLEAR CHANNEL BROADCASTING LICENSES, INC.)
W298AG (107.5 FM; RICHMOND, VA; Owner: CSN INTERNATIONAL)
TV broadcast stations around Laurel:
WXOB-LP (Channel 17; RICHMOND, VA; Owner: KM BROADCASTING, INC.)
W48BI (Channel 48; RICHMOND, VA; Owner: WORD OF GOD FELLOWSHIP, INC.)
WCVE-TV (Channel 23; RICHMOND, VA; Owner: COMMONWEALTH PUBLIC BROADCASTING CORPORATION)
WRLH-TV (Channel 35; RICHMOND, VA; Owner: WRLH LICENSEE, LLC)
WTVR-TV (Channel 6; RICHMOND, VA; Owner: ELCOM OF VIRGINIA, INC.)
WCVW (Channel 57; RICHMOND, VA; Owner: COMMONWEALTH PUBLIC BROADCASTING CORPORATION)
WRIC-TV (Channel 8; PETERSBURG, VA; Owner: YOUNG BROADCASTING OF RICHMOND, INC.)
WWBT (Channel 12; RICHMOND, VA; Owner: JEFFERSON-PILOT COMMUNICATIONS COMPANY OF VIRGINIA)
W39CO (Channel 39; RICHMOND, VA; Owner: NATIONAL MINORITY T.V., INC.)
WUPV (Channel 65; ASHLAND, VA; Owner: BELL BROADCASTING, L.L.C.)
WKYV-LP (Channel 61; KEYSVILLE, VA; Owner: TIGER EYE BROADCASTING CORPORATION)
WFMA-LP (Channel 52; FARMVILLE, VA; Owner: TIGER EYE BROADCASTING CORPORATION)
WWAY (Channel 3; WILMINGTON, NC; Owner: LIBCO, INC.)
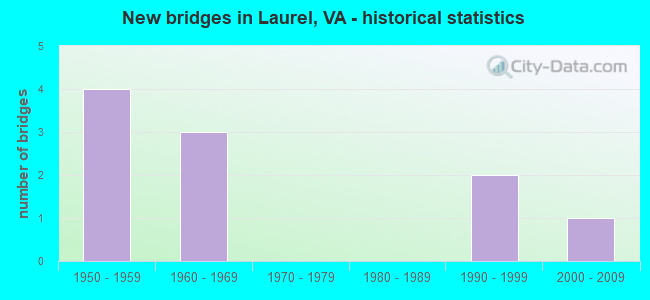
National Bridge Inventory (NBI) Statistics 10 Number of bridges59ft / 18.2m Total length $435,000 Total costs139,492 Total average daily traffic2,806 Total average daily truck traffic177,717 Total future (year 2025) average daily traffic
New bridges - historical statistics
4 1950-1959 3 1960-1969 2 1990-1999 1 2000-2009
See full National Bridge Inventory statistics for Laurel, VA
FCC Registered Antenna Towers: 3
Mehran Nazari, Approx. 850 Feet Se Of Jct E. Parham & Shrader Roads (Lat: 37.629306 Lon: -77.527917), Type: 66.1, Structure height: 51087 m, Overall height: 57.9 m, Registrant: County Of Henrico, Pro@co.Henrico.Va.Us, , Richm-ond, Phone: (804) 672-4957 Mehran Nazari, Approx. 850 Feet Se Of Jct E. Parham & Shrader Roads (Lat: 37.629306 Lon: -77.527917), Type: 66.1, Structure height: 51087 m, Overall height: 57.9 m, Registrant: County Of Henrico, Pro@co.Henrico.Va.Us, , Richm-ond, Phone: (804) 672-4957 Mehran Nazari, Approx. 850 Feet Se Of Jct E. Parham & Shrader Roads (Lat: 37.629306 Lon: -77.527917), Type: 66.1, Structure height: 51087 m, Overall height: 57.9 m, Registrant: County Of Henrico, Pro@co.Henrico.Va.Us, , Richm-ond, Phone: (804) 672-4957 FCC Registered Broadcast Land Mobile Towers: 1
Signal Mp6.9a 7.0 A Rf&p Rr (Lat: 37.648750 Lon: -77.507472), Type: Pole, Structure height: 11 m, Call Sign: WPGX834, Assigned Frequencies: 160.425 MHz, 161.325 MHz, Grant Date: 03/21/2015, Expiration Date: 04/24/2025, Registrant: Csx Transportation, 6735 Southpoint Dr. S, 4th Flr J958, Jacksonville, FL 32216, Phone: (904) 332-5925, Fax: (904) 332-6013, Email:
FCC Registered Microwave Towers: 1
HENRICO EOC, Approx. 850 Feet Se Of Jct E. Parham & Shrader Roads (Lat: 37.629167 Lon: -77.527778), Type: Ltower, Structure height: 57.9 m, Overall height: 66.1 m, Call Sign: WQMJ448, Licensee ID: L00361994, Assigned Frequencies: 11385.0 MHz, 6286.19 MHz, 6212.06 MHz, 6389.96 MHz, 6345.49 MHz, 6315.84 MHz, 10955.0 MHz, 6197.24 MHz, 6375.14 MHz, Grant Date: 09/08/2020, Expiration Date: 08/23/2030, Certifier: Todd J Pugh, Registrant: County Of Henrico, Police Division, 7721 E. Parham Rd, Henrico, VA 23273-0775, Phone: (804) 501-7153, Fax: (804) 501-7188, Email:
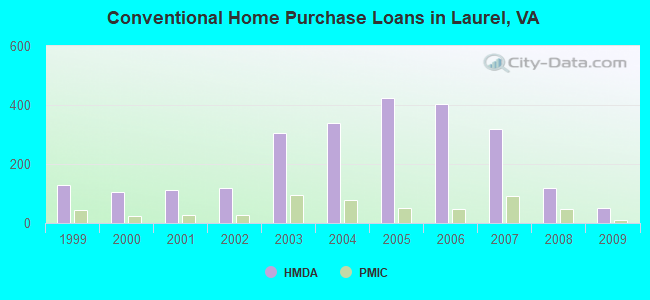
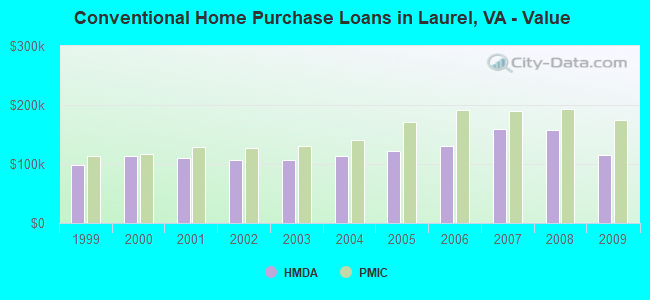
Home Mortgage Disclosure Act Aggregated Statistics For Year 2009(Based on 3 full and 3 partial tracts) A) FHA, FSA/RHS & VA B) Conventional C) Refinancings D) Home Improvement Loans F) Non-occupant Loans on Number Average Value Number Average Value Number Average Value Number Average Value Number Average Value
LOANS ORIGINATED 134 $165,201 50 $115,867 297 $159,009 11 $90,934 15 $112,261 APPLICATIONS APPROVED, NOT ACCEPTED 3 $122,030 2 $137,840 21 $175,951 3 $31,723 1 $107,650 APPLICATIONS DENIED 7 $202,451 7 $150,650 123 $171,220 10 $33,984 8 $111,880 APPLICATIONS WITHDRAWN 14 $153,265 5 $166,490 96 $170,438 4 $105,150 8 $140,525 FILES CLOSED FOR INCOMPLETENESS 1 $134,340 3 $249,273 32 $163,377 3 $139,183 1 $284,010
Aggregated Statistics For Year 2008(Based on 3 full and 3 partial tracts) A) FHA, FSA/RHS & VA B) Conventional C) Refinancings D) Home Improvement Loans E) Loans on Dwellings For 5+ Families F) Non-occupant Loans on G) Loans On Manufactured Number Average Value Number Average Value Number Average Value Number Average Value Number Average Value Number Average Value Number Average Value
LOANS ORIGINATED 109 $188,707 117 $157,505 204 $155,627 27 $59,930 1 $6,507,670 20 $139,452 0 $0 APPLICATIONS APPROVED, NOT ACCEPTED 4 $169,470 7 $151,234 31 $136,825 4 $36,502 0 $0 4 $104,300 0 $0 APPLICATIONS DENIED 13 $166,220 23 $158,738 178 $172,496 27 $77,766 0 $0 12 $114,532 4 $77,500 APPLICATIONS WITHDRAWN 13 $221,071 7 $134,743 71 $165,593 4 $120,482 0 $0 5 $154,726 0 $0 FILES CLOSED FOR INCOMPLETENESS 4 $157,558 4 $159,528 16 $182,780 2 $114,285 0 $0 2 $135,720 0 $0
Aggregated Statistics For Year 2007(Based on 3 full and 3 partial tracts) A) FHA, FSA/RHS & VA B) Conventional C) Refinancings D) Home Improvement Loans E) Loans on Dwellings For 5+ Families F) Non-occupant Loans on G) Loans On Manufactured Number Average Value Number Average Value Number Average Value Number Average Value Number Average Value Number Average Value Number Average Value
LOANS ORIGINATED 25 $186,500 320 $159,123 256 $144,771 46 $61,952 0 $0 47 $139,433 1 $79,680 APPLICATIONS APPROVED, NOT ACCEPTED 0 $0 18 $138,224 61 $143,760 12 $47,758 1 $165,950 8 $93,151 0 $0 APPLICATIONS DENIED 6 $191,527 39 $146,878 205 $146,163 55 $57,934 0 $0 9 $116,693 2 $143,400 APPLICATIONS WITHDRAWN 2 $257,905 36 $156,634 102 $146,952 18 $90,857 0 $0 4 $122,868 0 $0 FILES CLOSED FOR INCOMPLETENESS 0 $0 7 $144,230 27 $167,139 3 $46,730 0 $0 2 $156,485 0 $0
Aggregated Statistics For Year 2006(Based on 3 full and 3 partial tracts) A) FHA, FSA/RHS & VA B) Conventional C) Refinancings D) Home Improvement Loans F) Non-occupant Loans on G) Loans On Manufactured Number Average Value Number Average Value Number Average Value Number Average Value Number Average Value Number Average Value
LOANS ORIGINATED 34 $167,886 404 $130,067 377 $128,137 57 $66,835 81 $117,282 2 $85,740 APPLICATIONS APPROVED, NOT ACCEPTED 0 $0 41 $132,746 56 $127,039 9 $33,460 5 $103,094 4 $118,522 APPLICATIONS DENIED 6 $175,993 68 $126,642 188 $136,025 39 $58,135 19 $116,442 3 $129,330 APPLICATIONS WITHDRAWN 4 $180,562 37 $144,967 159 $146,620 17 $98,604 10 $105,065 0 $0 FILES CLOSED FOR INCOMPLETENESS 0 $0 10 $153,627 30 $153,240 3 $114,277 2 $103,185 0 $0
Aggregated Statistics For Year 2005(Based on 3 full and 3 partial tracts) A) FHA, FSA/RHS & VA B) Conventional C) Refinancings D) Home Improvement Loans E) Loans on Dwellings For 5+ Families F) Non-occupant Loans on G) Loans On Manufactured Number Average Value Number Average Value Number Average Value Number Average Value Number Average Value Number Average Value Number Average Value
LOANS ORIGINATED 38 $148,105 425 $122,539 437 $120,254 52 $61,260 1 $100,000 81 $107,357 0 $0 APPLICATIONS APPROVED, NOT ACCEPTED 0 $0 42 $134,034 86 $123,346 20 $59,995 0 $0 11 $134,718 4 $74,692 APPLICATIONS DENIED 3 $157,753 47 $112,860 194 $128,986 49 $42,014 0 $0 19 $94,870 3 $58,053 APPLICATIONS WITHDRAWN 9 $161,119 49 $126,123 158 $134,654 25 $102,178 0 $0 13 $147,671 0 $0 FILES CLOSED FOR INCOMPLETENESS 0 $0 9 $126,934 25 $133,916 2 $25,775 0 $0 1 $91,750 0 $0
Aggregated Statistics For Year 2004(Based on 3 full and 3 partial tracts) A) FHA, FSA/RHS & VA B) Conventional C) Refinancings D) Home Improvement Loans F) Non-occupant Loans on G) Loans On Manufactured Number Average Value Number Average Value Number Average Value Number Average Value Number Average Value Number Average Value
LOANS ORIGINATED 67 $138,638 339 $114,305 398 $109,857 34 $50,756 68 $90,998 0 $0 APPLICATIONS APPROVED, NOT ACCEPTED 1 $111,660 38 $110,217 67 $105,893 10 $45,026 13 $94,392 2 $100,740 APPLICATIONS DENIED 5 $104,764 39 $114,248 152 $108,844 47 $30,091 12 $91,589 3 $72,353 APPLICATIONS WITHDRAWN 9 $134,877 38 $123,745 128 $121,120 9 $40,248 12 $86,583 0 $0 FILES CLOSED FOR INCOMPLETENESS 0 $0 8 $81,458 23 $113,317 3 $37,083 3 $69,610 0 $0
Aggregated Statistics For Year 2003(Based on 3 full and 3 partial tracts) A) FHA, FSA/RHS & VA B) Conventional C) Refinancings D) Home Improvement Loans F) Non-occupant Loans on Number Average Value Number Average Value Number Average Value Number Average Value Number Average Value
LOANS ORIGINATED 105 $120,618 305 $107,446 773 $102,982 22 $42,645 82 $82,016 APPLICATIONS APPROVED, NOT ACCEPTED 4 $127,885 15 $111,979 110 $91,409 12 $26,404 6 $109,780 APPLICATIONS DENIED 4 $113,000 26 $125,415 179 $105,265 31 $27,945 10 $76,878 APPLICATIONS WITHDRAWN 9 $111,401 37 $116,316 105 $116,282 0 $0 7 $66,401 FILES CLOSED FOR INCOMPLETENESS 2 $150,045 10 $131,650 33 $110,582 1 $77,110 3 $88,810
Aggregated Statistics For Year 2002(Based on 3 partial tracts) A) FHA, FSA/RHS & VA B) Conventional C) Refinancings D) Home Improvement Loans F) Non-occupant Loans on Number Average Value Number Average Value Number Average Value Number Average Value Number Average Value
LOANS ORIGINATED 51 $120,224 120 $107,093 250 $103,441 15 $29,161 24 $85,600 APPLICATIONS APPROVED, NOT ACCEPTED 1 $102,340 9 $116,717 36 $86,047 3 $19,243 3 $77,170 APPLICATIONS DENIED 2 $164,980 15 $88,420 110 $96,109 15 $19,767 5 $99,284 APPLICATIONS WITHDRAWN 3 $144,253 6 $106,995 57 $99,199 4 $22,535 1 $78,550 FILES CLOSED FOR INCOMPLETENESS 0 $0 4 $117,828 17 $97,717 0 $0 0 $0
Aggregated Statistics For Year 2001(Based on 3 partial tracts) A) FHA, FSA/RHS & VA B) Conventional C) Refinancings D) Home Improvement Loans F) Non-occupant Loans on Number Average Value Number Average Value Number Average Value Number Average Value Number Average Value
LOANS ORIGINATED 59 $112,643 112 $109,657 180 $101,246 15 $21,835 10 $88,786 APPLICATIONS APPROVED, NOT ACCEPTED 1 $109,200 6 $114,845 30 $78,045 3 $34,190 1 $33,640 APPLICATIONS DENIED 7 $110,189 14 $85,946 87 $77,860 17 $20,156 2 $66,225 APPLICATIONS WITHDRAWN 6 $129,293 9 $86,338 41 $91,452 4 $28,192 2 $86,965 FILES CLOSED FOR INCOMPLETENESS 0 $0 5 $75,380 18 $95,902 3 $35,543 0 $0
Aggregated Statistics For Year 2000(Based on 3 partial tracts) A) FHA, FSA/RHS & VA B) Conventional C) Refinancings D) Home Improvement Loans E) Loans on Dwellings For 5+ Families F) Non-occupant Loans on Number Average Value Number Average Value Number Average Value Number Average Value Number Average Value Number Average Value
LOANS ORIGINATED 73 $111,335 106 $114,325 40 $82,389 19 $18,303 1 $66,380 12 $92,436 APPLICATIONS APPROVED, NOT ACCEPTED 2 $130,195 8 $81,730 17 $77,418 6 $16,730 0 $0 2 $49,875 APPLICATIONS DENIED 10 $100,704 24 $84,368 60 $63,837 22 $16,144 0 $0 3 $45,720 APPLICATIONS WITHDRAWN 11 $119,461 10 $102,839 28 $63,087 2 $32,585 0 $0 2 $83,110 FILES CLOSED FOR INCOMPLETENESS 1 $135,500 1 $86,250 8 $72,745 0 $0 0 $0 1 $61,730
Aggregated Statistics For Year 1999(Based on 1 full and 4 partial tracts) A) FHA, FSA/RHS & VA B) Conventional C) Refinancings D) Home Improvement Loans F) Non-occupant Loans on Number Average Value Number Average Value Number Average Value Number Average Value Number Average Value
LOANS ORIGINATED 162 $92,485 129 $97,609 168 $72,160 30 $21,427 20 $55,650 APPLICATIONS APPROVED, NOT ACCEPTED 0 $0 15 $73,607 32 $71,037 8 $22,908 1 $89,380 APPLICATIONS DENIED 10 $75,422 39 $69,297 103 $62,331 30 $17,410 6 $58,412 APPLICATIONS WITHDRAWN 7 $85,623 13 $99,982 55 $63,743 5 $41,072 5 $61,154 FILES CLOSED FOR INCOMPLETENESS 1 $66,510 2 $49,280 14 $82,914 0 $0 0 $0
Detailed HMDA statistics for the following Tracts:
2004.09
, 2004.11 , 2004.12 , 2005.03 , 2008.01 , 2009.01
Private Mortgage Insurance Companies Aggregated Statistics For Year 2009(Based on 2 full and 3 partial tracts) A) Conventional B) Refinancings Number Average Value Number Average Value
LOANS ORIGINATED 9 $174,177 12 $191,010 APPLICATIONS APPROVED, NOT ACCEPTED 5 $189,112 8 $198,465 APPLICATIONS DENIED 1 $169,720 3 $148,877 APPLICATIONS WITHDRAWN 1 $88,210 4 $140,250 FILES CLOSED FOR INCOMPLETENESS 0 $0 0 $0
Aggregated Statistics For Year 2008(Based on 3 full and 3 partial tracts) A) Conventional B) Refinancings C) Non-occupant Loans on Number Average Value Number Average Value Number Average Value
LOANS ORIGINATED 47 $192,749 19 $191,521 3 $209,983 APPLICATIONS APPROVED, NOT ACCEPTED 6 $208,947 14 $205,511 1 $166,000 APPLICATIONS DENIED 2 $239,715 4 $221,250 2 $189,045 APPLICATIONS WITHDRAWN 1 $93,540 3 $223,183 0 $0 FILES CLOSED FOR INCOMPLETENESS 2 $173,640 1 $156,660 0 $0
Aggregated Statistics For Year 2007(Based on 2 full and 3 partial tracts) A) Conventional B) Refinancings C) Non-occupant Loans on Number Average Value Number Average Value Number Average Value
LOANS ORIGINATED 93 $190,065 31 $190,990 5 $131,474 APPLICATIONS APPROVED, NOT ACCEPTED 10 $207,620 6 $186,795 1 $124,130 APPLICATIONS DENIED 0 $0 1 $139,650 0 $0 APPLICATIONS WITHDRAWN 3 $142,073 4 $179,882 0 $0 FILES CLOSED FOR INCOMPLETENESS 0 $0 1 $97,810 0 $0
Aggregated Statistics For Year 2006(Based on 3 full and 3 partial tracts) A) Conventional B) Refinancings C) Non-occupant Loans on Number Average Value Number Average Value Number Average Value
LOANS ORIGINATED 46 $190,964 19 $182,609 4 $214,878 APPLICATIONS APPROVED, NOT ACCEPTED 2 $230,625 6 $154,165 0 $0 APPLICATIONS DENIED 0 $0 2 $244,255 0 $0 APPLICATIONS WITHDRAWN 3 $184,580 0 $0 0 $0 FILES CLOSED FOR INCOMPLETENESS 0 $0 0 $0 0 $0
Aggregated Statistics For Year 2005(Based on 3 full and 3 partial tracts) A) Conventional B) Refinancings C) Non-occupant Loans on Number Average Value Number Average Value Number Average Value
LOANS ORIGINATED 50 $171,221 27 $159,356 5 $158,606 APPLICATIONS APPROVED, NOT ACCEPTED 6 $176,012 12 $130,251 3 $107,093 APPLICATIONS DENIED 1 $91,940 0 $0 1 $91,940 APPLICATIONS WITHDRAWN 1 $131,410 3 $149,330 0 $0 FILES CLOSED FOR INCOMPLETENESS 1 $159,310 0 $0 0 $0
Aggregated Statistics For Year 2004(Based on 3 full and 3 partial tracts) A) Conventional B) Refinancings C) Non-occupant Loans on Number Average Value Number Average Value Number Average Value
LOANS ORIGINATED 78 $140,449 29 $135,120 9 $105,238 APPLICATIONS APPROVED, NOT ACCEPTED 10 $155,220 7 $134,531 1 $89,010 APPLICATIONS DENIED 1 $136,080 0 $0 0 $0 APPLICATIONS WITHDRAWN 2 $147,980 4 $79,322 2 $68,000 FILES CLOSED FOR INCOMPLETENESS 0 $0 0 $0 0 $0
Aggregated Statistics For Year 2003(Based on 3 full and 3 partial tracts) A) Conventional B) Refinancings C) Non-occupant Loans on Number Average Value Number Average Value Number Average Value
LOANS ORIGINATED 96 $130,231 99 $129,513 9 $92,693 APPLICATIONS APPROVED, NOT ACCEPTED 7 $170,001 17 $113,994 1 $90,610 APPLICATIONS DENIED 1 $124,460 1 $84,060 0 $0 APPLICATIONS WITHDRAWN 4 $154,558 4 $134,075 0 $0 FILES CLOSED FOR INCOMPLETENESS 1 $73,020 0 $0 0 $0
Aggregated Statistics For Year 2002(Based on 3 partial tracts) A) Conventional B) Refinancings C) Non-occupant Loans on Number Average Value Number Average Value Number Average Value
LOANS ORIGINATED 28 $127,638 29 $125,184 4 $101,345 APPLICATIONS APPROVED, NOT ACCEPTED 4 $123,902 3 $119,913 0 $0 APPLICATIONS DENIED 0 $0 1 $86,880 0 $0 APPLICATIONS WITHDRAWN 2 $110,450 1 $171,730 0 $0 FILES CLOSED FOR INCOMPLETENESS 0 $0 0 $0 0 $0
Aggregated Statistics For Year 2001(Based on 3 partial tracts) A) Conventional B) Refinancings C) Non-occupant Loans on Number Average Value Number Average Value Number Average Value
LOANS ORIGINATED 28 $128,995 18 $120,364 2 $82,135 APPLICATIONS APPROVED, NOT ACCEPTED 2 $116,920 2 $133,280 0 $0 APPLICATIONS DENIED 0 $0 0 $0 0 $0 APPLICATIONS WITHDRAWN 1 $91,410 1 $111,010 0 $0 FILES CLOSED FOR INCOMPLETENESS 1 $71,360 0 $0 1 $52,440
Aggregated Statistics For Year 2000(Based on 3 partial tracts) A) Conventional B) Refinancings C) Non-occupant Loans on Number Average Value Number Average Value Number Average Value
LOANS ORIGINATED 24 $117,722 3 $101,960 2 $112,245 APPLICATIONS APPROVED, NOT ACCEPTED 1 $174,320 1 $60,760 0 $0 APPLICATIONS DENIED 0 $0 0 $0 0 $0 APPLICATIONS WITHDRAWN 1 $45,140 1 $57,090 1 $45,140 FILES CLOSED FOR INCOMPLETENESS 2 $74,345 0 $0 1 $45,140
Aggregated Statistics For Year 1999(Based on 1 full and 4 partial tracts) A) Conventional B) Refinancings C) Non-occupant Loans on Number Average Value Number Average Value Number Average Value
LOANS ORIGINATED 44 $113,809 19 $97,292 3 $72,340 APPLICATIONS APPROVED, NOT ACCEPTED 3 $101,963 4 $93,538 0 $0 APPLICATIONS DENIED 3 $82,483 1 $66,100 1 $39,460 APPLICATIONS WITHDRAWN 0 $0 0 $0 0 $0 FILES CLOSED FOR INCOMPLETENESS 2 $112,275 1 $49,330 0 $0
Detailed PMIC statistics for the following Tracts:
2004.09
, 2004.11 , 2004.12 , 2005.03 , 2008.01 , 2009.01 Laurel compared to Virginia state average:
Unemployed percentage significantly below state average. Black race population percentage above state average. Foreign-born population percentage above state average. Length of stay since moving in significantly above state average. Institutionalized population percentage significantly above state average.
#25 on the list of "Top 101 cities with the most residents born in Egypt (population 500+)"
#51 on the list of "Top 101 cities with the most residents born in Northern Africa (population 500+)"
#98 on the list of "Top 101 cities with the largest percentage of people in unknown juvenile institutions (population 1,000+)"
#8 (23294) on the list of "Top 101 zip codes with the highest 2012 average net capital gain/loss (pop 5,000+)"
#4 on the list of "Top 101 counties with the lowest total withdrawal of fresh water for public supply (pop. 50,000+)"
#52 on the list of "Top 101 counties with the lowest ground withdrawal of fresh water for public supply (pop. 50,000+)"
#56 on the list of "Top 101 counties with the largest decrease in the number of infant deaths per 1000 residents 2000-2006 to 2007-2013 (pop. 50,000+)"
#65 on the list of "Top 101 counties with the lowest Particulate Matter (PM10 ) Annual air pollution readings in 2012 (µg/m3 )"
#75 on the list of "Top 101 counties with the highest number of infant deaths per 1000 residents 2007-2013 (pop. 50,000+)"


 Recent articles from our blog. Our writers, many of them Ph.D. graduates or candidates, create easy-to-read articles on a wide variety of topics.

 (7.1 miles