Races in Annapolis, Maryland (MD) Detailed Stats
Data:
Races - White alone (%)
Races - White alone (% change since 2000)
Races - Black alone (%)
Races - Black alone (% change since 2000)
Races - American Indian alone (%)
Races - American Indian alone (% change since 2000)
Races - Asian alone (%)
Races - Asian alone (% change since 2000)
Races - Hispanic (%)
Races - Hispanic (% change since 2000)
Races - Native Hawaiian and Other Pacific Islander alone (%)
Races - Native Hawaiian and Other Pacific Islander alone (% change since 2000)
Races - Two or more races(%)
Races - Two or more races(% change since 2000)
Races - Other race alone (%)
Races - Other race alone (% change since 2000)
Racial diversity
Place of birth - Born in state of residence (%)
Place of birth - Born in state of residence (%) - White
Place of birth - Born in state of residence (%) - Black or African American
Place of birth - Born in state of residence (%) - Asian
Place of birth - Born in state of residence (%) - Hispanic or Latino
Place of birth - Born in state of residence (%) - American Indian and Alaska Native
Place of birth - Born in state of residence (%) - Multirace
Place of birth - Born in state of residence (%) - Other Race
Place of birth - Born in other state (%)
Place of birth - Born in other state (%) - White
Place of birth - Born in other state (%) - Black or African American
Place of birth - Born in other state (%) - Asian
Place of birth - Born in other state (%) - Hispanic or Latino
Place of birth - Born in other state (%) - American Indian and Alaska Native
Place of birth - Born in other state (%) - Multirace
Place of birth - Born in other state (%) - Other Race
Place of birth - Native, outside of US (%)
Place of birth - Native, outside of US (%) - White
Place of birth - Native, outside of US (%) - Black or African American
Place of birth - Native, outside of US (%) - Asian
Place of birth - Native, outside of US (%) - Hispanic or Latino
Place of birth - Native, outside of US (%) - American Indian and Alaska Native
Place of birth - Native, outside of US (%) - Multirace
Place of birth - Native, outside of US (%) - Other Race
Place of birth - Foreign born (%)
Place of birth - Foreign born (%) - White
Place of birth - Foreign born (%) - Black or African American
Place of birth - Foreign born (%) - Asian
Place of birth - Foreign born (%) - Hispanic or Latino
Place of birth - Foreign born (%) - American Indian and Alaska Native
Place of birth - Foreign born (%) - Multirace
Place of birth - Foreign born (%) - Other Race
Residents speaking English at home (%)
Residents speaking English at home - Born in the United States (%)
Residents speaking English at home - Native, born elsewhere (%)
Residents speaking English at home - Foreign born (%)
Residents speaking Spanish at home (%)
Residents speaking Spanish at home - Born in the United States (%)
Residents speaking Spanish at home - Native, born elsewhere (%)
Residents speaking Spanish at home - Foreign born (%)
Residents speaking other language at home (%)
Residents speaking other language at home - Born in the United States (%)
Residents speaking other language at home - Native, born elsewhere (%)
Residents speaking other language at home - Foreign born (%)
Marital status - Never married (%)
Marital status - Now married (%)
Marital status - Separated (%)
Marital status - Widowed (%)
Marital status - Divorced (%)
Ancestries Reported - Arab (%)
Ancestries Reported - Czech (%)
Ancestries Reported - Danish (%)
Ancestries Reported - Dutch (%)
Ancestries Reported - English (%)
Ancestries Reported - French (%)
Ancestries Reported - French Canadian (%)
Ancestries Reported - German (%)
Ancestries Reported - Greek (%)
Ancestries Reported - Hungarian (%)
Ancestries Reported - Irish (%)
Ancestries Reported - Italian (%)
Ancestries Reported - Lithuanian (%)
Ancestries Reported - Norwegian (%)
Ancestries Reported - Polish (%)
Ancestries Reported - Portuguese (%)
Ancestries Reported - Russian (%)
Ancestries Reported - Scotch-Irish (%)
Ancestries Reported - Scottish (%)
Ancestries Reported - Slovak (%)
Ancestries Reported - Subsaharan African (%)
Ancestries Reported - Swedish (%)
Ancestries Reported - Swiss (%)
Ancestries Reported - Ukrainian (%)
Ancestries Reported - United States (%)
Ancestries Reported - Welsh (%)
Ancestries Reported - West Indian (%)
Ancestries Reported - Other (%)
Geographical mobility - Same house 1 year ago (%)
Geographical mobility - Same house 1 year ago (%) - White
Geographical mobility - Same house 1 year ago (%) - Black or African American
Geographical mobility - Same house 1 year ago (%) - Asian
Geographical mobility - Same house 1 year ago (%) - Hispanic or Latino
Geographical mobility - Same house 1 year ago (%) - American Indian and Alaska Native
Geographical mobility - Same house 1 year ago (%) - Multirace
Geographical mobility - Same house 1 year ago (%) - Other Race
Geographical mobility - Moved within same county (%)
Geographical mobility - Moved within same county (%) - White
Geographical mobility - Moved within same county (%) - Black or African American
Geographical mobility - Moved within same county (%) - Asian
Geographical mobility - Moved within same county (%) - Hispanic or Latino
Geographical mobility - Moved within same county (%) - American Indian and Alaska Native
Geographical mobility - Moved within same county (%) - Multirace
Geographical mobility - Moved within same county (%) - Other Race
Geographical mobility - Moved from different county within same state (%)
Geographical mobility - Moved from different county within same state (%) - White
Geographical mobility - Moved from different county within same state (%) - Black or African American
Geographical mobility - Moved from different county within same state (%) - Asian
Geographical mobility - Moved from different county within same state (%) - Hispanic or Latino
Geographical mobility - Moved from different county within same state (%) - American Indian and Alaska Native
Geographical mobility - Moved from different county within same state (%) - Multirace
Geographical mobility - Moved from different county within same state (%) - Other Race
Geographical mobility - Moved from different state (%)
Geographical mobility - Moved from different state (%) - White
Geographical mobility - Moved from different state (%) - Black or African American
Geographical mobility - Moved from different state (%) - Asian
Geographical mobility - Moved from different state (%) - Hispanic or Latino
Geographical mobility - Moved from different state (%) - American Indian and Alaska Native
Geographical mobility - Moved from different state (%) - Multirace
Geographical mobility - Moved from different state (%) - Other Race
Geographical mobility - Moved from abroad (%)
Geographical mobility - Moved from abroad (%) - White
Geographical mobility - Moved from abroad (%) - Black or African American
Geographical mobility - Moved from abroad (%) - Asian
Geographical mobility - Moved from abroad (%) - Hispanic or Latino
Geographical mobility - Moved from abroad (%) - American Indian and Alaska Native
Geographical mobility - Moved from abroad (%) - Multirace
Geographical mobility - Moved from abroad (%) - Other Race
Place of birth for the foreign-born population - Ireland (%)
Place of birth for the foreign-born population - Denmark (%)
Place of birth for the foreign-born population - Norway (%)
Place of birth for the foreign-born population - Sweden (%)
Place of birth for the foreign-born population - United Kingdom (%)
Place of birth for the foreign-born population - England (%)
Place of birth for the foreign-born population - Scotland (%)
Place of birth for the foreign-born population - Other Northern Europe (%)
Place of birth for the foreign-born population - Austria (%)
Place of birth for the foreign-born population - Belgium (%)
Place of birth for the foreign-born population - France (%)
Place of birth for the foreign-born population - Germany (%)
Place of birth for the foreign-born population - Netherlands (%)
Place of birth for the foreign-born population - Switzerland (%)
Place of birth for the foreign-born population - Other Western Europe (%)
Place of birth for the foreign-born population - Greece (%)
Place of birth for the foreign-born population - Italy (%)
Place of birth for the foreign-born population - Portugal (%)
Place of birth for the foreign-born population - Spain (%)
Place of birth for the foreign-born population - Other Southern Europe (%)
Place of birth for the foreign-born population - Albania (%)
Place of birth for the foreign-born population - Belarus (%)
Place of birth for the foreign-born population - Bosnia and Herzegovina (%)
Place of birth for the foreign-born population - Bulgaria (%)
Place of birth for the foreign-born population - Croatia (%)
Place of birth for the foreign-born population - Czechoslovakia (%)
Place of birth for the foreign-born population - Hungary (%)
Place of birth for the foreign-born population - Latvia (%)
Place of birth for the foreign-born population - Lithuania (%)
Place of birth for the foreign-born population - North Macedonia (Macedonia) (%)
Place of birth for the foreign-born population - Moldova (%)
Place of birth for the foreign-born population - Poland (%)
Place of birth for the foreign-born population - Romania (%)
Place of birth for the foreign-born population - Russia (%)
Place of birth for the foreign-born population - Serbia (%)
Place of birth for the foreign-born population - Ukraine (%)
Place of birth for the foreign-born population - Other Eastern Europe (%)
Place of birth for the foreign-born population - China (%)
Place of birth for the foreign-born population - Hong Kong (%)
Place of birth for the foreign-born population - Taiwan (%)
Place of birth for the foreign-born population - Japan (%)
Place of birth for the foreign-born population - Korea (%)
Place of birth for the foreign-born population - Other Eastern Asia (%)
Place of birth for the foreign-born population - Afghanistan (%)
Place of birth for the foreign-born population - Bangladesh (%)
Place of birth for the foreign-born population - India (%)
Place of birth for the foreign-born population - Iran (%)
Place of birth for the foreign-born population - Kazakhstan (%)
Place of birth for the foreign-born population - Nepal (%)
Place of birth for the foreign-born population - Pakistan (%)
Place of birth for the foreign-born population - Sri Lanka (%)
Place of birth for the foreign-born population - Uzbekistan (%)
Place of birth for the foreign-born population - Other South Central Asia (%)
Place of birth for the foreign-born population - Burma (%)
Place of birth for the foreign-born population - Cambodia (%)
Place of birth for the foreign-born population - Indonesia (%)
Place of birth for the foreign-born population - Laos (%)
Place of birth for the foreign-born population - Malaysia (%)
Place of birth for the foreign-born population - Philippines (%)
Place of birth for the foreign-born population - Singapore (%)
Place of birth for the foreign-born population - Thailand (%)
Place of birth for the foreign-born population - Vietnam (%)
Place of birth for the foreign-born population - Other South Eastern Asia (%)
Place of birth for the foreign-born population - Armenia (%)
Place of birth for the foreign-born population - Iraq (%)
Place of birth for the foreign-born population - Israel (%)
Place of birth for the foreign-born population - Jordan (%)
Place of birth for the foreign-born population - Kuwait (%)
Place of birth for the foreign-born population - Lebanon (%)
Place of birth for the foreign-born population - Saudi Arabia (%)
Place of birth for the foreign-born population - Syria (%)
Place of birth for the foreign-born population - Turkey (%)
Place of birth for the foreign-born population - Yemen (%)
Place of birth for the foreign-born population - Other Western Asia (%)
Place of birth for the foreign-born population - Eritrea (%)
Place of birth for the foreign-born population - Ethiopia (%)
Place of birth for the foreign-born population - Kenya (%)
Place of birth for the foreign-born population - Somalia (%)
Place of birth for the foreign-born population - Uganda (%)
Place of birth for the foreign-born population - Zimbabwe (%)
Place of birth for the foreign-born population - Other Eastern Africa (%)
Place of birth for the foreign-born population - Cameroon (%)
Place of birth for the foreign-born population - Congo (%)
Place of birth for the foreign-born population - Democratic Republic of Congo (Zaire) (%)
Place of birth for the foreign-born population - Other Middle Africa (%)
Place of birth for the foreign-born population - Egypt (%)
Place of birth for the foreign-born population - Morocco (%)
Place of birth for the foreign-born population - Sudan (%)
Place of birth for the foreign-born population - Other Northern Africa (%)
Place of birth for the foreign-born population - South Africa (%)
Place of birth for the foreign-born population - Other Southern Africa (%)
Place of birth for the foreign-born population - Cabo Verde (%)
Place of birth for the foreign-born population - Ghana (%)
Place of birth for the foreign-born population - Liberia (%)
Place of birth for the foreign-born population - Nigeria (%)
Place of birth for the foreign-born population - Senegal (%)
Place of birth for the foreign-born population - Sierra Leone (%)
Place of birth for the foreign-born population - Other Western Africa (%)
Place of birth for the foreign-born population - Australia (%)
Place of birth for the foreign-born population - New Zealand (%)
Place of birth for the foreign-born population - Fiji (%)
Place of birth for the foreign-born population - Micronesia (%)
Place of birth for the foreign-born population - Bahamas (%)
Place of birth for the foreign-born population - Barbados (%)
Place of birth for the foreign-born population - Cuba (%)
Place of birth for the foreign-born population - Dominica (%)
Place of birth for the foreign-born population - Dominican Republic (%)
Place of birth for the foreign-born population - Grenada (%)
Place of birth for the foreign-born population - Haiti (%)
Place of birth for the foreign-born population - Jamaica (%)
Place of birth for the foreign-born population - St. Vincent and the Grenadines (%)
Place of birth for the foreign-born population - Trinidad and Tobago (%)
Place of birth for the foreign-born population - West Indies (%)
Place of birth for the foreign-born population - Other Caribbean (%)
Place of birth for the foreign-born population - Belize (%)
Place of birth for the foreign-born population - Costa Rica (%)
Place of birth for the foreign-born population - El Salvador (%)
Place of birth for the foreign-born population - Guatemala (%)
Place of birth for the foreign-born population - Honduras (%)
Place of birth for the foreign-born population - Mexico (%)
Place of birth for the foreign-born population - Nicaragua (%)
Place of birth for the foreign-born population - Panama (%)
Place of birth for the foreign-born population - Other Central America (%)
Place of birth for the foreign-born population - Argentina (%)
Place of birth for the foreign-born population - Bolivia (%)
Place of birth for the foreign-born population - Brazil (%)
Place of birth for the foreign-born population - Chile (%)
Place of birth for the foreign-born population - Colombia (%)
Place of birth for the foreign-born population - Ecuador (%)
Place of birth for the foreign-born population - Guyana (%)
Place of birth for the foreign-born population - Peru (%)
Place of birth for the foreign-born population - Uruguay (%)
Place of birth for the foreign-born population - Venezuela (%)
Place of birth for the foreign-born population - Other South America (%)
Place of birth for the foreign-born population - Canada (%)
Place of birth for the foreign-born population - Other Northern America (%)
Place of birth for the foreign-born population - Other (%)
Latest news about races in Annapolis, MD collected exclusively by city-data.com from local newspapers, TV, and radio stations
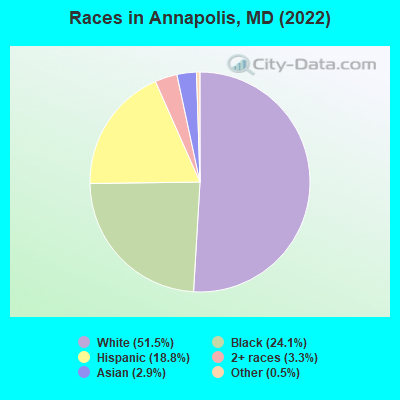
According to 2022 data, the most numerous races in Annapolis, MD are White alone (21,144 residents), Black alone (9,890 residents), and Hispanic (7,734 residents). 82.8% of Annapolis residents speak English at home. 11.1% of Annapolis, MD residents are foreign-born (6.3% born in Latin America, 2.3% born in Asia, 1.4% born in Europe), which is 44.1% less than the foreign-born rate of 16.0% across the entire state of Maryland.
Race distribution in Annapolis
2000 2022
3,286,547 62.1% White alone 1,464,735 27.7% Black alone 227,916 4.3% Hispanic 209,738 4.0% Asian alone 82,946 1.6% Two or more races 13,312 0.3% American Indian alone 9,379 0.2% Other race alone 1,913 0.04% Native Hawaiian and Other
2,906,492 47.1% White alone 1,800,914 29.2% Black alone 705,842 11.4% Hispanic 401,818 6.5% Asian alone 291,317 4.7% Two or more races 46,930 0.8% Other race alone 8,930 0.1% American Indian alone 2,417 0.04% Native Hawaiian and Other
Income and house value in Annapolis Median household income in 2022 $121,168 White non-Hispanic householders$57,329 Black householders$50,859 Asian householders$73,661 Some other race householders$92,232 Two or more races householders$96,262 Hispanic or Latino race householdersMedian 2022 house value $569,199 White Non-Hispanic householders$375,266 Black or African American householdersover $1,000,000 American Indian or Alaska Native householders $419,830 Asian householders$369,733 Some other race householders$331,316 Two or more races householders$427,514 Hispanic or Latino householders
Median age by race in Annapolis
44.6 Median age for White residents41.9 48.3 39.0 Median age for Black or African American residents38.9 40.0 23.6 Median age for American Indian / Alaska Native residents-674,418,604.0 -1,072,276,158.6 37.6 Median age for Asian residents42.4 34.5 -534,101,824.6 Median age for Native Hawaiian / Pacific Islander residents-720,061,021.4 -760,942,760.2 25.6 Median age for Other race residents26.0 25.3 39.7 Median age for Two or more races residents46.7 37.0 47.2 Median age for White alone residents45.0 50.3 22.8 Median age for Hispanic or Latino residents22.5 23.7
Owner/renter occupied households by race in Annapolis
House owners and renters - White residents 7,296 67.9% Owner occupied3,456 32.1% Renter occupiedHouse owners and renters - Black or African American residents 1,664 40.0% Owner occupied2,495 60.0% Renter occupiedHouse owners and renters - American Indian / Alaska Native residents 19 100.0% Owner occupiedHouse owners and renters - Asian residents 363 79.3% Owner occupied95 20.7% Renter occupiedHouse owners and renters - Other race residents 315 35.7% Owner occupied567 64.3% Renter occupiedHouse owners and renters - Two or more races residents 815 71.4% Owner occupied326 28.6% Renter occupiedHouse owners and renters - White alone residents 7,227 68.9% Owner occupied3,259 31.1% Renter occupiedHouse owners and renters - Hispanic or Latino residents 673 41.6% Owner occupied944 58.4% Renter occupied
Language usage in Annapolis
English speakers - Total 82.8% of residents of Annapolis speak English at home.
11.2% of residents speak Spanish at home 2,326 54.7% Speak English very well1,927 45.3% Speak English less than very well6.3% of residents speak other language at home 1,799 75.3% Speak English very well590 24.7% Speak English less than very well
English speakers - Born in the United States 93.1% of residents of Annapolis speak English at home.
3.0% of residents speak Spanish at home 396 85.5% Speak English very well67 14.5% Speak English less than very well3.8% of residents speak other language at home 564 94.9% Speak English very well30 5.1% Speak English less than very well
English speakers - Native, born elsewhere 45.5% of residents of Annapolis speak English at home.
43.3% of residents speak Spanish at home 360 83.5% Speak English very well71 16.5% Speak English less than very well13.7% of residents speak other language at home 136 100.0% Speak English very well
English speakers - Foreign-born 13.9% of residents of Annapolis speak English at home.
56.4% of residents speak Spanish at home 696 28.5% Speak English very well1,742 71.5% Speak English less than very well32.7% of residents speak other language at home 998 70.6% Speak English very well416 29.4% Speak English less than very well
White (Caucasian) - Speak only English Native:
95.2% (19,451)Foreign-born:
28.7% (210)
White (Caucasian) - Speak another language Native:
4.3% (869)Foreign-born:
67.5% (494)
Black or African American - Speak only English Native:
97.0% (8,796)Foreign-born:
16.0% (28)
Black or African American - Speak another language Native:
2.6% (240)Foreign-born:
88.6% (152)
Asian - Speak only English Native:
71.7% (140)Foreign-born:
5.0% (48)
Asian - Speak another language Native:
26.2% (51)Foreign-born:
95.6% (911)
Other race - Speak only English Native:
43.4% (889)Foreign-born:
7.9% (149)
Other race - Speak another language Native:
56.2% (1,151)Foreign-born:
91.2% (1,712)
Two or more races - Speak only English Native:
79.5% (1,496)Foreign-born:
9.8% (49)
Two or more races - Speak another language Native:
20.7% (390)Foreign-born:
83.1% (421)
White alone - Speak only English Native:
96.8% (18,944)Foreign-born:
41.9% (211)
White alone - Speak another language Native:
3.0% (596)Foreign-born:
58.1% (293)
Hispanic or Latino - Speak only English Native:
50.9% (1,865)Foreign-born:
8.1% (208)
Hispanic or Latino - Speak another language Native:
48.9% (1,789)Foreign-born:
92.5% (2,382)
Foreign-born residents in Annapolis 4,561 residents are foreign born (6.3% Latin America , 2.3% Asia , 1.4% Europe ).
This city:
11.1%Maryland:
15.7%
Marital status for residents in Annapolis Marital status - White (Caucasian) population 15 years and over
Males 31.6% Never married51.8% Now married0.9% Separated2.4% Widowed13.2% DivorcedFemales 26.4% Never married45.2% Now married2.3% Separated9.5% Widowed16.6% DivorcedWomen who gave birth in the past 12 months Now married:
91.4% (260)Unmarried:
8.6% (25)
Women who did not give birth in the past 12 months Now married:
43.6% (1,889)Unmarried:
56.4% (2,441)
Marital status - Black or African American population 15 years and over
Males 36.8% Never married47.2% Now married1.8% Separated2.8% Widowed11.3% DivorcedFemales 49.0% Never married23.4% Now married1.3% Separated5.1% Widowed21.2% DivorcedWomen who gave birth in the past 12 months Now married:
0.0% (0)Unmarried:
100.0% (33)
Women who did not give birth in the past 12 months Now married:
8.9% (181)Unmarried:
91.1% (1,844)
Marital status - American Indian / Alaska Native population 15 years and over
Males 0.0% Never married100.0% Now married0.0% Separated0.0% Widowed0.0% DivorcedFemales 100.0% Never married0.0% Now married0.0% Separated0.0% Widowed0.0% DivorcedWomen who did not give birth in the past 12 months Now married:
0.0% (0)Unmarried:
100.0% (12)
Marital status - Asian population 15 years and over
Males 49.1% Never married47.4% Now married0.0% Separated0.0% Widowed3.5% DivorcedFemales 11.4% Never married71.6% Now married0.0% Separated17.0% Widowed0.0% DivorcedWomen who gave birth in the past 12 months Now married:
100.0% (169)Unmarried:
0.0% (0)
Women who did not give birth in the past 12 months Now married:
73.6% (194)Unmarried:
26.4% (70)
Marital status - Other race population 15 years and over
Males 50.3% Never married43.5% Now married0.0% Separated0.0% Widowed6.3% DivorcedFemales 32.6% Never married48.9% Now married3.3% Separated4.2% Widowed11.1% DivorcedWomen who gave birth in the past 12 months Now married:
100.0% (10)Unmarried:
0.0% (0)
Women who did not give birth in the past 12 months Now married:
54.8% (718)Unmarried:
45.2% (592)
Marital status - Two or more races population 15 years and over
Males 27.9% Never married44.7% Now married23.3% Separated0.0% Widowed4.1% DivorcedFemales 32.9% Never married56.1% Now married0.0% Separated1.6% Widowed9.4% DivorcedWomen who gave birth in the past 12 months Now married:
100.0% (16)Unmarried:
0.0% (0)
Women who did not give birth in the past 12 months Now married:
55.3% (481)Unmarried:
44.7% (389)
Marital status - White alone, not Hispanic / Latino population 15 years and over
Males 29.9% Never married53.6% Now married1.0% Separated2.6% Widowed12.9% DivorcedFemales 25.7% Never married45.5% Now married2.4% Separated9.8% Widowed16.6% DivorcedWomen who gave birth in the past 12 months Now married:
90.6% (244)Unmarried:
9.4% (25)
Women who did not give birth in the past 12 months Now married:
44.4% (1,780)Unmarried:
55.6% (2,232)
Marital status - Hispanic or Latino population 15 years and over
Males 46.5% Never married38.3% Now married7.1% Separated0.0% Widowed8.2% DivorcedFemales 34.1% Never married48.4% Now married2.1% Separated3.9% Widowed11.5% DivorcedWomen who gave birth in the past 12 months Now married:
100.0% (49)Unmarried:
0.0% (0)
Women who did not give birth in the past 12 months Now married:
50.8% (972)Unmarried:
49.2% (941)
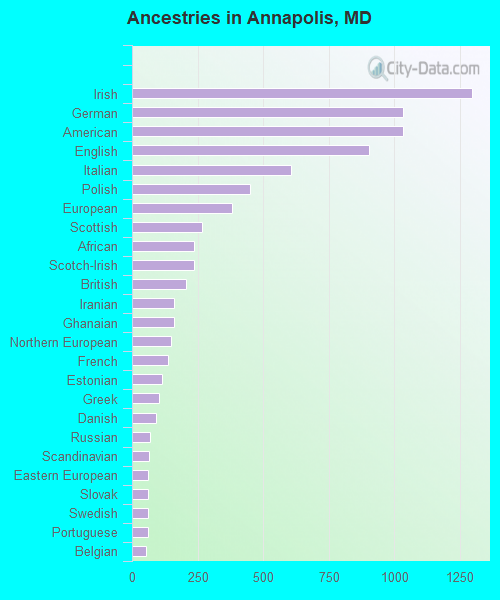
Ancestries in Annapolis
1,297 7.4% Irish1,034 5.9% German1,033 5.9% American903 5.1% English607 3.5% Italian450 2.6% Polish382 2.2% European268 1.5% Scottish236 1.3% African235 1.3% Scotch-Irish206 1.2% British161 0.9% Iranian161 0.9% Ghanaian148 0.8% Northern European138 0.8% French115 0.7% Estonian103 0.6% Greek93 0.5% Danish68 0.4% Russian63 0.4% Scandinavian62 0.4% Eastern European61 0.3% Slovak61 0.3% Swedish60 0.3% Portuguese55 0.3% Belgian53 0.3% Hungarian50 0.3% Norwegian45 0.3% Albanian45 0.3% Welsh43 0.2% French Canadian31 0.2% West Indian31 0.2% Armenian30 0.2% Dutch26 0.1% Austrian24 0.1% British West Indian19 0.1% Croatian18 0.1% Alsatian18 0.1% Lithuanian17 0.10% South African17 0.10% Sudanese16 0.09% Canadian13 0.07% Brazilian10 0.06% Czech9 0.05% Afghan9 0.05% Ethiopian9 0.05% Syrian8 0.05% Serbian8 0.05% Jamaican
Geographical mobility in Annapolis Same house 1 year ago 19,136 84.5% White (Caucasian)9,234 93.4% Black or African American33 73.4% American Indian / Alaska Native791 66.0% Asian3,887 82.4% Other race2,562 90.4% Two or more races17,433 83.5% White alone, not Hispanic / Latino6,992 90.5% Hispanic or LatinoMoved within same county 1,938 8.6% White / Caucasian307 3.1% Black or African American265 22.1% Asian379 8.0% Other race79 2.8% Two or more races1,786 8.5% White alone, not Hispanic / Latino453 5.9% Hispanic or LatinoMoved within same state 400 1.8% White / Caucasian267 2.7% Black or African American16 35.3% American Indian / Alaska Native24 2.0% Asian256 5.4% Other race111 3.9% Two or more races443 2.1% White alone, not Hispanic / Latino169 2.2% Hispanic or LatinoMoved from different state 1,135 5.0% White / Caucasian96 1.0% Black or African American9 0.8% Asian64 1.4% Other race56 2.0% Two or more races1,150 5.5% White alone, not Hispanic / Latino115 1.5% Hispanic or LatinoMoved from abroad 69 0.3% White55 0.6% Black or African American86 1.8% Other race85 3.0% Two or more races74 0.4% White alone, not Hispanic / Latino121 1.6% Hispanic or Latino
Children Nativity (place of birth) in Annapolis
Children under 6 years - Living with two parents Both parents native 1,735 100.0% NativeBoth parents foreign-born 585 97.0% Native18 3.0% Foreign-bornOne native, one foreign-born parent 205 100.0% NativeChildren under 6 years - Living with one parent Native parent 676 100.0% NativeForeign-born parent 170 100.0% NativeChildren 6 to 17 years - Living with two parents Both parents native 1,570 99.9% Native2 0.1% Foreign-bornBoth parents foreign-born 523 80.0% Native130 20.0% Foreign-bornOne native, one foreign-born parent 262 100.0% NativeChildren 6 to 17 years - Living with one parent Native parent 2,032 100.0% NativeForeign-born parent 253 63.5% Native145 36.5% Foreign-born
Grandparents responsible for own grandchildren in Annapolis
Grandparents (30 to 59 years) White / Caucasian 1 66.2% Not responsible for grandchildrenBlack or African American 10 100.0% Not responsible for grandchildrenHispanic or Latino 1 82.5% Not responsible for grandchildrenGrandparents (60 years and over) White / Caucasian 33 11.3% Responsible for grandchildren259 88.7% Not responsible for grandchildrenBlack or African American 196 66.1% Responsible for grandchildren100 33.9% Not responsible for grandchildrenHispanic or Latino 45 100.0% Responsible for grandchildren