Races in Carney, Maryland (MD) Detailed Stats
Data:
Races - White alone (%)
Races - White alone (% change since 2000)
Races - Black alone (%)
Races - Black alone (% change since 2000)
Races - American Indian alone (%)
Races - American Indian alone (% change since 2000)
Races - Asian alone (%)
Races - Asian alone (% change since 2000)
Races - Hispanic (%)
Races - Hispanic (% change since 2000)
Races - Native Hawaiian and Other Pacific Islander alone (%)
Races - Native Hawaiian and Other Pacific Islander alone (% change since 2000)
Races - Two or more races(%)
Races - Two or more races(% change since 2000)
Races - Other race alone (%)
Races - Other race alone (% change since 2000)
Racial diversity
Place of birth - Born in state of residence (%)
Place of birth - Born in state of residence (%) - White
Place of birth - Born in state of residence (%) - Black or African American
Place of birth - Born in state of residence (%) - Asian
Place of birth - Born in state of residence (%) - Hispanic or Latino
Place of birth - Born in state of residence (%) - American Indian and Alaska Native
Place of birth - Born in state of residence (%) - Multirace
Place of birth - Born in state of residence (%) - Other Race
Place of birth - Born in other state (%)
Place of birth - Born in other state (%) - White
Place of birth - Born in other state (%) - Black or African American
Place of birth - Born in other state (%) - Asian
Place of birth - Born in other state (%) - Hispanic or Latino
Place of birth - Born in other state (%) - American Indian and Alaska Native
Place of birth - Born in other state (%) - Multirace
Place of birth - Born in other state (%) - Other Race
Place of birth - Native, outside of US (%)
Place of birth - Native, outside of US (%) - White
Place of birth - Native, outside of US (%) - Black or African American
Place of birth - Native, outside of US (%) - Asian
Place of birth - Native, outside of US (%) - Hispanic or Latino
Place of birth - Native, outside of US (%) - American Indian and Alaska Native
Place of birth - Native, outside of US (%) - Multirace
Place of birth - Native, outside of US (%) - Other Race
Place of birth - Foreign born (%)
Place of birth - Foreign born (%) - White
Place of birth - Foreign born (%) - Black or African American
Place of birth - Foreign born (%) - Asian
Place of birth - Foreign born (%) - Hispanic or Latino
Place of birth - Foreign born (%) - American Indian and Alaska Native
Place of birth - Foreign born (%) - Multirace
Place of birth - Foreign born (%) - Other Race
Residents speaking English at home (%)
Residents speaking English at home - Born in the United States (%)
Residents speaking English at home - Native, born elsewhere (%)
Residents speaking English at home - Foreign born (%)
Residents speaking Spanish at home (%)
Residents speaking Spanish at home - Born in the United States (%)
Residents speaking Spanish at home - Native, born elsewhere (%)
Residents speaking Spanish at home - Foreign born (%)
Residents speaking other language at home (%)
Residents speaking other language at home - Born in the United States (%)
Residents speaking other language at home - Native, born elsewhere (%)
Residents speaking other language at home - Foreign born (%)
Marital status - Never married (%)
Marital status - Now married (%)
Marital status - Separated (%)
Marital status - Widowed (%)
Marital status - Divorced (%)
Ancestries Reported - Arab (%)
Ancestries Reported - Czech (%)
Ancestries Reported - Danish (%)
Ancestries Reported - Dutch (%)
Ancestries Reported - English (%)
Ancestries Reported - French (%)
Ancestries Reported - French Canadian (%)
Ancestries Reported - German (%)
Ancestries Reported - Greek (%)
Ancestries Reported - Hungarian (%)
Ancestries Reported - Irish (%)
Ancestries Reported - Italian (%)
Ancestries Reported - Lithuanian (%)
Ancestries Reported - Norwegian (%)
Ancestries Reported - Polish (%)
Ancestries Reported - Portuguese (%)
Ancestries Reported - Russian (%)
Ancestries Reported - Scotch-Irish (%)
Ancestries Reported - Scottish (%)
Ancestries Reported - Slovak (%)
Ancestries Reported - Subsaharan African (%)
Ancestries Reported - Swedish (%)
Ancestries Reported - Swiss (%)
Ancestries Reported - Ukrainian (%)
Ancestries Reported - United States (%)
Ancestries Reported - Welsh (%)
Ancestries Reported - West Indian (%)
Ancestries Reported - Other (%)
Geographical mobility - Same house 1 year ago (%)
Geographical mobility - Same house 1 year ago (%) - White
Geographical mobility - Same house 1 year ago (%) - Black or African American
Geographical mobility - Same house 1 year ago (%) - Asian
Geographical mobility - Same house 1 year ago (%) - Hispanic or Latino
Geographical mobility - Same house 1 year ago (%) - American Indian and Alaska Native
Geographical mobility - Same house 1 year ago (%) - Multirace
Geographical mobility - Same house 1 year ago (%) - Other Race
Geographical mobility - Moved within same county (%)
Geographical mobility - Moved within same county (%) - White
Geographical mobility - Moved within same county (%) - Black or African American
Geographical mobility - Moved within same county (%) - Asian
Geographical mobility - Moved within same county (%) - Hispanic or Latino
Geographical mobility - Moved within same county (%) - American Indian and Alaska Native
Geographical mobility - Moved within same county (%) - Multirace
Geographical mobility - Moved within same county (%) - Other Race
Geographical mobility - Moved from different county within same state (%)
Geographical mobility - Moved from different county within same state (%) - White
Geographical mobility - Moved from different county within same state (%) - Black or African American
Geographical mobility - Moved from different county within same state (%) - Asian
Geographical mobility - Moved from different county within same state (%) - Hispanic or Latino
Geographical mobility - Moved from different county within same state (%) - American Indian and Alaska Native
Geographical mobility - Moved from different county within same state (%) - Multirace
Geographical mobility - Moved from different county within same state (%) - Other Race
Geographical mobility - Moved from different state (%)
Geographical mobility - Moved from different state (%) - White
Geographical mobility - Moved from different state (%) - Black or African American
Geographical mobility - Moved from different state (%) - Asian
Geographical mobility - Moved from different state (%) - Hispanic or Latino
Geographical mobility - Moved from different state (%) - American Indian and Alaska Native
Geographical mobility - Moved from different state (%) - Multirace
Geographical mobility - Moved from different state (%) - Other Race
Geographical mobility - Moved from abroad (%)
Geographical mobility - Moved from abroad (%) - White
Geographical mobility - Moved from abroad (%) - Black or African American
Geographical mobility - Moved from abroad (%) - Asian
Geographical mobility - Moved from abroad (%) - Hispanic or Latino
Geographical mobility - Moved from abroad (%) - American Indian and Alaska Native
Geographical mobility - Moved from abroad (%) - Multirace
Geographical mobility - Moved from abroad (%) - Other Race
Place of birth for the foreign-born population - Ireland (%)
Place of birth for the foreign-born population - Denmark (%)
Place of birth for the foreign-born population - Norway (%)
Place of birth for the foreign-born population - Sweden (%)
Place of birth for the foreign-born population - United Kingdom (%)
Place of birth for the foreign-born population - England (%)
Place of birth for the foreign-born population - Scotland (%)
Place of birth for the foreign-born population - Other Northern Europe (%)
Place of birth for the foreign-born population - Austria (%)
Place of birth for the foreign-born population - Belgium (%)
Place of birth for the foreign-born population - France (%)
Place of birth for the foreign-born population - Germany (%)
Place of birth for the foreign-born population - Netherlands (%)
Place of birth for the foreign-born population - Switzerland (%)
Place of birth for the foreign-born population - Other Western Europe (%)
Place of birth for the foreign-born population - Greece (%)
Place of birth for the foreign-born population - Italy (%)
Place of birth for the foreign-born population - Portugal (%)
Place of birth for the foreign-born population - Spain (%)
Place of birth for the foreign-born population - Other Southern Europe (%)
Place of birth for the foreign-born population - Albania (%)
Place of birth for the foreign-born population - Belarus (%)
Place of birth for the foreign-born population - Bosnia and Herzegovina (%)
Place of birth for the foreign-born population - Bulgaria (%)
Place of birth for the foreign-born population - Croatia (%)
Place of birth for the foreign-born population - Czechoslovakia (%)
Place of birth for the foreign-born population - Hungary (%)
Place of birth for the foreign-born population - Latvia (%)
Place of birth for the foreign-born population - Lithuania (%)
Place of birth for the foreign-born population - North Macedonia (Macedonia) (%)
Place of birth for the foreign-born population - Moldova (%)
Place of birth for the foreign-born population - Poland (%)
Place of birth for the foreign-born population - Romania (%)
Place of birth for the foreign-born population - Russia (%)
Place of birth for the foreign-born population - Serbia (%)
Place of birth for the foreign-born population - Ukraine (%)
Place of birth for the foreign-born population - Other Eastern Europe (%)
Place of birth for the foreign-born population - China (%)
Place of birth for the foreign-born population - Hong Kong (%)
Place of birth for the foreign-born population - Taiwan (%)
Place of birth for the foreign-born population - Japan (%)
Place of birth for the foreign-born population - Korea (%)
Place of birth for the foreign-born population - Other Eastern Asia (%)
Place of birth for the foreign-born population - Afghanistan (%)
Place of birth for the foreign-born population - Bangladesh (%)
Place of birth for the foreign-born population - India (%)
Place of birth for the foreign-born population - Iran (%)
Place of birth for the foreign-born population - Kazakhstan (%)
Place of birth for the foreign-born population - Nepal (%)
Place of birth for the foreign-born population - Pakistan (%)
Place of birth for the foreign-born population - Sri Lanka (%)
Place of birth for the foreign-born population - Uzbekistan (%)
Place of birth for the foreign-born population - Other South Central Asia (%)
Place of birth for the foreign-born population - Burma (%)
Place of birth for the foreign-born population - Cambodia (%)
Place of birth for the foreign-born population - Indonesia (%)
Place of birth for the foreign-born population - Laos (%)
Place of birth for the foreign-born population - Malaysia (%)
Place of birth for the foreign-born population - Philippines (%)
Place of birth for the foreign-born population - Singapore (%)
Place of birth for the foreign-born population - Thailand (%)
Place of birth for the foreign-born population - Vietnam (%)
Place of birth for the foreign-born population - Other South Eastern Asia (%)
Place of birth for the foreign-born population - Armenia (%)
Place of birth for the foreign-born population - Iraq (%)
Place of birth for the foreign-born population - Israel (%)
Place of birth for the foreign-born population - Jordan (%)
Place of birth for the foreign-born population - Kuwait (%)
Place of birth for the foreign-born population - Lebanon (%)
Place of birth for the foreign-born population - Saudi Arabia (%)
Place of birth for the foreign-born population - Syria (%)
Place of birth for the foreign-born population - Turkey (%)
Place of birth for the foreign-born population - Yemen (%)
Place of birth for the foreign-born population - Other Western Asia (%)
Place of birth for the foreign-born population - Eritrea (%)
Place of birth for the foreign-born population - Ethiopia (%)
Place of birth for the foreign-born population - Kenya (%)
Place of birth for the foreign-born population - Somalia (%)
Place of birth for the foreign-born population - Uganda (%)
Place of birth for the foreign-born population - Zimbabwe (%)
Place of birth for the foreign-born population - Other Eastern Africa (%)
Place of birth for the foreign-born population - Cameroon (%)
Place of birth for the foreign-born population - Congo (%)
Place of birth for the foreign-born population - Democratic Republic of Congo (Zaire) (%)
Place of birth for the foreign-born population - Other Middle Africa (%)
Place of birth for the foreign-born population - Egypt (%)
Place of birth for the foreign-born population - Morocco (%)
Place of birth for the foreign-born population - Sudan (%)
Place of birth for the foreign-born population - Other Northern Africa (%)
Place of birth for the foreign-born population - South Africa (%)
Place of birth for the foreign-born population - Other Southern Africa (%)
Place of birth for the foreign-born population - Cabo Verde (%)
Place of birth for the foreign-born population - Ghana (%)
Place of birth for the foreign-born population - Liberia (%)
Place of birth for the foreign-born population - Nigeria (%)
Place of birth for the foreign-born population - Senegal (%)
Place of birth for the foreign-born population - Sierra Leone (%)
Place of birth for the foreign-born population - Other Western Africa (%)
Place of birth for the foreign-born population - Australia (%)
Place of birth for the foreign-born population - New Zealand (%)
Place of birth for the foreign-born population - Fiji (%)
Place of birth for the foreign-born population - Micronesia (%)
Place of birth for the foreign-born population - Bahamas (%)
Place of birth for the foreign-born population - Barbados (%)
Place of birth for the foreign-born population - Cuba (%)
Place of birth for the foreign-born population - Dominica (%)
Place of birth for the foreign-born population - Dominican Republic (%)
Place of birth for the foreign-born population - Grenada (%)
Place of birth for the foreign-born population - Haiti (%)
Place of birth for the foreign-born population - Jamaica (%)
Place of birth for the foreign-born population - St. Vincent and the Grenadines (%)
Place of birth for the foreign-born population - Trinidad and Tobago (%)
Place of birth for the foreign-born population - West Indies (%)
Place of birth for the foreign-born population - Other Caribbean (%)
Place of birth for the foreign-born population - Belize (%)
Place of birth for the foreign-born population - Costa Rica (%)
Place of birth for the foreign-born population - El Salvador (%)
Place of birth for the foreign-born population - Guatemala (%)
Place of birth for the foreign-born population - Honduras (%)
Place of birth for the foreign-born population - Mexico (%)
Place of birth for the foreign-born population - Nicaragua (%)
Place of birth for the foreign-born population - Panama (%)
Place of birth for the foreign-born population - Other Central America (%)
Place of birth for the foreign-born population - Argentina (%)
Place of birth for the foreign-born population - Bolivia (%)
Place of birth for the foreign-born population - Brazil (%)
Place of birth for the foreign-born population - Chile (%)
Place of birth for the foreign-born population - Colombia (%)
Place of birth for the foreign-born population - Ecuador (%)
Place of birth for the foreign-born population - Guyana (%)
Place of birth for the foreign-born population - Peru (%)
Place of birth for the foreign-born population - Uruguay (%)
Place of birth for the foreign-born population - Venezuela (%)
Place of birth for the foreign-born population - Other South America (%)
Place of birth for the foreign-born population - Canada (%)
Place of birth for the foreign-born population - Other Northern America (%)
Place of birth for the foreign-born population - Other (%)
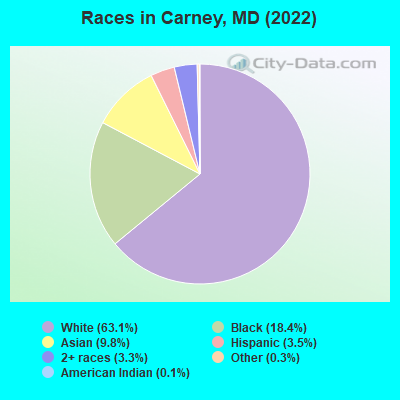
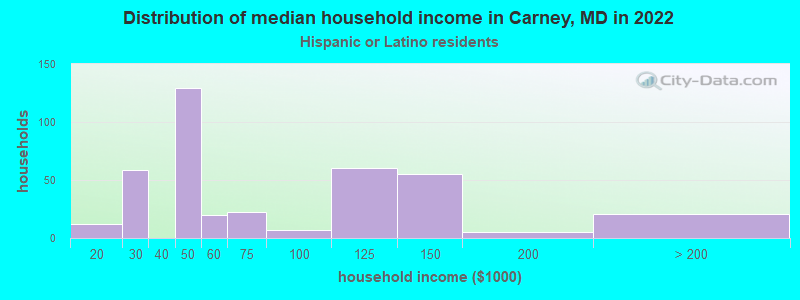
According to 2022 data, the most numerous races in Carney, MD are White alone (18,408 residents), Black alone (5,380 residents), and Hispanic (1,012 residents). 84.5% of Carney residents speak English at home. 15.3% of Carney, MD residents are foreign-born (8.0% born in Asia, 3.5% born in Africa, 1.9% born in Europe), which is 4.9% less than the foreign-born rate of 16.0% across the entire state of Maryland.
Race distribution in Carney
2000 2022
3,286,547 62.1% White alone 1,464,735 27.7% Black alone 227,916 4.3% Hispanic 209,738 4.0% Asian alone 82,946 1.6% Two or more races 13,312 0.3% American Indian alone 9,379 0.2% Other race alone 1,913 0.04% Native Hawaiian and Other
2,906,492 47.1% White alone 1,800,914 29.2% Black alone 705,842 11.4% Hispanic 401,818 6.5% Asian alone 291,317 4.7% Two or more races 46,930 0.8% Other race alone 8,930 0.1% American Indian alone 2,417 0.04% Native Hawaiian and Other
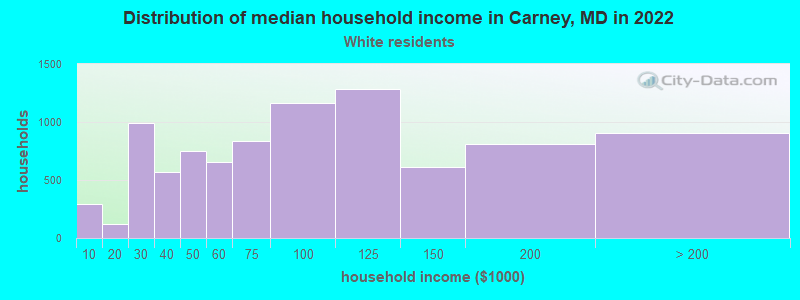
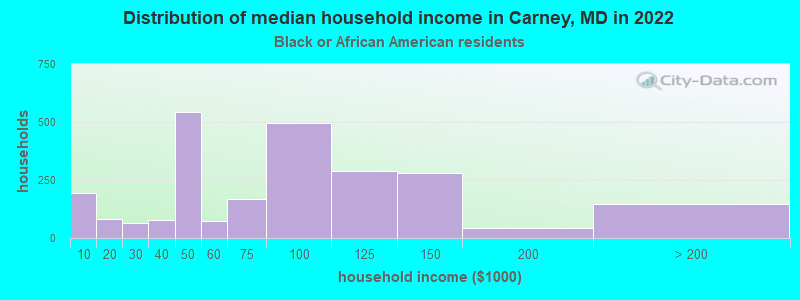
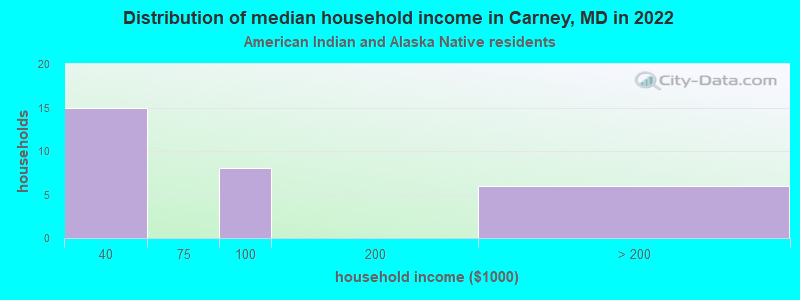
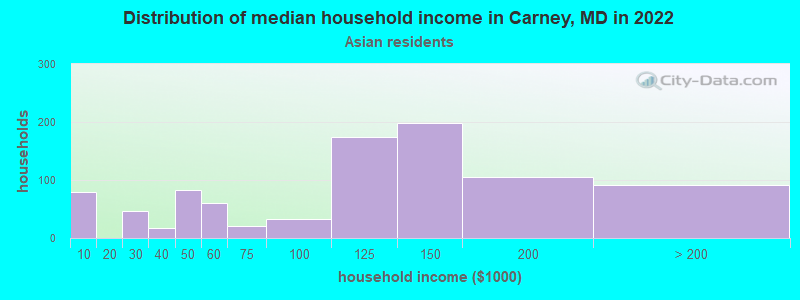
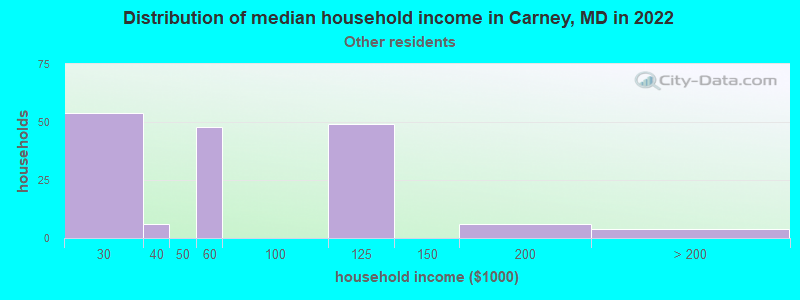
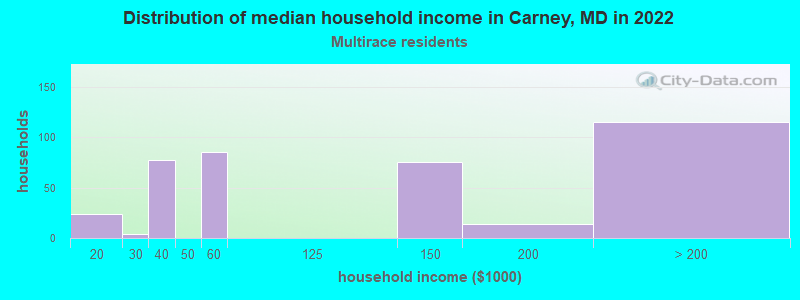
Income and house value in Carney Median household income in 2022 $78,287 White non-Hispanic householders$76,280 Black householders$85,821 American Indian and Alaska Native householders$115,288 Asian householdersMedian 2022 house value $302,492 White Non-Hispanic householders$313,260 Black or African American householders$84,923 American Indian or Alaska Native householders $326,965 Asian householders$397,694 Some other race householders$228,827 Two or more races householders$376,402 Hispanic or Latino householders
Median age by race in Carney
49.1 Median age for White residents44.3 55.3 27.8 Median age for Black or African American residents27.0 27.6 43.1 Median age for American Indian / Alaska Native residents48.3 59.3 36.5 Median age for Asian residents32.1 39.0 -1,541,125,539.6 Median age for Native Hawaiian / Pacific Islander residents-790,901,136.6 -760,942,760.2 26.4 Median age for Other race residents31.9 25.3 15.0 Median age for Two or more races residents5.0 24.9 48.8 Median age for White alone residents43.7 56.3 27.6 Median age for Hispanic or Latino residents30.7 22.7
Owner/renter occupied households by race in Carney
House owners and renters - White residents 5,950 66.5% Owner occupied3,001 33.5% Renter occupiedHouse owners and renters - Black or African American residents 695 31.2% Owner occupied1,535 68.8% Renter occupiedHouse owners and renters - American Indian / Alaska Native residents 19 55.2% Owner occupied15 44.8% Renter occupiedHouse owners and renters - Asian residents 617 68.1% Owner occupied289 31.9% Renter occupiedHouse owners and renters - Other race residents 143 71.0% Owner occupied59 29.0% Renter occupiedHouse owners and renters - Two or more races residents 245 64.2% Owner occupied137 35.8% Renter occupiedHouse owners and renters - White alone residents 5,721 65.4% Owner occupied3,029 34.6% Renter occupiedHouse owners and renters - Hispanic or Latino residents 454 90.6% Owner occupied47 9.4% Renter occupied
Language usage in Carney
English speakers - Total 84.5% of residents of Carney speak English at home.
1.6% of residents speak Spanish at home 349 76.5% Speak English very well107 23.5% Speak English less than very well13.9% of residents speak other language at home 2,400 62.5% Speak English very well1,443 37.5% Speak English less than very well
English speakers - Born in the United States 96.8% of residents of Carney speak English at home.
1.7% of residents speak Spanish at home 88 100.0% Speak English very well2.1% of residents speak other language at home 105 98.1% Speak English very well2 1.9% Speak English less than very well
English speakers - Native, born elsewhere 97.5% of residents of Carney speak English at home.
10.1% of residents speak other language at home 24 100.0% Speak English very well
English speakers - Foreign-born 21.3% of residents of Carney speak English at home.
3.6% of residents speak Spanish at home 86 54.1% Speak English very well73 45.9% Speak English less than very well73.8% of residents speak other language at home 1,847 56.6% Speak English very well1,416 43.4% Speak English less than very well
White (Caucasian) - Speak only English Native:
97.6% (16,800)Foreign-born:
12.8% (116)
White (Caucasian) - Speak another language Native:
2.4% (416)Foreign-born:
85.9% (779)
Black or African American - Speak only English Native:
100.0% (3,927)Foreign-born:
29.0% (290)
Black or African American - Speak another language Native:
0.2% (9)Foreign-born:
65.5% (656)
American Indian / Alaska Native - Speak only English Native:
80.3% (41)Foreign-born:
42.1% (3)
Asian - Speak only English Native:
39.0% (211)Foreign-born:
22.3% (489)
Asian - Speak another language Native:
60.9% (330)Foreign-born:
79.0% (1,736)
Other race - Speak another language Native:
19.7% (67)Foreign-born:
100.0% (54)
Two or more races - Speak only English Native:
100.0% (764)Foreign-born:
29.8% (14)
Two or more races - Speak another language Native:
0.8% (6)Foreign-born:
65.0% (30)
White alone - Speak only English Native:
97.6% (16,652)Foreign-born:
12.2% (111)
White alone - Speak another language Native:
2.3% (397)Foreign-born:
88.7% (807)
Hispanic or Latino - Speak only English Native:
86.0% (497)Foreign-born:
2.4% (4)
Hispanic or Latino - Speak another language Native:
21.7% (125)Foreign-born:
97.6% (172)
Foreign-born residents in Carney 4,454 residents are foreign born (8.0% Asia , 3.5% Africa , 1.9% Europe ).
This city:
15.3%Maryland:
15.7%
Marital status for residents in Carney Marital status - White (Caucasian) population 15 years and over
Males 35.4% Never married50.0% Now married0.6% Separated6.9% Widowed7.1% DivorcedFemales 27.7% Never married41.2% Now married0.9% Separated20.4% Widowed9.8% DivorcedWomen who gave birth in the past 12 months Now married:
100.0% (47)Unmarried:
0.0% (0)
Women who did not give birth in the past 12 months Now married:
42.6% (1,458)Unmarried:
57.4% (1,966)
Marital status - Black or African American population 15 years and over
Males 50.9% Never married34.7% Now married0.0% Separated1.0% Widowed13.4% DivorcedFemales 62.9% Never married21.8% Now married2.0% Separated0.9% Widowed12.5% DivorcedWomen who gave birth in the past 12 months Now married:
0.0% (0)Unmarried:
100.0% (56)
Women who did not give birth in the past 12 months Now married:
24.6% (452)Unmarried:
75.4% (1,382)
Marital status - American Indian / Alaska Native population 15 years and over
Males 0.0% Never married58.8% Now married0.0% Separated0.0% Widowed41.2% DivorcedFemales 33.3% Never married25.0% Now married0.0% Separated0.0% Widowed41.7% DivorcedWomen who did not give birth in the past 12 months Now married:
0.0% (0)Unmarried:
100.0% (6)
Marital status - Asian population 15 years and over
Males 33.0% Never married62.7% Now married0.0% Separated2.0% Widowed2.3% DivorcedFemales 28.7% Never married62.0% Now married0.0% Separated5.4% Widowed3.9% DivorcedWomen who gave birth in the past 12 months Now married:
100.0% (6)Unmarried:
0.0% (0)
Women who did not give birth in the past 12 months Now married:
49.9% (384)Unmarried:
50.1% (386)
Marital status - Other race population 15 years and over
Males 27.0% Never married73.0% Now married0.0% Separated0.0% Widowed0.0% DivorcedFemales 9.8% Never married75.9% Now married0.0% Separated0.0% Widowed14.3% DivorcedWomen who gave birth in the past 12 months Now married:
100.0% (81)Unmarried:
0.0% (0)
Women who did not give birth in the past 12 months Now married:
73.5% (53)Unmarried:
26.5% (19)
Marital status - Two or more races population 15 years and over
Males 32.3% Never married59.6% Now married4.0% Separated0.0% Widowed4.0% DivorcedFemales 40.4% Never married50.1% Now married0.0% Separated9.4% Widowed0.0% DivorcedWomen who did not give birth in the past 12 months Now married:
34.9% (66)Unmarried:
65.1% (123)
Marital status - White alone, not Hispanic / Latino population 15 years and over
Males 35.9% Never married51.0% Now married0.6% Separated5.2% Widowed7.3% DivorcedFemales 27.8% Never married41.0% Now married0.9% Separated20.6% Widowed9.7% DivorcedWomen who gave birth in the past 12 months Now married:
100.0% (47)Unmarried:
0.0% (0)
Women who did not give birth in the past 12 months Now married:
42.3% (1,440)Unmarried:
57.7% (1,964)
Marital status - Hispanic or Latino population 15 years and over
Males 26.6% Never married36.0% Now married0.0% Separated36.5% Widowed1.0% DivorcedFemales 18.3% Never married77.2% Now married0.0% Separated0.0% Widowed4.5% DivorcedWomen who gave birth in the past 12 months Now married:
100.0% (59)Unmarried:
0.0% (0)
Women who did not give birth in the past 12 months Now married:
63.6% (95)Unmarried:
36.4% (55)
Ancestries in Carney
2,093 14.5% German803 5.6% Irish620 4.3% American561 3.9% Italian475 3.3% Ethiopian452 3.1% Nigerian407 2.8% English362 2.5% Polish311 2.2% European240 1.7% Greek222 1.5% Austrian183 1.3% Hungarian173 1.2% Kenyan163 1.1% African137 1.0% Iraqi130 0.9% French109 0.8% Swedish90 0.6% Albanian89 0.6% Russian83 0.6% Lithuanian66 0.5% Scottish60 0.4% Eastern European37 0.3% Bulgarian36 0.2% Czech36 0.2% Jamaican28 0.2% French Canadian27 0.2% Palestinian27 0.2% Norwegian23 0.2% Dutch22 0.2% Lebanese16 0.1% Guyanese14 0.10% Czechoslovakian14 0.10% Trinidadian and Tobagonian13 0.09% Slovak10 0.07% British9 0.06% Latvian8 0.06% Scotch-Irish4 0.03% Croatian3 0.02% Welsh2 0.01% Brazilian
Geographical mobility in Carney Same house 1 year ago 16,723 90.4% White (Caucasian)4,027 74.0% Black or African American27 41.8% American Indian / Alaska Native2,610 92.2% Asian383 98.3% Other race1,128 99.8% Two or more races16,636 90.7% White alone, not Hispanic / Latino781 88.7% Hispanic or LatinoMoved within same county 725 3.9% White / Caucasian1,077 19.8% Black or African American23 35.3% American Indian / Alaska Native143 5.1% Asian11 2.9% Other race13 1.1% Two or more races734 4.0% White alone, not Hispanic / Latino36 4.1% Hispanic or LatinoMoved within same state 737 4.0% White / Caucasian180 3.3% Black or African American20 30.4% American Indian / Alaska Native1 0.1% Two or more races657 3.6% White alone, not Hispanic / Latino83 9.4% Hispanic or LatinoMoved from different state 120 0.7% White / Caucasian111 2.0% Black or African American14 0.5% Asian22 1.9% Two or more races121 0.7% White alone, not Hispanic / LatinoMoved from abroad 169 0.9% White43 1.5% Asian167 0.9% White alone, not Hispanic / Latino
Children Nativity (place of birth) in Carney
Children under 6 years - Living with two parents Both parents native 633 100.0% NativeBoth parents foreign-born 357 100.0% NativeOne native, one foreign-born parent 73 100.0% NativeChildren under 6 years - Living with one parent Native parent 533 100.0% NativeForeign-born parent 123 100.0% NativeChildren 6 to 17 years - Living with two parents Both parents native 1,448 99.3% Native10 0.7% Foreign-bornBoth parents foreign-born 465 78.0% Native131 22.0% Foreign-bornOne native, one foreign-born parent 332 100.0% NativeChildren 6 to 17 years - Living with one parent Native parent 838 83.8% Native162 16.2% Foreign-bornForeign-born parent 444 75.3% Native145 24.7% Foreign-born
Grandparents responsible for own grandchildren in Carney
Grandparents (30 to 59 years) White / Caucasian 30 29.6% Responsible for grandchildren70 70.4% Not responsible for grandchildrenBlack or African American 21 100.0% Not responsible for grandchildrenWhite alone, not Hispanic / Latino 30 30.3% Responsible for grandchildren68 69.7% Not responsible for grandchildren
Grandparents (60 years and over) White / Caucasian 98 100.0% Not responsible for grandchildrenBlack or African American 2 3.9% Responsible for grandchildren55 96.1% Not responsible for grandchildrenWhite alone, not Hispanic / Latino 103 100.0% Not responsible for grandchildren