Races in Herndon, Virginia (VA) Detailed Stats
Data:
Races - White alone (%)
Races - White alone (% change since 2000)
Races - Black alone (%)
Races - Black alone (% change since 2000)
Races - American Indian alone (%)
Races - American Indian alone (% change since 2000)
Races - Asian alone (%)
Races - Asian alone (% change since 2000)
Races - Hispanic (%)
Races - Hispanic (% change since 2000)
Races - Native Hawaiian and Other Pacific Islander alone (%)
Races - Native Hawaiian and Other Pacific Islander alone (% change since 2000)
Races - Two or more races(%)
Races - Two or more races(% change since 2000)
Races - Other race alone (%)
Races - Other race alone (% change since 2000)
Racial diversity
Place of birth - Born in state of residence (%)
Place of birth - Born in state of residence (%) - White
Place of birth - Born in state of residence (%) - Black or African American
Place of birth - Born in state of residence (%) - Asian
Place of birth - Born in state of residence (%) - Hispanic or Latino
Place of birth - Born in state of residence (%) - American Indian and Alaska Native
Place of birth - Born in state of residence (%) - Multirace
Place of birth - Born in state of residence (%) - Other Race
Place of birth - Born in other state (%)
Place of birth - Born in other state (%) - White
Place of birth - Born in other state (%) - Black or African American
Place of birth - Born in other state (%) - Asian
Place of birth - Born in other state (%) - Hispanic or Latino
Place of birth - Born in other state (%) - American Indian and Alaska Native
Place of birth - Born in other state (%) - Multirace
Place of birth - Born in other state (%) - Other Race
Place of birth - Native, outside of US (%)
Place of birth - Native, outside of US (%) - White
Place of birth - Native, outside of US (%) - Black or African American
Place of birth - Native, outside of US (%) - Asian
Place of birth - Native, outside of US (%) - Hispanic or Latino
Place of birth - Native, outside of US (%) - American Indian and Alaska Native
Place of birth - Native, outside of US (%) - Multirace
Place of birth - Native, outside of US (%) - Other Race
Place of birth - Foreign born (%)
Place of birth - Foreign born (%) - White
Place of birth - Foreign born (%) - Black or African American
Place of birth - Foreign born (%) - Asian
Place of birth - Foreign born (%) - Hispanic or Latino
Place of birth - Foreign born (%) - American Indian and Alaska Native
Place of birth - Foreign born (%) - Multirace
Place of birth - Foreign born (%) - Other Race
Residents speaking English at home (%)
Residents speaking English at home - Born in the United States (%)
Residents speaking English at home - Native, born elsewhere (%)
Residents speaking English at home - Foreign born (%)
Residents speaking Spanish at home (%)
Residents speaking Spanish at home - Born in the United States (%)
Residents speaking Spanish at home - Native, born elsewhere (%)
Residents speaking Spanish at home - Foreign born (%)
Residents speaking other language at home (%)
Residents speaking other language at home - Born in the United States (%)
Residents speaking other language at home - Native, born elsewhere (%)
Residents speaking other language at home - Foreign born (%)
Marital status - Never married (%)
Marital status - Now married (%)
Marital status - Separated (%)
Marital status - Widowed (%)
Marital status - Divorced (%)
Ancestries Reported - Arab (%)
Ancestries Reported - Czech (%)
Ancestries Reported - Danish (%)
Ancestries Reported - Dutch (%)
Ancestries Reported - English (%)
Ancestries Reported - French (%)
Ancestries Reported - French Canadian (%)
Ancestries Reported - German (%)
Ancestries Reported - Greek (%)
Ancestries Reported - Hungarian (%)
Ancestries Reported - Irish (%)
Ancestries Reported - Italian (%)
Ancestries Reported - Lithuanian (%)
Ancestries Reported - Norwegian (%)
Ancestries Reported - Polish (%)
Ancestries Reported - Portuguese (%)
Ancestries Reported - Russian (%)
Ancestries Reported - Scotch-Irish (%)
Ancestries Reported - Scottish (%)
Ancestries Reported - Slovak (%)
Ancestries Reported - Subsaharan African (%)
Ancestries Reported - Swedish (%)
Ancestries Reported - Swiss (%)
Ancestries Reported - Ukrainian (%)
Ancestries Reported - United States (%)
Ancestries Reported - Welsh (%)
Ancestries Reported - West Indian (%)
Ancestries Reported - Other (%)
Geographical mobility - Same house 1 year ago (%)
Geographical mobility - Same house 1 year ago (%) - White
Geographical mobility - Same house 1 year ago (%) - Black or African American
Geographical mobility - Same house 1 year ago (%) - Asian
Geographical mobility - Same house 1 year ago (%) - Hispanic or Latino
Geographical mobility - Same house 1 year ago (%) - American Indian and Alaska Native
Geographical mobility - Same house 1 year ago (%) - Multirace
Geographical mobility - Same house 1 year ago (%) - Other Race
Geographical mobility - Moved within same county (%)
Geographical mobility - Moved within same county (%) - White
Geographical mobility - Moved within same county (%) - Black or African American
Geographical mobility - Moved within same county (%) - Asian
Geographical mobility - Moved within same county (%) - Hispanic or Latino
Geographical mobility - Moved within same county (%) - American Indian and Alaska Native
Geographical mobility - Moved within same county (%) - Multirace
Geographical mobility - Moved within same county (%) - Other Race
Geographical mobility - Moved from different county within same state (%)
Geographical mobility - Moved from different county within same state (%) - White
Geographical mobility - Moved from different county within same state (%) - Black or African American
Geographical mobility - Moved from different county within same state (%) - Asian
Geographical mobility - Moved from different county within same state (%) - Hispanic or Latino
Geographical mobility - Moved from different county within same state (%) - American Indian and Alaska Native
Geographical mobility - Moved from different county within same state (%) - Multirace
Geographical mobility - Moved from different county within same state (%) - Other Race
Geographical mobility - Moved from different state (%)
Geographical mobility - Moved from different state (%) - White
Geographical mobility - Moved from different state (%) - Black or African American
Geographical mobility - Moved from different state (%) - Asian
Geographical mobility - Moved from different state (%) - Hispanic or Latino
Geographical mobility - Moved from different state (%) - American Indian and Alaska Native
Geographical mobility - Moved from different state (%) - Multirace
Geographical mobility - Moved from different state (%) - Other Race
Geographical mobility - Moved from abroad (%)
Geographical mobility - Moved from abroad (%) - White
Geographical mobility - Moved from abroad (%) - Black or African American
Geographical mobility - Moved from abroad (%) - Asian
Geographical mobility - Moved from abroad (%) - Hispanic or Latino
Geographical mobility - Moved from abroad (%) - American Indian and Alaska Native
Geographical mobility - Moved from abroad (%) - Multirace
Geographical mobility - Moved from abroad (%) - Other Race
Place of birth for the foreign-born population - Ireland (%)
Place of birth for the foreign-born population - Denmark (%)
Place of birth for the foreign-born population - Norway (%)
Place of birth for the foreign-born population - Sweden (%)
Place of birth for the foreign-born population - United Kingdom (%)
Place of birth for the foreign-born population - England (%)
Place of birth for the foreign-born population - Scotland (%)
Place of birth for the foreign-born population - Other Northern Europe (%)
Place of birth for the foreign-born population - Austria (%)
Place of birth for the foreign-born population - Belgium (%)
Place of birth for the foreign-born population - France (%)
Place of birth for the foreign-born population - Germany (%)
Place of birth for the foreign-born population - Netherlands (%)
Place of birth for the foreign-born population - Switzerland (%)
Place of birth for the foreign-born population - Other Western Europe (%)
Place of birth for the foreign-born population - Greece (%)
Place of birth for the foreign-born population - Italy (%)
Place of birth for the foreign-born population - Portugal (%)
Place of birth for the foreign-born population - Spain (%)
Place of birth for the foreign-born population - Other Southern Europe (%)
Place of birth for the foreign-born population - Albania (%)
Place of birth for the foreign-born population - Belarus (%)
Place of birth for the foreign-born population - Bosnia and Herzegovina (%)
Place of birth for the foreign-born population - Bulgaria (%)
Place of birth for the foreign-born population - Croatia (%)
Place of birth for the foreign-born population - Czechoslovakia (%)
Place of birth for the foreign-born population - Hungary (%)
Place of birth for the foreign-born population - Latvia (%)
Place of birth for the foreign-born population - Lithuania (%)
Place of birth for the foreign-born population - North Macedonia (Macedonia) (%)
Place of birth for the foreign-born population - Moldova (%)
Place of birth for the foreign-born population - Poland (%)
Place of birth for the foreign-born population - Romania (%)
Place of birth for the foreign-born population - Russia (%)
Place of birth for the foreign-born population - Serbia (%)
Place of birth for the foreign-born population - Ukraine (%)
Place of birth for the foreign-born population - Other Eastern Europe (%)
Place of birth for the foreign-born population - China (%)
Place of birth for the foreign-born population - Hong Kong (%)
Place of birth for the foreign-born population - Taiwan (%)
Place of birth for the foreign-born population - Japan (%)
Place of birth for the foreign-born population - Korea (%)
Place of birth for the foreign-born population - Other Eastern Asia (%)
Place of birth for the foreign-born population - Afghanistan (%)
Place of birth for the foreign-born population - Bangladesh (%)
Place of birth for the foreign-born population - India (%)
Place of birth for the foreign-born population - Iran (%)
Place of birth for the foreign-born population - Kazakhstan (%)
Place of birth for the foreign-born population - Nepal (%)
Place of birth for the foreign-born population - Pakistan (%)
Place of birth for the foreign-born population - Sri Lanka (%)
Place of birth for the foreign-born population - Uzbekistan (%)
Place of birth for the foreign-born population - Other South Central Asia (%)
Place of birth for the foreign-born population - Burma (%)
Place of birth for the foreign-born population - Cambodia (%)
Place of birth for the foreign-born population - Indonesia (%)
Place of birth for the foreign-born population - Laos (%)
Place of birth for the foreign-born population - Malaysia (%)
Place of birth for the foreign-born population - Philippines (%)
Place of birth for the foreign-born population - Singapore (%)
Place of birth for the foreign-born population - Thailand (%)
Place of birth for the foreign-born population - Vietnam (%)
Place of birth for the foreign-born population - Other South Eastern Asia (%)
Place of birth for the foreign-born population - Armenia (%)
Place of birth for the foreign-born population - Iraq (%)
Place of birth for the foreign-born population - Israel (%)
Place of birth for the foreign-born population - Jordan (%)
Place of birth for the foreign-born population - Kuwait (%)
Place of birth for the foreign-born population - Lebanon (%)
Place of birth for the foreign-born population - Saudi Arabia (%)
Place of birth for the foreign-born population - Syria (%)
Place of birth for the foreign-born population - Turkey (%)
Place of birth for the foreign-born population - Yemen (%)
Place of birth for the foreign-born population - Other Western Asia (%)
Place of birth for the foreign-born population - Eritrea (%)
Place of birth for the foreign-born population - Ethiopia (%)
Place of birth for the foreign-born population - Kenya (%)
Place of birth for the foreign-born population - Somalia (%)
Place of birth for the foreign-born population - Uganda (%)
Place of birth for the foreign-born population - Zimbabwe (%)
Place of birth for the foreign-born population - Other Eastern Africa (%)
Place of birth for the foreign-born population - Cameroon (%)
Place of birth for the foreign-born population - Congo (%)
Place of birth for the foreign-born population - Democratic Republic of Congo (Zaire) (%)
Place of birth for the foreign-born population - Other Middle Africa (%)
Place of birth for the foreign-born population - Egypt (%)
Place of birth for the foreign-born population - Morocco (%)
Place of birth for the foreign-born population - Sudan (%)
Place of birth for the foreign-born population - Other Northern Africa (%)
Place of birth for the foreign-born population - South Africa (%)
Place of birth for the foreign-born population - Other Southern Africa (%)
Place of birth for the foreign-born population - Cabo Verde (%)
Place of birth for the foreign-born population - Ghana (%)
Place of birth for the foreign-born population - Liberia (%)
Place of birth for the foreign-born population - Nigeria (%)
Place of birth for the foreign-born population - Senegal (%)
Place of birth for the foreign-born population - Sierra Leone (%)
Place of birth for the foreign-born population - Other Western Africa (%)
Place of birth for the foreign-born population - Australia (%)
Place of birth for the foreign-born population - New Zealand (%)
Place of birth for the foreign-born population - Fiji (%)
Place of birth for the foreign-born population - Micronesia (%)
Place of birth for the foreign-born population - Bahamas (%)
Place of birth for the foreign-born population - Barbados (%)
Place of birth for the foreign-born population - Cuba (%)
Place of birth for the foreign-born population - Dominica (%)
Place of birth for the foreign-born population - Dominican Republic (%)
Place of birth for the foreign-born population - Grenada (%)
Place of birth for the foreign-born population - Haiti (%)
Place of birth for the foreign-born population - Jamaica (%)
Place of birth for the foreign-born population - St. Vincent and the Grenadines (%)
Place of birth for the foreign-born population - Trinidad and Tobago (%)
Place of birth for the foreign-born population - West Indies (%)
Place of birth for the foreign-born population - Other Caribbean (%)
Place of birth for the foreign-born population - Belize (%)
Place of birth for the foreign-born population - Costa Rica (%)
Place of birth for the foreign-born population - El Salvador (%)
Place of birth for the foreign-born population - Guatemala (%)
Place of birth for the foreign-born population - Honduras (%)
Place of birth for the foreign-born population - Mexico (%)
Place of birth for the foreign-born population - Nicaragua (%)
Place of birth for the foreign-born population - Panama (%)
Place of birth for the foreign-born population - Other Central America (%)
Place of birth for the foreign-born population - Argentina (%)
Place of birth for the foreign-born population - Bolivia (%)
Place of birth for the foreign-born population - Brazil (%)
Place of birth for the foreign-born population - Chile (%)
Place of birth for the foreign-born population - Colombia (%)
Place of birth for the foreign-born population - Ecuador (%)
Place of birth for the foreign-born population - Guyana (%)
Place of birth for the foreign-born population - Peru (%)
Place of birth for the foreign-born population - Uruguay (%)
Place of birth for the foreign-born population - Venezuela (%)
Place of birth for the foreign-born population - Other South America (%)
Place of birth for the foreign-born population - Canada (%)
Place of birth for the foreign-born population - Other Northern America (%)
Place of birth for the foreign-born population - Other (%)
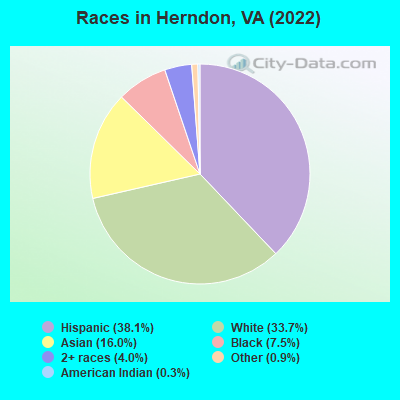
According to 2022 data, the most numerous races in Herndon, VA are White alone (8,189 residents), Black alone (1,832 residents), and Hispanic (9,255 residents). 46.9% of Herndon residents speak English at home. 41.9% of Herndon, VA residents are foreign-born (24.0% born in Latin America, 12.9% born in Asia), which is 71.4% greater than the foreign-born rate of 12.0% across the entire state of Virginia.
Race distribution in Herndon
2000 2022
4,965,637 70.2% White alone 1,376,378 19.4% Black alone 329,540 4.7% Hispanic 259,277 3.7% Asian alone 114,022 1.6% Two or more races 18,596 0.3% American Indian alone 11,685 0.2% Other race alone 3,380 0.05% Native Hawaiian and Other
5,095,130 58.7% White alone 1,594,785 18.4% Black alone 905,750 10.4% Hispanic 602,881 6.9% Asian alone 406,047 4.7% Two or more races 60,419 0.7% Other race alone 11,738 0.1% American Indian alone 6,869 0.08% Native Hawaiian and Other
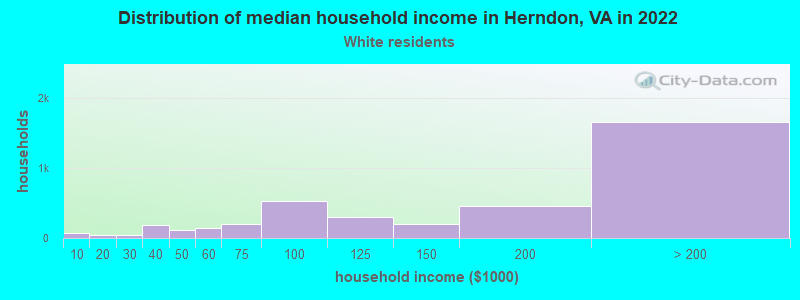
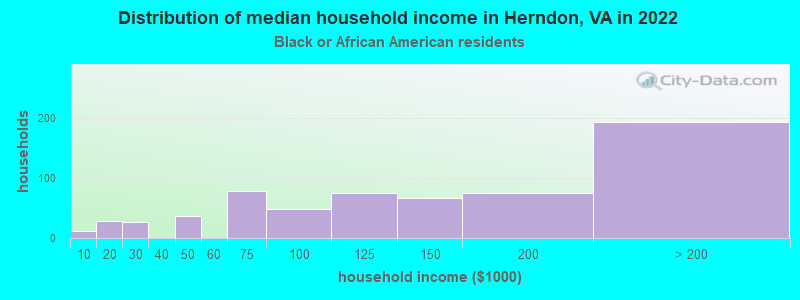
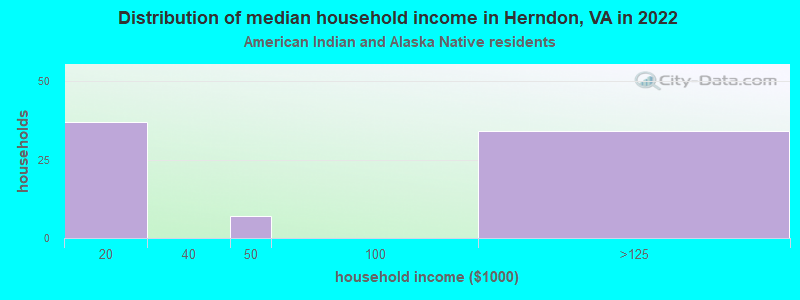
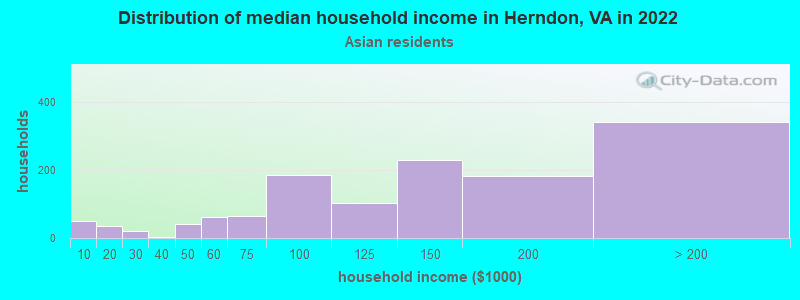
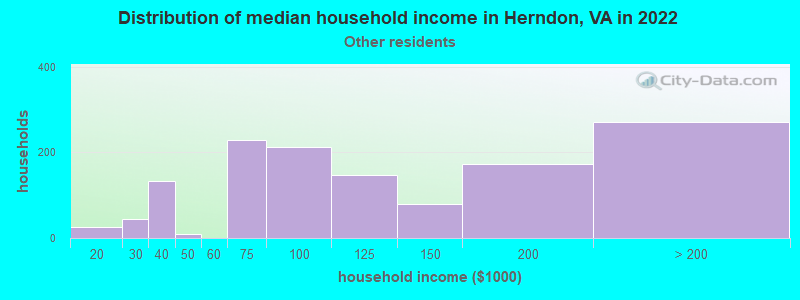
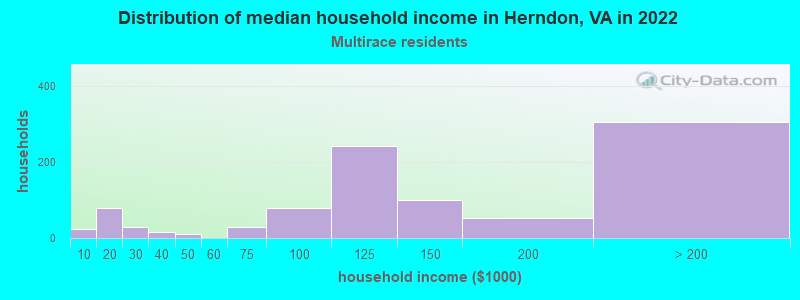
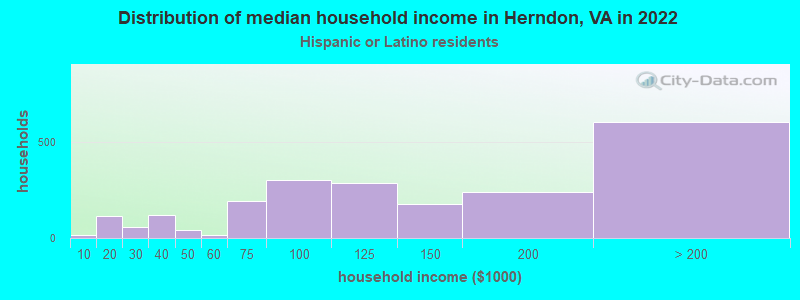
Income and house value in Herndon Median household income in 2022 $166,186 White non-Hispanic householders$121,036 Black householders$124,964 Asian householders$109,766 Some other race householders$123,153 Two or more races householders$114,445 Hispanic or Latino race householdersMedian 2022 house value $613,724 White Non-Hispanic householders$508,157 Black or African American householdersover $1,000,000 American Indian or Alaska Native householders $542,826 Asian householders$415,708 Some other race householders$592,174 Two or more races householders$443,506 Hispanic or Latino householders
Median age by race in Herndon
40.4 Median age for White residents40.2 40.5 41.2 Median age for Black or African American residents34.5 46.7 29.0 Median age for American Indian / Alaska Native residents44.3 25.2 39.8 Median age for Asian residents37.0 42.8 -666,666,666.0 Median age for Native Hawaiian / Pacific Islander residents-558,791,801.0 -584,518,166.9 25.9 Median age for Other race residents27.2 25.2 28.5 Median age for Two or more races residents31.9 25.6 41.0 Median age for White alone residents40.6 41.1 28.4 Median age for Hispanic or Latino residents29.2 25.6
Owner/renter occupied households by race in Herndon
House owners and renters - White residents 2,835 71.8% Owner occupied1,111 28.2% Renter occupiedHouse owners and renters - Black or African American residents 320 52.1% Owner occupied294 47.9% Renter occupiedHouse owners and renters - American Indian / Alaska Native residents 48 52.6% Owner occupied43 47.4% Renter occupiedHouse owners and renters - Asian residents 968 74.1% Owner occupied339 25.9% Renter occupiedHouse owners and renters - Other race residents 607 45.2% Owner occupied734 54.8% Renter occupiedHouse owners and renters - Two or more races residents 489 48.0% Owner occupied530 52.0% Renter occupiedHouse owners and renters - White alone residents 2,569 71.9% Owner occupied1,003 28.1% Renter occupiedHouse owners and renters - Hispanic or Latino residents 1,047 48.1% Owner occupied1,129 51.9% Renter occupied
Language usage in Herndon
English speakers - Total 46.9% of residents of Herndon speak English at home.
31.7% of residents speak Spanish at home 2,749 38.4% Speak English very well4,415 61.6% Speak English less than very well21.0% of residents speak other language at home 3,137 65.9% Speak English very well1,621 34.1% Speak English less than very well
English speakers - Born in the United States 89.9% of residents of Herndon speak English at home.
5.8% of residents speak Spanish at home 197 53.5% Speak English very well171 46.5% Speak English less than very well5.0% of residents speak other language at home 291 90.9% Speak English very well29 9.1% Speak English less than very well
English speakers - Native, born elsewhere 45.4% of residents of Herndon speak English at home.
21.8% of residents speak Spanish at home 107 92.2% Speak English very well9 7.8% Speak English less than very well33.5% of residents speak other language at home 160 89.9% Speak English very well18 10.1% Speak English less than very well
English speakers - Foreign-born 9.3% of residents of Herndon speak English at home.
54.0% of residents speak Spanish at home 1,381 25.8% Speak English very well3,972 74.2% Speak English less than very well36.5% of residents speak other language at home 2,094 57.9% Speak English very well1,523 42.1% Speak English less than very well
White (Caucasian) - Speak only English Native:
88.5% (6,646)Foreign-born:
19.5% (270)
White (Caucasian) - Speak another language Native:
10.1% (758)Foreign-born:
78.3% (1,081)
Black or African American - Speak only English Native:
90.2% (991)Foreign-born:
30.5% (194)
Black or African American - Speak another language Native:
9.4% (103)Foreign-born:
71.0% (451)
Asian - Speak only English Native:
46.8% (434)Foreign-born:
9.8% (281)
Asian - Speak another language Native:
53.5% (496)Foreign-born:
89.7% (2,580)
Other race - Speak only English Native:
45.0% (819)Foreign-born:
4.7% (180)
Other race - Speak another language Native:
55.5% (1,011)Foreign-born:
94.5% (3,634)
Two or more races - Speak only English Native:
61.2% (974)Foreign-born:
1.3% (24)
Two or more races - Speak another language Native:
39.7% (632)Foreign-born:
98.8% (1,785)
White alone - Speak only English Native:
91.1% (6,456)Foreign-born:
39.8% (292)
White alone - Speak another language Native:
8.5% (601)Foreign-born:
61.9% (455)
Hispanic or Latino - Speak only English Native:
41.3% (1,173)Foreign-born:
2.2% (119)
Hispanic or Latino - Speak another language Native:
57.7% (1,641)Foreign-born:
97.8% (5,347)
Foreign-born residents in Herndon 10,188 residents are foreign born (24.0% Latin America , 12.9% Asia ).
This city:
41.9%Virginia:
12.6%
Marital status for residents in Herndon Marital status - White (Caucasian) population 15 years and over
Males 32.2% Never married56.6% Now married0.7% Separated1.7% Widowed8.8% DivorcedFemales 26.2% Never married56.4% Now married3.0% Separated3.1% Widowed11.3% DivorcedWomen who gave birth in the past 12 months Now married:
81.3% (135)Unmarried:
18.7% (31)
Women who did not give birth in the past 12 months Now married:
50.2% (992)Unmarried:
49.8% (983)
Marital status - Black or African American population 15 years and over
Males 38.6% Never married47.9% Now married2.5% Separated1.8% Widowed9.2% DivorcedFemales 21.0% Never married61.1% Now married4.3% Separated3.1% Widowed10.6% DivorcedWomen who did not give birth in the past 12 months Now married:
70.5% (206)Unmarried:
29.5% (86)
Marital status - American Indian / Alaska Native population 15 years and over
Males 17.6% Never married11.8% Now married0.0% Separated0.0% Widowed70.6% DivorcedFemales 3.0% Never married97.0% Now married0.0% Separated0.0% Widowed0.0% DivorcedWomen who gave birth in the past 12 months Now married:
100.0% (7)Unmarried:
0.0% (0)
Women who did not give birth in the past 12 months Now married:
96.0% (26)Unmarried:
4.0% (1)
Marital status - Asian population 15 years and over
Males 37.5% Never married55.3% Now married0.6% Separated2.7% Widowed3.9% DivorcedFemales 19.6% Never married68.5% Now married0.0% Separated7.9% Widowed4.0% DivorcedWomen who gave birth in the past 12 months Now married:
100.0% (24)Unmarried:
0.0% (0)
Women who did not give birth in the past 12 months Now married:
67.7% (685)Unmarried:
32.3% (328)
Marital status - Other race population 15 years and over
Males 56.4% Never married39.4% Now married2.1% Separated0.1% Widowed2.0% DivorcedFemales 48.1% Never married47.8% Now married0.5% Separated0.4% Widowed3.1% DivorcedWomen who gave birth in the past 12 months Now married:
0.0% (0)Unmarried:
100.0% (43)
Women who did not give birth in the past 12 months Now married:
41.5% (683)Unmarried:
58.5% (962)
Marital status - Two or more races population 15 years and over
Males 48.5% Never married48.9% Now married0.0% Separated0.0% Widowed2.6% DivorcedFemales 44.9% Never married48.7% Now married0.0% Separated0.0% Widowed6.4% DivorcedWomen who gave birth in the past 12 months Now married:
100.0% (21)Unmarried:
0.0% (0)
Women who did not give birth in the past 12 months Now married:
42.7% (362)Unmarried:
57.3% (487)
Marital status - White alone, not Hispanic / Latino population 15 years and over
Males 31.1% Never married56.6% Now married0.6% Separated2.1% Widowed9.7% DivorcedFemales 24.4% Never married56.0% Now married3.2% Separated3.3% Widowed13.1% DivorcedWomen who gave birth in the past 12 months Now married:
100.0% (142)Unmarried:
0.0% (0)
Women who did not give birth in the past 12 months Now married:
51.7% (882)Unmarried:
48.3% (824)
Marital status - Hispanic or Latino population 15 years and over
Males 49.9% Never married46.4% Now married1.5% Separated0.0% Widowed2.2% DivorcedFemales 43.4% Never married51.9% Now married0.8% Separated0.8% Widowed3.1% DivorcedWomen who gave birth in the past 12 months Now married:
29.3% (29)Unmarried:
70.7% (70)
Women who did not give birth in the past 12 months Now married:
43.2% (949)Unmarried:
56.8% (1,247)
Ancestries in Herndon
604 3.9% Irish467 3.1% American458 3.0% German401 2.6% English239 1.6% Italian230 1.5% European161 1.1% Armenian157 1.0% Ethiopian126 0.8% Polish110 0.7% Russian110 0.7% French Canadian93 0.6% Romanian91 0.6% Swedish91 0.6% Sudanese83 0.5% Afghan65 0.4% African62 0.4% Nigerian57 0.4% Eastern European53 0.3% Scotch-Irish51 0.3% British42 0.3% Egyptian42 0.3% Yugoslavian41 0.3% Dutch41 0.3% Jamaican38 0.2% Syrian38 0.2% Danish33 0.2% Iranian33 0.2% British West Indian25 0.2% Trinidadian and Tobagonian25 0.2% Ukrainian22 0.1% Lebanese21 0.1% Iraqi19 0.1% Northern European19 0.1% Greek14 0.09% Hungarian14 0.09% Arab14 0.09% Barbadian12 0.08% French9 0.06% Belgian9 0.06% Lithuanian9 0.06% Slovak9 0.06% Slovene8 0.05% Israeli7 0.05% Norwegian7 0.05% Scottish7 0.05% Turkish6 0.04% Welsh5 0.03% Czech4 0.03% Brazilian3 0.02% Bulgarian
Geographical mobility in Herndon Same house 1 year ago 8,180 87.5% White (Caucasian)1,558 85.2% Black or African American159 96.1% American Indian / Alaska Native3,308 84.8% Asian5,202 81.1% Other race2,719 73.0% Two or more races7,281 90.2% White alone, not Hispanic / Latino6,849 74.5% Hispanic or LatinoMoved within same county 666 7.1% White / Caucasian65 3.6% Black or African American335 8.6% Asian485 7.6% Other race961 25.8% Two or more races420 5.2% White alone, not Hispanic / Latino1,638 17.8% Hispanic or LatinoMoved within same state 152 1.6% White / Caucasian41 2.2% Black or African American63 1.6% Asian352 5.5% Other race2 0.1% Two or more races99 1.2% White alone, not Hispanic / Latino395 4.3% Hispanic or LatinoMoved from different state 200 2.1% White / Caucasian48 2.7% Black or African American80 2.1% Asian181 2.8% Other race156 4.2% Two or more races167 2.1% White alone, not Hispanic / Latino358 3.9% Hispanic or LatinoMoved from abroad 114 1.2% White89 4.9% Black or African American134 3.4% Asian13 0.2% Other race26 0.7% Two or more races83 1.0% White alone, not Hispanic / Latino72 0.8% Hispanic or Latino
Children Nativity (place of birth) in Herndon
Children under 6 years - Living with two parents Both parents native 397 100.0% NativeBoth parents foreign-born 496 82.7% Native104 17.3% Foreign-bornOne native, one foreign-born parent 219 100.0% NativeChildren under 6 years - Living with one parent Native parent 70 88.9% Native9 11.1% Foreign-bornForeign-born parent 315 64.7% Native172 35.3% Foreign-bornChildren 6 to 17 years - Living with two parents Both parents native 1,054 100.0% NativeBoth parents foreign-born 722 73.5% Native261 26.5% Foreign-bornOne native, one foreign-born parent 617 100.0% NativeChildren 6 to 17 years - Living with one parent Native parent 7 100.0% NativeForeign-born parent 556 63.9% Native314 36.1% Foreign-born
Grandparents responsible for own grandchildren in Herndon
Grandparents (30 to 59 years) White / Caucasian 23 57.2% Responsible for grandchildren17 42.8% Not responsible for grandchildrenBlack or African American 14 100.0% Not responsible for grandchildrenAsian 75 100.0% Not responsible for grandchildrenOther race 145 100.0% Not responsible for grandchildrenWhite alone, not Hispanic / Latino 14 100.0% Not responsible for grandchildrenHispanic or Latino 44 29.5% Responsible for grandchildren105 70.5% Not responsible for grandchildrenGrandparents (60 years and over) White / Caucasian 6 11.7% Responsible for grandchildren48 88.3% Not responsible for grandchildrenBlack or African American 42 100.0% Not responsible for grandchildrenAsian 16 11.4% Responsible for grandchildren126 88.6% Not responsible for grandchildrenOther race 222 100.0% Not responsible for grandchildrenWhite alone, not Hispanic / Latino 34 100.0% Not responsible for grandchildrenHispanic or Latino 9 4.2% Responsible for grandchildren209 95.8% Not responsible for grandchildren