Races in Missouri City, Texas (TX) Detailed Stats
Data:
Races - White alone (%)
Races - White alone (% change since 2000)
Races - Black alone (%)
Races - Black alone (% change since 2000)
Races - American Indian alone (%)
Races - American Indian alone (% change since 2000)
Races - Asian alone (%)
Races - Asian alone (% change since 2000)
Races - Hispanic (%)
Races - Hispanic (% change since 2000)
Races - Native Hawaiian and Other Pacific Islander alone (%)
Races - Native Hawaiian and Other Pacific Islander alone (% change since 2000)
Races - Two or more races(%)
Races - Two or more races(% change since 2000)
Races - Other race alone (%)
Races - Other race alone (% change since 2000)
Racial diversity
Place of birth - Born in state of residence (%)
Place of birth - Born in state of residence (%) - White
Place of birth - Born in state of residence (%) - Black or African American
Place of birth - Born in state of residence (%) - Asian
Place of birth - Born in state of residence (%) - Hispanic or Latino
Place of birth - Born in state of residence (%) - American Indian and Alaska Native
Place of birth - Born in state of residence (%) - Multirace
Place of birth - Born in state of residence (%) - Other Race
Place of birth - Born in other state (%)
Place of birth - Born in other state (%) - White
Place of birth - Born in other state (%) - Black or African American
Place of birth - Born in other state (%) - Asian
Place of birth - Born in other state (%) - Hispanic or Latino
Place of birth - Born in other state (%) - American Indian and Alaska Native
Place of birth - Born in other state (%) - Multirace
Place of birth - Born in other state (%) - Other Race
Place of birth - Native, outside of US (%)
Place of birth - Native, outside of US (%) - White
Place of birth - Native, outside of US (%) - Black or African American
Place of birth - Native, outside of US (%) - Asian
Place of birth - Native, outside of US (%) - Hispanic or Latino
Place of birth - Native, outside of US (%) - American Indian and Alaska Native
Place of birth - Native, outside of US (%) - Multirace
Place of birth - Native, outside of US (%) - Other Race
Place of birth - Foreign born (%)
Place of birth - Foreign born (%) - White
Place of birth - Foreign born (%) - Black or African American
Place of birth - Foreign born (%) - Asian
Place of birth - Foreign born (%) - Hispanic or Latino
Place of birth - Foreign born (%) - American Indian and Alaska Native
Place of birth - Foreign born (%) - Multirace
Place of birth - Foreign born (%) - Other Race
Residents speaking English at home (%)
Residents speaking English at home - Born in the United States (%)
Residents speaking English at home - Native, born elsewhere (%)
Residents speaking English at home - Foreign born (%)
Residents speaking Spanish at home (%)
Residents speaking Spanish at home - Born in the United States (%)
Residents speaking Spanish at home - Native, born elsewhere (%)
Residents speaking Spanish at home - Foreign born (%)
Residents speaking other language at home (%)
Residents speaking other language at home - Born in the United States (%)
Residents speaking other language at home - Native, born elsewhere (%)
Residents speaking other language at home - Foreign born (%)
Marital status - Never married (%)
Marital status - Now married (%)
Marital status - Separated (%)
Marital status - Widowed (%)
Marital status - Divorced (%)
Ancestries Reported - Arab (%)
Ancestries Reported - Czech (%)
Ancestries Reported - Danish (%)
Ancestries Reported - Dutch (%)
Ancestries Reported - English (%)
Ancestries Reported - French (%)
Ancestries Reported - French Canadian (%)
Ancestries Reported - German (%)
Ancestries Reported - Greek (%)
Ancestries Reported - Hungarian (%)
Ancestries Reported - Irish (%)
Ancestries Reported - Italian (%)
Ancestries Reported - Lithuanian (%)
Ancestries Reported - Norwegian (%)
Ancestries Reported - Polish (%)
Ancestries Reported - Portuguese (%)
Ancestries Reported - Russian (%)
Ancestries Reported - Scotch-Irish (%)
Ancestries Reported - Scottish (%)
Ancestries Reported - Slovak (%)
Ancestries Reported - Subsaharan African (%)
Ancestries Reported - Swedish (%)
Ancestries Reported - Swiss (%)
Ancestries Reported - Ukrainian (%)
Ancestries Reported - United States (%)
Ancestries Reported - Welsh (%)
Ancestries Reported - West Indian (%)
Ancestries Reported - Other (%)
Geographical mobility - Same house 1 year ago (%)
Geographical mobility - Same house 1 year ago (%) - White
Geographical mobility - Same house 1 year ago (%) - Black or African American
Geographical mobility - Same house 1 year ago (%) - Asian
Geographical mobility - Same house 1 year ago (%) - Hispanic or Latino
Geographical mobility - Same house 1 year ago (%) - American Indian and Alaska Native
Geographical mobility - Same house 1 year ago (%) - Multirace
Geographical mobility - Same house 1 year ago (%) - Other Race
Geographical mobility - Moved within same county (%)
Geographical mobility - Moved within same county (%) - White
Geographical mobility - Moved within same county (%) - Black or African American
Geographical mobility - Moved within same county (%) - Asian
Geographical mobility - Moved within same county (%) - Hispanic or Latino
Geographical mobility - Moved within same county (%) - American Indian and Alaska Native
Geographical mobility - Moved within same county (%) - Multirace
Geographical mobility - Moved within same county (%) - Other Race
Geographical mobility - Moved from different county within same state (%)
Geographical mobility - Moved from different county within same state (%) - White
Geographical mobility - Moved from different county within same state (%) - Black or African American
Geographical mobility - Moved from different county within same state (%) - Asian
Geographical mobility - Moved from different county within same state (%) - Hispanic or Latino
Geographical mobility - Moved from different county within same state (%) - American Indian and Alaska Native
Geographical mobility - Moved from different county within same state (%) - Multirace
Geographical mobility - Moved from different county within same state (%) - Other Race
Geographical mobility - Moved from different state (%)
Geographical mobility - Moved from different state (%) - White
Geographical mobility - Moved from different state (%) - Black or African American
Geographical mobility - Moved from different state (%) - Asian
Geographical mobility - Moved from different state (%) - Hispanic or Latino
Geographical mobility - Moved from different state (%) - American Indian and Alaska Native
Geographical mobility - Moved from different state (%) - Multirace
Geographical mobility - Moved from different state (%) - Other Race
Geographical mobility - Moved from abroad (%)
Geographical mobility - Moved from abroad (%) - White
Geographical mobility - Moved from abroad (%) - Black or African American
Geographical mobility - Moved from abroad (%) - Asian
Geographical mobility - Moved from abroad (%) - Hispanic or Latino
Geographical mobility - Moved from abroad (%) - American Indian and Alaska Native
Geographical mobility - Moved from abroad (%) - Multirace
Geographical mobility - Moved from abroad (%) - Other Race
Place of birth for the foreign-born population - Ireland (%)
Place of birth for the foreign-born population - Denmark (%)
Place of birth for the foreign-born population - Norway (%)
Place of birth for the foreign-born population - Sweden (%)
Place of birth for the foreign-born population - United Kingdom (%)
Place of birth for the foreign-born population - England (%)
Place of birth for the foreign-born population - Scotland (%)
Place of birth for the foreign-born population - Other Northern Europe (%)
Place of birth for the foreign-born population - Austria (%)
Place of birth for the foreign-born population - Belgium (%)
Place of birth for the foreign-born population - France (%)
Place of birth for the foreign-born population - Germany (%)
Place of birth for the foreign-born population - Netherlands (%)
Place of birth for the foreign-born population - Switzerland (%)
Place of birth for the foreign-born population - Other Western Europe (%)
Place of birth for the foreign-born population - Greece (%)
Place of birth for the foreign-born population - Italy (%)
Place of birth for the foreign-born population - Portugal (%)
Place of birth for the foreign-born population - Spain (%)
Place of birth for the foreign-born population - Other Southern Europe (%)
Place of birth for the foreign-born population - Albania (%)
Place of birth for the foreign-born population - Belarus (%)
Place of birth for the foreign-born population - Bosnia and Herzegovina (%)
Place of birth for the foreign-born population - Bulgaria (%)
Place of birth for the foreign-born population - Croatia (%)
Place of birth for the foreign-born population - Czechoslovakia (%)
Place of birth for the foreign-born population - Hungary (%)
Place of birth for the foreign-born population - Latvia (%)
Place of birth for the foreign-born population - Lithuania (%)
Place of birth for the foreign-born population - North Macedonia (Macedonia) (%)
Place of birth for the foreign-born population - Moldova (%)
Place of birth for the foreign-born population - Poland (%)
Place of birth for the foreign-born population - Romania (%)
Place of birth for the foreign-born population - Russia (%)
Place of birth for the foreign-born population - Serbia (%)
Place of birth for the foreign-born population - Ukraine (%)
Place of birth for the foreign-born population - Other Eastern Europe (%)
Place of birth for the foreign-born population - China (%)
Place of birth for the foreign-born population - Hong Kong (%)
Place of birth for the foreign-born population - Taiwan (%)
Place of birth for the foreign-born population - Japan (%)
Place of birth for the foreign-born population - Korea (%)
Place of birth for the foreign-born population - Other Eastern Asia (%)
Place of birth for the foreign-born population - Afghanistan (%)
Place of birth for the foreign-born population - Bangladesh (%)
Place of birth for the foreign-born population - India (%)
Place of birth for the foreign-born population - Iran (%)
Place of birth for the foreign-born population - Kazakhstan (%)
Place of birth for the foreign-born population - Nepal (%)
Place of birth for the foreign-born population - Pakistan (%)
Place of birth for the foreign-born population - Sri Lanka (%)
Place of birth for the foreign-born population - Uzbekistan (%)
Place of birth for the foreign-born population - Other South Central Asia (%)
Place of birth for the foreign-born population - Burma (%)
Place of birth for the foreign-born population - Cambodia (%)
Place of birth for the foreign-born population - Indonesia (%)
Place of birth for the foreign-born population - Laos (%)
Place of birth for the foreign-born population - Malaysia (%)
Place of birth for the foreign-born population - Philippines (%)
Place of birth for the foreign-born population - Singapore (%)
Place of birth for the foreign-born population - Thailand (%)
Place of birth for the foreign-born population - Vietnam (%)
Place of birth for the foreign-born population - Other South Eastern Asia (%)
Place of birth for the foreign-born population - Armenia (%)
Place of birth for the foreign-born population - Iraq (%)
Place of birth for the foreign-born population - Israel (%)
Place of birth for the foreign-born population - Jordan (%)
Place of birth for the foreign-born population - Kuwait (%)
Place of birth for the foreign-born population - Lebanon (%)
Place of birth for the foreign-born population - Saudi Arabia (%)
Place of birth for the foreign-born population - Syria (%)
Place of birth for the foreign-born population - Turkey (%)
Place of birth for the foreign-born population - Yemen (%)
Place of birth for the foreign-born population - Other Western Asia (%)
Place of birth for the foreign-born population - Eritrea (%)
Place of birth for the foreign-born population - Ethiopia (%)
Place of birth for the foreign-born population - Kenya (%)
Place of birth for the foreign-born population - Somalia (%)
Place of birth for the foreign-born population - Uganda (%)
Place of birth for the foreign-born population - Zimbabwe (%)
Place of birth for the foreign-born population - Other Eastern Africa (%)
Place of birth for the foreign-born population - Cameroon (%)
Place of birth for the foreign-born population - Congo (%)
Place of birth for the foreign-born population - Democratic Republic of Congo (Zaire) (%)
Place of birth for the foreign-born population - Other Middle Africa (%)
Place of birth for the foreign-born population - Egypt (%)
Place of birth for the foreign-born population - Morocco (%)
Place of birth for the foreign-born population - Sudan (%)
Place of birth for the foreign-born population - Other Northern Africa (%)
Place of birth for the foreign-born population - South Africa (%)
Place of birth for the foreign-born population - Other Southern Africa (%)
Place of birth for the foreign-born population - Cabo Verde (%)
Place of birth for the foreign-born population - Ghana (%)
Place of birth for the foreign-born population - Liberia (%)
Place of birth for the foreign-born population - Nigeria (%)
Place of birth for the foreign-born population - Senegal (%)
Place of birth for the foreign-born population - Sierra Leone (%)
Place of birth for the foreign-born population - Other Western Africa (%)
Place of birth for the foreign-born population - Australia (%)
Place of birth for the foreign-born population - New Zealand (%)
Place of birth for the foreign-born population - Fiji (%)
Place of birth for the foreign-born population - Micronesia (%)
Place of birth for the foreign-born population - Bahamas (%)
Place of birth for the foreign-born population - Barbados (%)
Place of birth for the foreign-born population - Cuba (%)
Place of birth for the foreign-born population - Dominica (%)
Place of birth for the foreign-born population - Dominican Republic (%)
Place of birth for the foreign-born population - Grenada (%)
Place of birth for the foreign-born population - Haiti (%)
Place of birth for the foreign-born population - Jamaica (%)
Place of birth for the foreign-born population - St. Vincent and the Grenadines (%)
Place of birth for the foreign-born population - Trinidad and Tobago (%)
Place of birth for the foreign-born population - West Indies (%)
Place of birth for the foreign-born population - Other Caribbean (%)
Place of birth for the foreign-born population - Belize (%)
Place of birth for the foreign-born population - Costa Rica (%)
Place of birth for the foreign-born population - El Salvador (%)
Place of birth for the foreign-born population - Guatemala (%)
Place of birth for the foreign-born population - Honduras (%)
Place of birth for the foreign-born population - Mexico (%)
Place of birth for the foreign-born population - Nicaragua (%)
Place of birth for the foreign-born population - Panama (%)
Place of birth for the foreign-born population - Other Central America (%)
Place of birth for the foreign-born population - Argentina (%)
Place of birth for the foreign-born population - Bolivia (%)
Place of birth for the foreign-born population - Brazil (%)
Place of birth for the foreign-born population - Chile (%)
Place of birth for the foreign-born population - Colombia (%)
Place of birth for the foreign-born population - Ecuador (%)
Place of birth for the foreign-born population - Guyana (%)
Place of birth for the foreign-born population - Peru (%)
Place of birth for the foreign-born population - Uruguay (%)
Place of birth for the foreign-born population - Venezuela (%)
Place of birth for the foreign-born population - Other South America (%)
Place of birth for the foreign-born population - Canada (%)
Place of birth for the foreign-born population - Other Northern America (%)
Place of birth for the foreign-born population - Other (%)
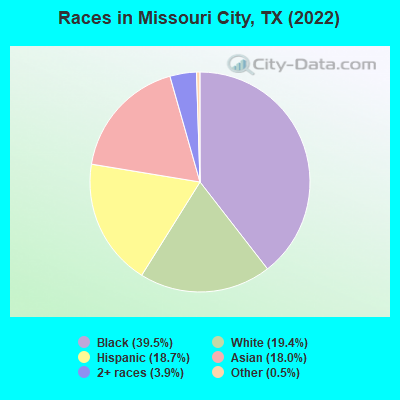
According to 2022 data, the most numerous races in Missouri City, TX are Hispanic (14,869 residents), White alone (15,426 residents), and Black alone (31,403 residents). 76.7% of Missouri City residents speak English at home. 22.5% of Missouri City, TX residents are foreign-born (12.4% born in Asia, 7.6% born in Latin America), which is 24.6% greater than the foreign-born rate of 17.0% across the entire state of Texas.
Race distribution in Missouri City
2000 2022
10,933,313 52.4% White alone 6,669,666 32.0% Hispanic 2,364,255 11.3% Black alone 554,445 2.7% Asian alone 230,567 1.1% Two or more races 68,859 0.3% American Indian alone 19,958 0.10% Other race alone 10,757 0.05% Native Hawaiian and Other
12,070,642 40.2% Hispanic 11,683,430 38.9% White alone 3,508,706 11.7% Black alone 1,608,173 5.4% Asian alone 956,560 3.2% Two or more races 125,763 0.4% Other race alone 47,023 0.2% American Indian alone 29,275 0.10% Native Hawaiian and Other
Income and house value in Missouri City Median household income in 2022 $107,222 White non-Hispanic householders$101,875 Black householders$106,856 Asian householders$143,832 Some other race householders$110,485 Two or more races householders$94,198 Hispanic or Latino race householdersMedian 2022 house value $328,409 White Non-Hispanic householders$227,261 Black or African American householders$168,837 American Indian or Alaska Native householders $363,154 Asian householders$200,237 Some other race householders$252,483 Two or more races householders$231,379 Hispanic or Latino householders
Median age by race in Missouri City
43.6 Median age for White residents46.8 42.2 37.6 Median age for Black or African American residents38.4 37.4 52.1 Median age for American Indian / Alaska Native residents48.3 -666,666,666.0 52.8 Median age for Asian residents48.0 55.2 -666,666,666.0 Median age for Native Hawaiian / Pacific Islander residents-666,666,666.0 -666,666,666.0 45.5 Median age for Other race residents38.4 51.1 25.0 Median age for Two or more races residents25.0 32.1 52.6 Median age for White alone residents52.0 56.0 33.1 Median age for Hispanic or Latino residents33.1 32.8
Owner/renter occupied households by race in Missouri City
House owners and renters - White residents 6,910 89.2% Owner occupied837 10.8% Renter occupiedHouse owners and renters - Black or African American residents 10,662 72.0% Owner occupied4,142 28.0% Renter occupiedHouse owners and renters - American Indian / Alaska Native residents 24 66.3% Owner occupied12 33.7% Renter occupiedHouse owners and renters - Asian residents 3,530 87.7% Owner occupied495 12.3% Renter occupiedHouse owners and renters - Other race residents 1,123 75.8% Owner occupied358 24.2% Renter occupiedHouse owners and renters - Two or more races residents 1,862 91.3% Owner occupied177 8.7% Renter occupiedHouse owners and renters - White alone residents 5,624 92.8% Owner occupied434 7.2% Renter occupiedHouse owners and renters - Hispanic or Latino residents 3,428 85.7% Owner occupied572 14.3% Renter occupied
Language usage in Missouri City
English speakers - Total 76.7% of residents of Missouri City speak English at home.
9.2% of residents speak Spanish at home 4,795 75.5% Speak English very well1,556 24.5% Speak English less than very well14.1% of residents speak other language at home 6,537 66.7% Speak English very well3,270 33.3% Speak English less than very well
English speakers - Born in the United States 96.3% of residents of Missouri City speak English at home.
1.1% of residents speak Spanish at home 167 100.0% Speak English very well2.6% of residents speak other language at home 413 100.0% Speak English very well
English speakers - Native, born elsewhere 41.2% of residents of Missouri City speak English at home.
7.7% of residents speak Spanish at home 61 100.0% Speak English less than very well51.1% of residents speak other language at home 405 100.0% Speak English less than very well
English speakers - Foreign-born 16.9% of residents of Missouri City speak English at home.
21.6% of residents speak Spanish at home 1,765 60.1% Speak English very well1,171 39.9% Speak English less than very well61.6% of residents speak other language at home 5,628 67.1% Speak English very well2,755 32.9% Speak English less than very well
White (Caucasian) - Speak only English Native:
90.0% (13,869)Foreign-born:
20.1% (440)
White (Caucasian) - Speak another language Native:
9.2% (1,416)Foreign-born:
76.0% (1,667)
Black or African American - Speak only English Native:
100.0% (28,735)Foreign-born:
57.7% (1,181)
Black or African American - Speak another language Native:
0.7% (207)Foreign-born:
42.5% (869)
Asian - Speak only English Native:
59.3% (1,659)Foreign-born:
8.9% (661)
Asian - Speak another language Native:
40.7% (1,139)Foreign-born:
91.1% (6,745)
Other race - Speak only English Native:
27.3% (627)Foreign-born:
14.3% (277)
Other race - Speak another language Native:
73.8% (1,697)Foreign-born:
82.1% (1,589)
Two or more races - Speak only English Native:
69.1% (4,128)Foreign-born:
9.4% (138)
Two or more races - Speak another language Native:
30.9% (1,848)Foreign-born:
90.6% (1,337)
White alone - Speak only English Native:
96.7% (13,257)Foreign-born:
33.4% (417)
White alone - Speak another language Native:
3.4% (461)Foreign-born:
66.5% (829)
Hispanic or Latino - Speak only English Native:
47.6% (2,937)Foreign-born:
4.5% (138)
Hispanic or Latino - Speak another language Native:
52.4% (3,238)Foreign-born:
95.5% (2,936)
Foreign-born residents in Missouri City 17,934 residents are foreign born (12.4% Asia , 7.6% Latin America ).
This city:
22.5%Texas:
17.1%
Marital status for residents in Missouri City Marital status - White (Caucasian) population 15 years and over
Males 8.9% Never married81.3% Now married0.0% Separated1.5% Widowed8.2% DivorcedFemales 23.4% Never married60.7% Now married5.4% Separated5.4% Widowed5.0% DivorcedWomen who gave birth in the past 12 months Now married:
100.0% (830)Unmarried:
0.0% (0)
Women who did not give birth in the past 12 months Now married:
47.8% (1,696)Unmarried:
52.2% (1,852)
Marital status - Black or African American population 15 years and over
Males 52.0% Never married38.8% Now married0.7% Separated3.1% Widowed5.4% DivorcedFemales 39.2% Never married41.7% Now married1.7% Separated6.1% Widowed11.4% DivorcedWomen who gave birth in the past 12 months Now married:
25.3% (201)Unmarried:
74.7% (594)
Women who did not give birth in the past 12 months Now married:
39.0% (3,235)Unmarried:
61.0% (5,054)
Marital status - American Indian / Alaska Native population 15 years and over
Males 78.6% Never married0.0% Now married0.0% Separated0.0% Widowed21.4% DivorcedFemales 0.0% Never married100.0% Now married0.0% Separated0.0% Widowed0.0% DivorcedWomen who gave birth in the past 12 months Now married:
100.0% (6)Unmarried:
0.0% (0)
Marital status - Asian population 15 years and over
Males 29.1% Never married66.3% Now married0.3% Separated0.7% Widowed3.6% DivorcedFemales 23.2% Never married67.5% Now married0.9% Separated4.9% Widowed3.6% DivorcedWomen who gave birth in the past 12 months Now married:
98.3% (248)Unmarried:
1.7% (4)
Women who did not give birth in the past 12 months Now married:
53.5% (1,745)Unmarried:
46.5% (1,516)
Marital status - Other race population 15 years and over
Males 30.8% Never married54.4% Now married3.3% Separated1.0% Widowed10.4% DivorcedFemales 27.0% Never married54.7% Now married2.7% Separated6.8% Widowed8.9% DivorcedWomen who gave birth in the past 12 months Now married:
100.0% (187)Unmarried:
0.0% (0)
Women who did not give birth in the past 12 months Now married:
48.8% (675)Unmarried:
51.2% (707)
Marital status - Two or more races population 15 years and over
Males 47.5% Never married45.2% Now married4.5% Separated0.4% Widowed2.4% DivorcedFemales 32.2% Never married52.7% Now married2.8% Separated3.0% Widowed9.4% DivorcedWomen who gave birth in the past 12 months Now married:
100.0% (144)Unmarried:
0.0% (0)
Women who did not give birth in the past 12 months Now married:
47.1% (979)Unmarried:
52.9% (1,102)
Marital status - White alone, not Hispanic / Latino population 15 years and over
Males 8.0% Never married81.1% Now married0.0% Separated1.7% Widowed9.2% DivorcedFemales 22.1% Never married58.5% Now married7.3% Separated7.3% Widowed4.7% DivorcedWomen who gave birth in the past 12 months Now married:
100.0% (26)Unmarried:
0.0% (0)
Women who did not give birth in the past 12 months Now married:
52.7% (1,520)Unmarried:
47.3% (1,366)
Marital status - Hispanic or Latino population 15 years and over
Males 42.8% Never married48.1% Now married5.8% Separated0.0% Widowed3.3% DivorcedFemales 19.6% Never married71.6% Now married1.0% Separated0.9% Widowed6.9% DivorcedWomen who gave birth in the past 12 months Now married:
100.0% (1,045)Unmarried:
0.0% (0)
Women who did not give birth in the past 12 months Now married:
55.8% (1,274)Unmarried:
44.2% (1,009)
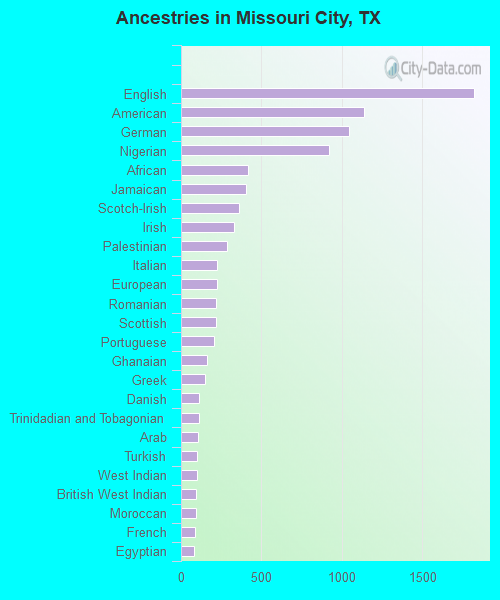
Ancestries in Missouri City
1,822 3.8% English1,136 2.3% American1,043 2.2% German917 1.9% Nigerian418 0.9% African401 0.8% Jamaican359 0.7% Scotch-Irish329 0.7% Irish285 0.6% Palestinian226 0.5% Italian225 0.5% European218 0.4% Romanian217 0.4% Scottish208 0.4% Portuguese161 0.3% Ghanaian148 0.3% Greek111 0.2% Danish111 0.2% Trinidadian and Tobagonian105 0.2% Arab102 0.2% Turkish99 0.2% West Indian94 0.2% British West Indian93 0.2% Moroccan87 0.2% French79 0.2% Egyptian70 0.1% Norwegian68 0.1% Dutch61 0.1% Haitian58 0.1% Polish51 0.1% Russian46 0.09% South African45 0.09% Swedish45 0.09% French Canadian37 0.08% British36 0.07% Eastern European33 0.07% Czech28 0.06% Senegalese27 0.06% Guyanese25 0.05% Lebanese23 0.05% Scandinavian23 0.05% Ethiopian15 0.03% Canadian15 0.03% Finnish14 0.03% Israeli14 0.03% Hungarian14 0.03% Northern European14 0.03% Iranian13 0.03% Croatian11 0.02% Swiss9 0.02% Lithuanian9 0.02% Czechoslovakian4 0.01% Jordanian
Geographical mobility in Missouri City Same house 1 year ago 16,770 90.9% White (Caucasian)28,613 91.9% Black or African American83 100.0% American Indian / Alaska Native13,253 92.4% Asian24 98.2% Native Hawaiian / Pacific Islander4,037 91.6% Other race7,412 84.5% Two or more races14,363 93.4% White alone, not Hispanic / Latino9,651 91.1% Hispanic or LatinoMoved within same county 387 2.1% White / Caucasian953 3.1% Black or African American204 1.4% Asian16 0.4% Other race43 0.5% Two or more races235 1.5% White alone, not Hispanic / Latino43 0.4% Hispanic or LatinoMoved within same state 1,249 6.8% White / Caucasian1,220 3.9% Black or African American705 4.9% Asian196 4.5% Other race682 7.8% Two or more races662 4.3% White alone, not Hispanic / Latino680 6.4% Hispanic or LatinoMoved from different state 173 0.9% White / Caucasian650 2.1% Black or African American126 0.9% Asian631 7.2% Two or more races172 1.1% White alone, not Hispanic / Latino219 2.1% Hispanic or LatinoMoved from abroad 9 0.0% White38 0.1% Black or African American82 0.6% Asian5 0.1% Two or more races5 0.0% Hispanic or Latino
Children Nativity (place of birth) in Missouri City
Children under 6 years - Living with two parents Both parents native 1,659 100.0% NativeBoth parents foreign-born 1,342 100.0% NativeOne native, one foreign-born parent 634 100.0% NativeChildren under 6 years - Living with one parent Native parent 1,584 100.0% NativeForeign-born parent 80 100.0% NativeChildren 6 to 17 years - Living with two parents Both parents native 4,425 100.0% NativeBoth parents foreign-born 1,587 73.5% Native571 26.5% Foreign-bornOne native, one foreign-born parent 702 100.0% NativeChildren 6 to 17 years - Living with one parent Native parent 2,652 100.0% NativeForeign-born parent 805 52.6% Native726 47.4% Foreign-born
Place of birth for residents in Missouri City 9,546 Asia5,975 Americas5,886 Latin America5,515 South Central Asia4,115 Central America2,216 South Eastern Asia1,641 Africa1,399 Eastern Asia1,385 China1,171 Western Africa910 Caribbean860 South America771 Europe406 Western Asia314 Northern Europe200 Southern Europe185 Eastern Africa133 Western Europe123 Eastern Europe98 Northern Africa89 Northern America49 Southern Africa5,249 India1,803 Mexico1,675 El Salvador1,051 Philippines1,028 Vietnam979 China818 Nigeria518 Jamaica297 Honduras277 Colombia241 Brazil238 Taiwan207 Ghana173 Panama167 Hong Kong148 United Kingdom133 Greece130 Trinidad and Tobago124 Peru121 Pakistan107 Germany102 Saudi Arabia101 Belize93 Iraq92 Grenada89 Canada81 Venezuela78 Egypt75 Barbados71 England64 Togo64 Kenya64 Russia63 Bolivia61 Norway55 Nepal54 Portugal52 Guyana51 Indonesia49 Nicaragua49 South Africa48 Senegal43 Uganda37 Kuwait36 Bangladesh34 Cambodia34 Ethiopia33 Malaysia32 Liberia29 St. Vincent and the Grenadines27 Uzbekistan27 Tanzania25 Romania25 Netherlands24 Iran22 Croatia21 Cuba17 West Indies15 Zimbabwe14 Guatemala13 Israel13 Korea13 Scotland11 Italy10 Poland10 Jordan9 Thailand8 Lebanon8 Singapore5 Ireland
Grandparents responsible for own grandchildren in Missouri City
Grandparents (30 to 59 years) White / Caucasian 96 100.0% Responsible for grandchildrenBlack or African American 166 87.0% Responsible for grandchildren25 13.0% Not responsible for grandchildrenAsian 46 100.0% Not responsible for grandchildrenNative Hawaiian / Pacific Islander 25 100.0% Responsible for grandchildrenOther race 36 100.0% Not responsible for grandchildrenWhite alone, not Hispanic / Latino 38 100.0% Responsible for grandchildrenHispanic or Latino 56 52.9% Responsible for grandchildren50 47.1% Not responsible for grandchildrenGrandparents (60 years and over) White / Caucasian 55 23.6% Responsible for grandchildren178 76.4% Not responsible for grandchildrenBlack or African American 100 22.2% Responsible for grandchildren350 77.8% Not responsible for grandchildrenAsian 93 23.1% Responsible for grandchildren310 76.9% Not responsible for grandchildrenWhite alone, not Hispanic / Latino 78 35.9% Responsible for grandchildren140 64.1% Not responsible for grandchildrenHispanic or Latino 60 100.0% Not responsible for grandchildren