Races in Riverdale Park, Maryland (MD) Detailed Stats
Data:
Races - White alone (%)
Races - White alone (% change since 2000)
Races - Black alone (%)
Races - Black alone (% change since 2000)
Races - American Indian alone (%)
Races - American Indian alone (% change since 2000)
Races - Asian alone (%)
Races - Asian alone (% change since 2000)
Races - Hispanic (%)
Races - Hispanic (% change since 2000)
Races - Native Hawaiian and Other Pacific Islander alone (%)
Races - Native Hawaiian and Other Pacific Islander alone (% change since 2000)
Races - Two or more races(%)
Races - Two or more races(% change since 2000)
Races - Other race alone (%)
Races - Other race alone (% change since 2000)
Racial diversity
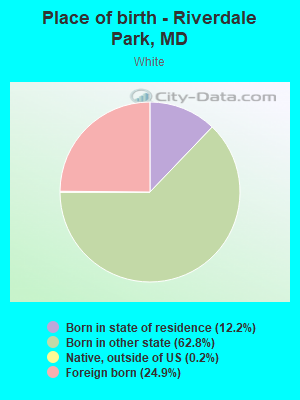
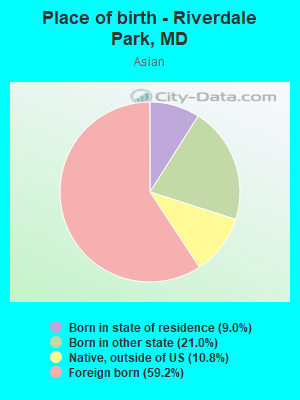
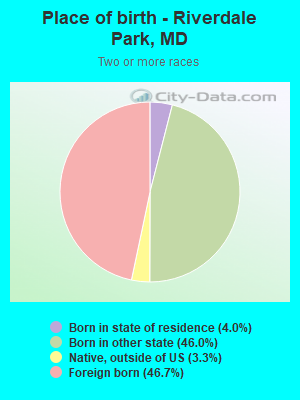
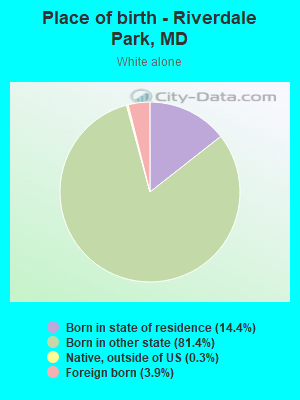
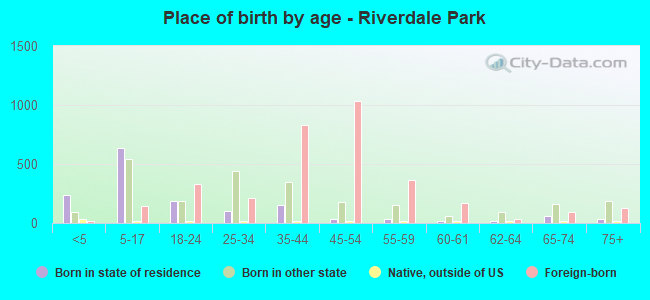
Place of birth - Born in state of residence (%)
Place of birth - Born in state of residence (%) - White
Place of birth - Born in state of residence (%) - Black or African American
Place of birth - Born in state of residence (%) - Asian
Place of birth - Born in state of residence (%) - Hispanic or Latino
Place of birth - Born in state of residence (%) - American Indian and Alaska Native
Place of birth - Born in state of residence (%) - Multirace
Place of birth - Born in state of residence (%) - Other Race
Place of birth - Born in other state (%)
Place of birth - Born in other state (%) - White
Place of birth - Born in other state (%) - Black or African American
Place of birth - Born in other state (%) - Asian
Place of birth - Born in other state (%) - Hispanic or Latino
Place of birth - Born in other state (%) - American Indian and Alaska Native
Place of birth - Born in other state (%) - Multirace
Place of birth - Born in other state (%) - Other Race
Place of birth - Native, outside of US (%)
Place of birth - Native, outside of US (%) - White
Place of birth - Native, outside of US (%) - Black or African American
Place of birth - Native, outside of US (%) - Asian
Place of birth - Native, outside of US (%) - Hispanic or Latino
Place of birth - Native, outside of US (%) - American Indian and Alaska Native
Place of birth - Native, outside of US (%) - Multirace
Place of birth - Native, outside of US (%) - Other Race
Place of birth - Foreign born (%)
Place of birth - Foreign born (%) - White
Place of birth - Foreign born (%) - Black or African American
Place of birth - Foreign born (%) - Asian
Place of birth - Foreign born (%) - Hispanic or Latino
Place of birth - Foreign born (%) - American Indian and Alaska Native
Place of birth - Foreign born (%) - Multirace
Place of birth - Foreign born (%) - Other Race
Residents speaking English at home (%)
Residents speaking English at home - Born in the United States (%)
Residents speaking English at home - Native, born elsewhere (%)
Residents speaking English at home - Foreign born (%)
Residents speaking Spanish at home (%)
Residents speaking Spanish at home - Born in the United States (%)
Residents speaking Spanish at home - Native, born elsewhere (%)
Residents speaking Spanish at home - Foreign born (%)
Residents speaking other language at home (%)
Residents speaking other language at home - Born in the United States (%)
Residents speaking other language at home - Native, born elsewhere (%)
Residents speaking other language at home - Foreign born (%)
Marital status - Never married (%)
Marital status - Now married (%)
Marital status - Separated (%)
Marital status - Widowed (%)
Marital status - Divorced (%)
Ancestries Reported - Arab (%)
Ancestries Reported - Czech (%)
Ancestries Reported - Danish (%)
Ancestries Reported - Dutch (%)
Ancestries Reported - English (%)
Ancestries Reported - French (%)
Ancestries Reported - French Canadian (%)
Ancestries Reported - German (%)
Ancestries Reported - Greek (%)
Ancestries Reported - Hungarian (%)
Ancestries Reported - Irish (%)
Ancestries Reported - Italian (%)
Ancestries Reported - Lithuanian (%)
Ancestries Reported - Norwegian (%)
Ancestries Reported - Polish (%)
Ancestries Reported - Portuguese (%)
Ancestries Reported - Russian (%)
Ancestries Reported - Scotch-Irish (%)
Ancestries Reported - Scottish (%)
Ancestries Reported - Slovak (%)
Ancestries Reported - Subsaharan African (%)
Ancestries Reported - Swedish (%)
Ancestries Reported - Swiss (%)
Ancestries Reported - Ukrainian (%)
Ancestries Reported - United States (%)
Ancestries Reported - Welsh (%)
Ancestries Reported - West Indian (%)
Ancestries Reported - Other (%)
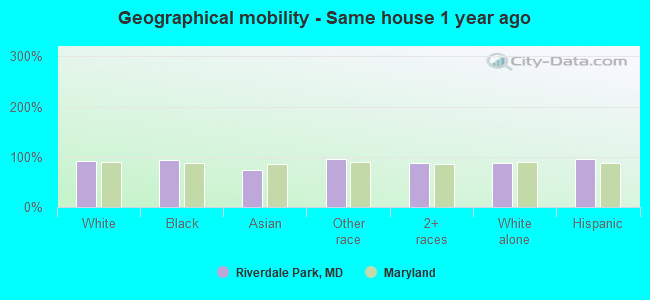
Geographical mobility - Same house 1 year ago (%)
Geographical mobility - Same house 1 year ago (%) - White
Geographical mobility - Same house 1 year ago (%) - Black or African American
Geographical mobility - Same house 1 year ago (%) - Asian
Geographical mobility - Same house 1 year ago (%) - Hispanic or Latino
Geographical mobility - Same house 1 year ago (%) - American Indian and Alaska Native
Geographical mobility - Same house 1 year ago (%) - Multirace
Geographical mobility - Same house 1 year ago (%) - Other Race
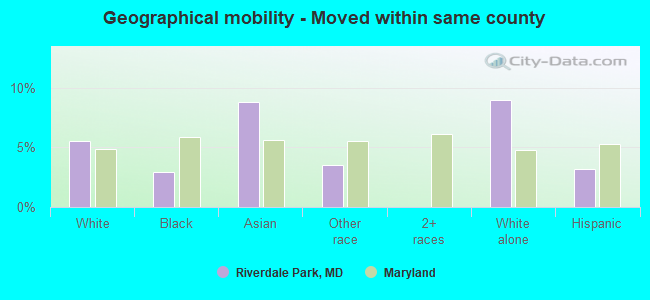
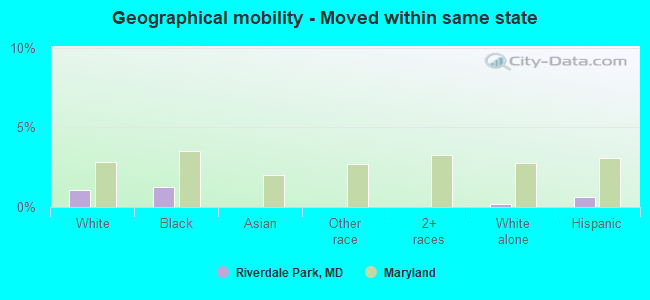
Geographical mobility - Moved within same county (%)
Geographical mobility - Moved within same county (%) - White
Geographical mobility - Moved within same county (%) - Black or African American
Geographical mobility - Moved within same county (%) - Asian
Geographical mobility - Moved within same county (%) - Hispanic or Latino
Geographical mobility - Moved within same county (%) - American Indian and Alaska Native
Geographical mobility - Moved within same county (%) - Multirace
Geographical mobility - Moved within same county (%) - Other Race
Geographical mobility - Moved from different county within same state (%)
Geographical mobility - Moved from different county within same state (%) - White
Geographical mobility - Moved from different county within same state (%) - Black or African American
Geographical mobility - Moved from different county within same state (%) - Asian
Geographical mobility - Moved from different county within same state (%) - Hispanic or Latino
Geographical mobility - Moved from different county within same state (%) - American Indian and Alaska Native
Geographical mobility - Moved from different county within same state (%) - Multirace
Geographical mobility - Moved from different county within same state (%) - Other Race
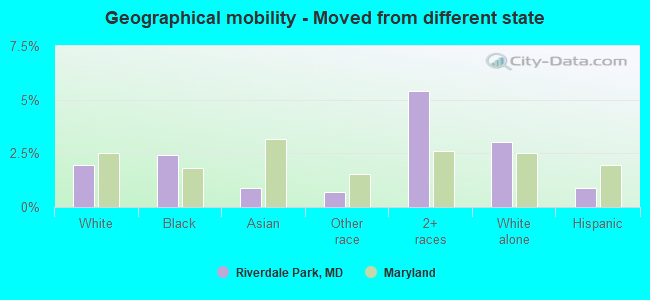
Geographical mobility - Moved from different state (%)
Geographical mobility - Moved from different state (%) - White
Geographical mobility - Moved from different state (%) - Black or African American
Geographical mobility - Moved from different state (%) - Asian
Geographical mobility - Moved from different state (%) - Hispanic or Latino
Geographical mobility - Moved from different state (%) - American Indian and Alaska Native
Geographical mobility - Moved from different state (%) - Multirace
Geographical mobility - Moved from different state (%) - Other Race
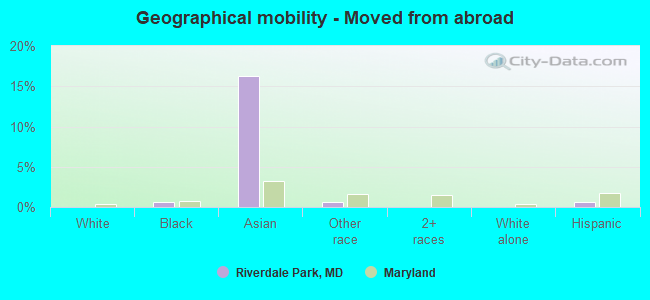
Geographical mobility - Moved from abroad (%)
Geographical mobility - Moved from abroad (%) - White
Geographical mobility - Moved from abroad (%) - Black or African American
Geographical mobility - Moved from abroad (%) - Asian
Geographical mobility - Moved from abroad (%) - Hispanic or Latino
Geographical mobility - Moved from abroad (%) - American Indian and Alaska Native
Geographical mobility - Moved from abroad (%) - Multirace
Geographical mobility - Moved from abroad (%) - Other Race
Place of birth for the foreign-born population - Ireland (%)
Place of birth for the foreign-born population - Denmark (%)
Place of birth for the foreign-born population - Norway (%)
Place of birth for the foreign-born population - Sweden (%)
Place of birth for the foreign-born population - United Kingdom (%)
Place of birth for the foreign-born population - England (%)
Place of birth for the foreign-born population - Scotland (%)
Place of birth for the foreign-born population - Other Northern Europe (%)
Place of birth for the foreign-born population - Austria (%)
Place of birth for the foreign-born population - Belgium (%)
Place of birth for the foreign-born population - France (%)
Place of birth for the foreign-born population - Germany (%)
Place of birth for the foreign-born population - Netherlands (%)
Place of birth for the foreign-born population - Switzerland (%)
Place of birth for the foreign-born population - Other Western Europe (%)
Place of birth for the foreign-born population - Greece (%)
Place of birth for the foreign-born population - Italy (%)
Place of birth for the foreign-born population - Portugal (%)
Place of birth for the foreign-born population - Spain (%)
Place of birth for the foreign-born population - Other Southern Europe (%)
Place of birth for the foreign-born population - Albania (%)
Place of birth for the foreign-born population - Belarus (%)
Place of birth for the foreign-born population - Bosnia and Herzegovina (%)
Place of birth for the foreign-born population - Bulgaria (%)
Place of birth for the foreign-born population - Croatia (%)
Place of birth for the foreign-born population - Czechoslovakia (%)
Place of birth for the foreign-born population - Hungary (%)
Place of birth for the foreign-born population - Latvia (%)
Place of birth for the foreign-born population - Lithuania (%)
Place of birth for the foreign-born population - North Macedonia (Macedonia) (%)
Place of birth for the foreign-born population - Moldova (%)
Place of birth for the foreign-born population - Poland (%)
Place of birth for the foreign-born population - Romania (%)
Place of birth for the foreign-born population - Russia (%)
Place of birth for the foreign-born population - Serbia (%)
Place of birth for the foreign-born population - Ukraine (%)
Place of birth for the foreign-born population - Other Eastern Europe (%)
Place of birth for the foreign-born population - China (%)
Place of birth for the foreign-born population - Hong Kong (%)
Place of birth for the foreign-born population - Taiwan (%)
Place of birth for the foreign-born population - Japan (%)
Place of birth for the foreign-born population - Korea (%)
Place of birth for the foreign-born population - Other Eastern Asia (%)
Place of birth for the foreign-born population - Afghanistan (%)
Place of birth for the foreign-born population - Bangladesh (%)
Place of birth for the foreign-born population - India (%)
Place of birth for the foreign-born population - Iran (%)
Place of birth for the foreign-born population - Kazakhstan (%)
Place of birth for the foreign-born population - Nepal (%)
Place of birth for the foreign-born population - Pakistan (%)
Place of birth for the foreign-born population - Sri Lanka (%)
Place of birth for the foreign-born population - Uzbekistan (%)
Place of birth for the foreign-born population - Other South Central Asia (%)
Place of birth for the foreign-born population - Burma (%)
Place of birth for the foreign-born population - Cambodia (%)
Place of birth for the foreign-born population - Indonesia (%)
Place of birth for the foreign-born population - Laos (%)
Place of birth for the foreign-born population - Malaysia (%)
Place of birth for the foreign-born population - Philippines (%)
Place of birth for the foreign-born population - Singapore (%)
Place of birth for the foreign-born population - Thailand (%)
Place of birth for the foreign-born population - Vietnam (%)
Place of birth for the foreign-born population - Other South Eastern Asia (%)
Place of birth for the foreign-born population - Armenia (%)
Place of birth for the foreign-born population - Iraq (%)
Place of birth for the foreign-born population - Israel (%)
Place of birth for the foreign-born population - Jordan (%)
Place of birth for the foreign-born population - Kuwait (%)
Place of birth for the foreign-born population - Lebanon (%)
Place of birth for the foreign-born population - Saudi Arabia (%)
Place of birth for the foreign-born population - Syria (%)
Place of birth for the foreign-born population - Turkey (%)
Place of birth for the foreign-born population - Yemen (%)
Place of birth for the foreign-born population - Other Western Asia (%)
Place of birth for the foreign-born population - Eritrea (%)
Place of birth for the foreign-born population - Ethiopia (%)
Place of birth for the foreign-born population - Kenya (%)
Place of birth for the foreign-born population - Somalia (%)
Place of birth for the foreign-born population - Uganda (%)
Place of birth for the foreign-born population - Zimbabwe (%)
Place of birth for the foreign-born population - Other Eastern Africa (%)
Place of birth for the foreign-born population - Cameroon (%)
Place of birth for the foreign-born population - Congo (%)
Place of birth for the foreign-born population - Democratic Republic of Congo (Zaire) (%)
Place of birth for the foreign-born population - Other Middle Africa (%)
Place of birth for the foreign-born population - Egypt (%)
Place of birth for the foreign-born population - Morocco (%)
Place of birth for the foreign-born population - Sudan (%)
Place of birth for the foreign-born population - Other Northern Africa (%)
Place of birth for the foreign-born population - South Africa (%)
Place of birth for the foreign-born population - Other Southern Africa (%)
Place of birth for the foreign-born population - Cabo Verde (%)
Place of birth for the foreign-born population - Ghana (%)
Place of birth for the foreign-born population - Liberia (%)
Place of birth for the foreign-born population - Nigeria (%)
Place of birth for the foreign-born population - Senegal (%)
Place of birth for the foreign-born population - Sierra Leone (%)
Place of birth for the foreign-born population - Other Western Africa (%)
Place of birth for the foreign-born population - Australia (%)
Place of birth for the foreign-born population - New Zealand (%)
Place of birth for the foreign-born population - Fiji (%)
Place of birth for the foreign-born population - Micronesia (%)
Place of birth for the foreign-born population - Bahamas (%)
Place of birth for the foreign-born population - Barbados (%)
Place of birth for the foreign-born population - Cuba (%)
Place of birth for the foreign-born population - Dominica (%)
Place of birth for the foreign-born population - Dominican Republic (%)
Place of birth for the foreign-born population - Grenada (%)
Place of birth for the foreign-born population - Haiti (%)
Place of birth for the foreign-born population - Jamaica (%)
Place of birth for the foreign-born population - St. Vincent and the Grenadines (%)
Place of birth for the foreign-born population - Trinidad and Tobago (%)
Place of birth for the foreign-born population - West Indies (%)
Place of birth for the foreign-born population - Other Caribbean (%)
Place of birth for the foreign-born population - Belize (%)
Place of birth for the foreign-born population - Costa Rica (%)
Place of birth for the foreign-born population - El Salvador (%)
Place of birth for the foreign-born population - Guatemala (%)
Place of birth for the foreign-born population - Honduras (%)
Place of birth for the foreign-born population - Mexico (%)
Place of birth for the foreign-born population - Nicaragua (%)
Place of birth for the foreign-born population - Panama (%)
Place of birth for the foreign-born population - Other Central America (%)
Place of birth for the foreign-born population - Argentina (%)
Place of birth for the foreign-born population - Bolivia (%)
Place of birth for the foreign-born population - Brazil (%)
Place of birth for the foreign-born population - Chile (%)
Place of birth for the foreign-born population - Colombia (%)
Place of birth for the foreign-born population - Ecuador (%)
Place of birth for the foreign-born population - Guyana (%)
Place of birth for the foreign-born population - Peru (%)
Place of birth for the foreign-born population - Uruguay (%)
Place of birth for the foreign-born population - Venezuela (%)
Place of birth for the foreign-born population - Other South America (%)
Place of birth for the foreign-born population - Canada (%)
Place of birth for the foreign-born population - Other Northern America (%)
Place of birth for the foreign-born population - Other (%)
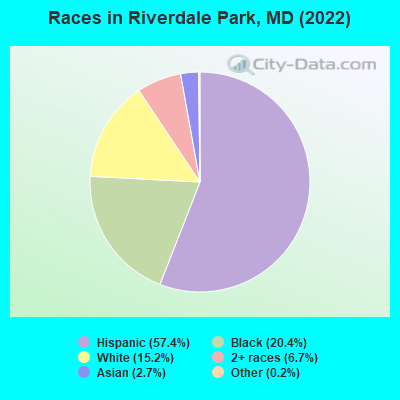
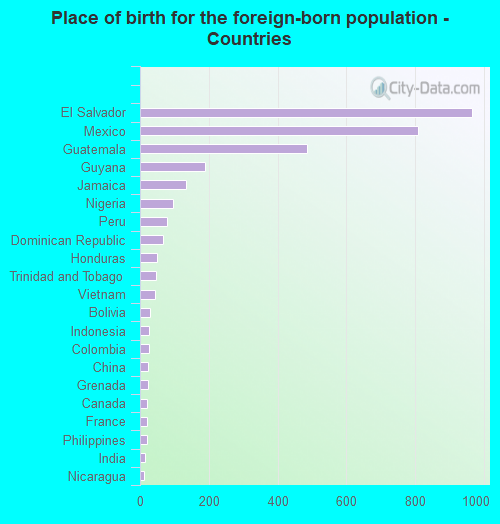
According to 2022 data, the most numerous races in Riverdale Park, MD are White alone (1,098 residents), Black alone (1,469 residents), and Hispanic (4,139 residents). 42.6% of Riverdale Park residents speak English at home. 45.5% of Riverdale Park, MD residents are foreign-born (37.6% born in Latin America), which is 64.9% greater than the foreign-born rate of 16.0% across the entire state of Maryland.
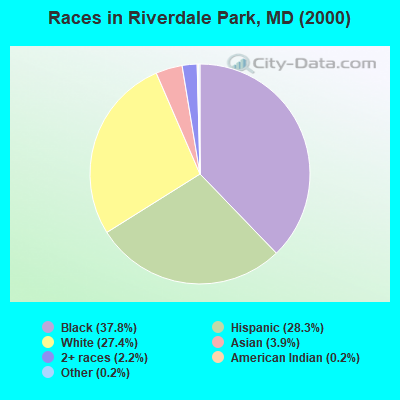
Race distribution in Riverdale Park
2000 2022
3,286,547 62.1% White alone 1,464,735 27.7% Black alone 227,916 4.3% Hispanic 209,738 4.0% Asian alone 82,946 1.6% Two or more races 13,312 0.3% American Indian alone 9,379 0.2% Other race alone 1,913 0.04% Native Hawaiian and Other
2,906,492 47.1% White alone 1,800,914 29.2% Black alone 705,842 11.4% Hispanic 401,818 6.5% Asian alone 291,317 4.7% Two or more races 46,930 0.8% Other race alone 8,930 0.1% American Indian alone 2,417 0.04% Native Hawaiian and Other
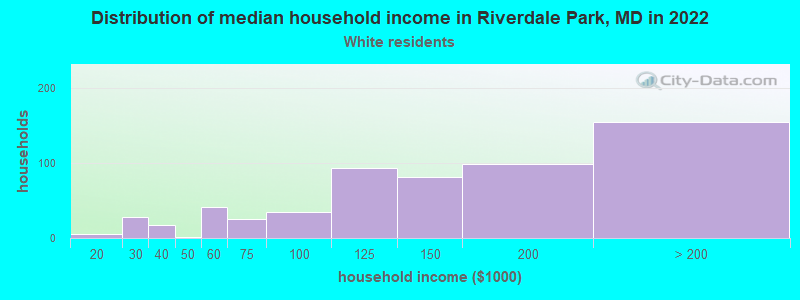
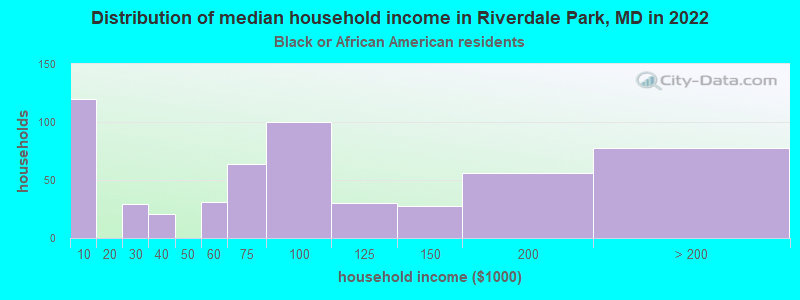
Income and house value in Riverdale Park Median household income in 2022 $139,344 White non-Hispanic householders$80,055 Black householders$67,282 Some other race householdersover $200,000 Two or more races householders$76,233 Hispanic or Latino race householdersMedian 2022 house value $440,888 White Non-Hispanic householders$494,699 Black or African American householders $530,214 Asian householders$481,426 Some other race householders$403,580 Two or more races householders$440,171 Hispanic or Latino householders
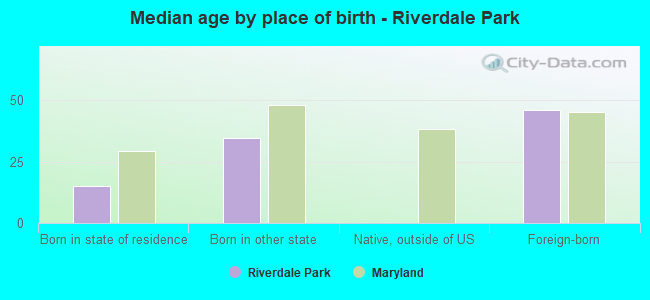
Median age by race in Riverdale Park
45.5 Median age for White residents44.9 48.4 46.9 Median age for Black or African American residents45.0 47.9 -780,410,741.7 Median age for American Indian / Alaska Native residents-888,297,871.5 -689,905,591.2 37.5 Median age for Asian residents35.4 38.2 -571,600,480.8 Median age for Native Hawaiian / Pacific Islander residents-720,061,021.4 -760,942,760.2 23.2 Median age for Other race residents25.1 19.3 40.5 Median age for Two or more races residents31.0 54.1 39.3 Median age for White alone residents38.8 38.7 29.9 Median age for Hispanic or Latino residents34.3 26.6
Owner/renter occupied households by race in Riverdale Park
House owners and renters - White residents 397 64.8% Owner occupied215 35.2% Renter occupiedHouse owners and renters - Black or African American residents 239 42.9% Owner occupied317 57.1% Renter occupiedHouse owners and renters - Asian residents 41 87.0% Owner occupied6 13.0% Renter occupiedHouse owners and renters - Other race residents 236 27.6% Owner occupied618 72.4% Renter occupiedHouse owners and renters - Two or more races residents 192 100.0% Owner occupiedHouse owners and renters - White alone residents 345 70.4% Owner occupied145 29.6% Renter occupiedHouse owners and renters - Hispanic or Latino residents 348 33.9% Owner occupied678 66.1% Renter occupied
Language usage in Riverdale Park
English speakers - Total 42.6% of residents of Riverdale Park speak English at home.
51.8% of residents speak Spanish at home 1,733 48.9% Speak English very well1,813 51.1% Speak English less than very well6.5% of residents speak other language at home 312 70.4% Speak English very well131 29.6% Speak English less than very well
English speakers - Born in the United States 73.8% of residents of Riverdale Park speak English at home.
23.3% of residents speak Spanish at home 548 98.4% Speak English very well9 1.6% Speak English less than very well4.4% of residents speak other language at home 89 84.0% Speak English very well17 16.0% Speak English less than very well
English speakers - Native, born elsewhere 7.5% of residents of Riverdale Park speak English at home.
57.5% of residents speak Spanish at home 7 30.4% Speak English very well16 69.6% Speak English less than very well15.0% of residents speak other language at home 6 100.0% Speak English very well
English speakers - Foreign-born 22.8% of residents of Riverdale Park speak English at home.
65.3% of residents speak Spanish at home 412 19.0% Speak English very well1,758 81.0% Speak English less than very well9.3% of residents speak other language at home 198 63.9% Speak English very well112 36.1% Speak English less than very well
White (Caucasian) - Speak only English Native:
95.8% (956)Foreign-born:
24.9% (89)
White (Caucasian) - Speak another language Native:
4.7% (47)Foreign-born:
75.3% (269)
Black or African American - Speak only English Native:
92.0% (967)Foreign-born:
55.4% (216)
Black or African American - Speak another language Native:
8.6% (90)Foreign-born:
42.3% (165)
Asian - Speak only English Native:
18.5% (11)Foreign-born:
8.7% (11)
Asian - Speak another language Native:
93.6% (57)Foreign-born:
90.2% (109)
Other race - Speak only English Native:
1.5% (19)Foreign-born:
10.3% (197)
Other race - Speak another language Native:
96.3% (1,273)Foreign-born:
88.4% (1,692)
Two or more races - Speak only English Native:
79.4% (297)Foreign-born:
66.0% (233)
Two or more races - Speak another language Native:
20.4% (76)Foreign-born:
23.0% (81)
White alone - Speak only English Native:
98.6% (936)Foreign-born:
60.5% (25)
White alone - Speak another language Native:
0.5% (5)Foreign-born:
41.1% (17)
Hispanic or Latino - Speak only English Native:
6.3% (94)Foreign-born:
10.2% (252)
Hispanic or Latino - Speak another language Native:
92.3% (1,364)Foreign-born:
88.5% (2,191)
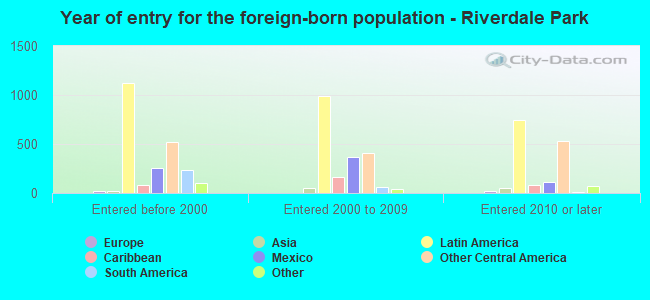
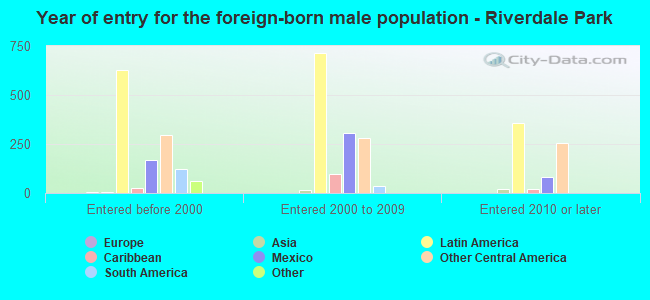
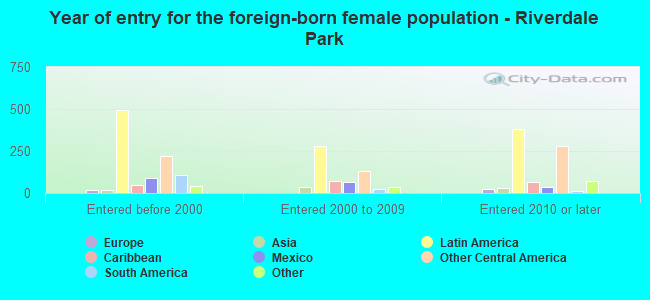
Foreign-born residents in Riverdale Park 3,281 residents are foreign born (37.6% Latin America ).
This city:
45.5%Maryland:
15.7%
Marital status for residents in Riverdale Park Marital status - White (Caucasian) population 15 years and over
Males 39.5% Never married53.2% Now married2.0% Separated0.7% Widowed4.6% DivorcedFemales 28.1% Never married46.5% Now married0.0% Separated16.4% Widowed9.1% DivorcedWomen who gave birth in the past 12 months Now married:
100.0% (33)Unmarried:
0.0% (0)
Women who did not give birth in the past 12 months Now married:
41.7% (120)Unmarried:
58.3% (167)
Marital status - Black or African American population 15 years and over
Males 32.2% Never married40.6% Now married5.9% Separated0.9% Widowed20.4% DivorcedFemales 40.0% Never married38.4% Now married1.2% Separated10.1% Widowed10.3% DivorcedWomen who gave birth in the past 12 months Now married:
20.8% (5)Unmarried:
79.2% (18)
Women who did not give birth in the past 12 months Now married:
32.4% (97)Unmarried:
67.6% (202)
Marital status - Asian population 15 years and over
Males 54.4% Never married45.6% Now married0.0% Separated0.0% Widowed0.0% DivorcedFemales 28.3% Never married71.7% Now married0.0% Separated0.0% Widowed0.0% DivorcedWomen who did not give birth in the past 12 months Now married:
58.5% (46)Unmarried:
41.5% (32)
Marital status - Other race population 15 years and over
Males 55.5% Never married35.9% Now married7.1% Separated1.5% Widowed0.0% DivorcedFemales 42.7% Never married45.4% Now married0.0% Separated0.0% Widowed11.9% DivorcedWomen who gave birth in the past 12 months Now married:
100.0% (51)Unmarried:
0.0% (0)
Women who did not give birth in the past 12 months Now married:
44.0% (319)Unmarried:
56.0% (405)
Marital status - Two or more races population 15 years and over
Males 60.1% Never married34.2% Now married0.0% Separated0.0% Widowed5.7% DivorcedFemales 20.8% Never married71.5% Now married0.0% Separated0.0% Widowed7.7% DivorcedWomen who gave birth in the past 12 months Now married:
100.0% (8)Unmarried:
0.0% (0)
Women who did not give birth in the past 12 months Now married:
44.2% (37)Unmarried:
55.8% (47)
Marital status - White alone, not Hispanic / Latino population 15 years and over
Males 30.0% Never married61.5% Now married0.0% Separated1.2% Widowed7.3% DivorcedFemales 31.5% Never married51.1% Now married0.0% Separated11.7% Widowed5.7% DivorcedWomen who gave birth in the past 12 months Now married:
100.0% (36)Unmarried:
0.0% (0)
Women who did not give birth in the past 12 months Now married:
50.2% (106)Unmarried:
49.8% (105)
Marital status - Hispanic or Latino population 15 years and over
Males 55.8% Never married35.9% Now married6.5% Separated1.2% Widowed0.6% DivorcedFemales 36.9% Never married43.6% Now married0.0% Separated6.6% Widowed12.9% DivorcedWomen who gave birth in the past 12 months Now married:
100.0% (47)Unmarried:
0.0% (0)
Women who did not give birth in the past 12 months Now married:
41.4% (341)Unmarried:
58.6% (482)
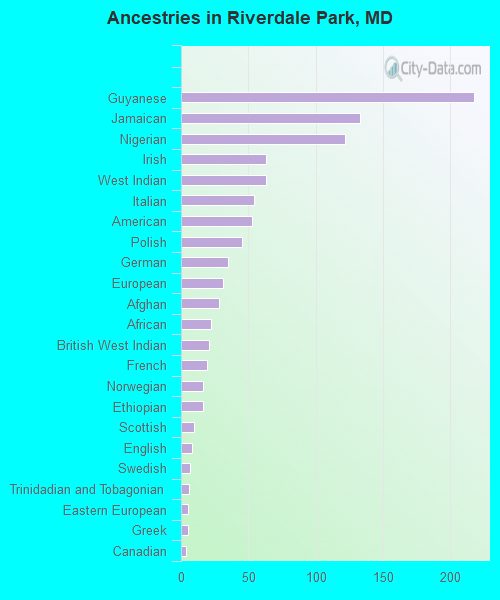
Ancestries in Riverdale Park
218 4.2% Guyanese133 2.5% Jamaican122 2.3% Nigerian63 1.2% Irish63 1.2% West Indian54 1.0% Italian53 1.0% American45 0.9% Polish35 0.7% German31 0.6% European28 0.5% Afghan22 0.4% African21 0.4% British West Indian19 0.4% French16 0.3% Norwegian16 0.3% Ethiopian10 0.2% Scottish8 0.2% English7 0.1% Swedish6 0.1% Trinidadian and Tobagonian5 0.10% Eastern European5 0.10% Greek4 0.08% Canadian
Children Nativity (place of birth) in Riverdale Park
Children under 6 years - Living with two parents Both parents native 99 100.0% NativeBoth parents foreign-born 171 100.0% NativeOne native, one foreign-born parent 32 100.0% NativeChildren under 6 years - Living with one parent Native parent 42 100.0% NativeForeign-born parent 43 100.0% NativeChildren 6 to 17 years - Living with two parents Both parents native 0 18.8% Foreign-bornBoth parents foreign-born 647 92.6% Native52 7.4% Foreign-bornOne native, one foreign-born parent 53 100.0% NativeChildren 6 to 17 years - Living with one parent Foreign-born parent 553 55.8% Native439 44.2% Foreign-born
Grandparents responsible for own grandchildren in Riverdale Park
Grandparents (30 to 59 years) White / Caucasian 12 100.0% Not responsible for grandchildrenBlack or African American 9 46.9% Responsible for grandchildren10 53.1% Not responsible for grandchildrenAsian 6 100.0% Not responsible for grandchildrenOther race 23 100.0% Not responsible for grandchildrenTwo or more races 18 100.0% Not responsible for grandchildrenWhite alone, not Hispanic / Latino 5 100.0% Not responsible for grandchildrenHispanic or Latino 39 100.0% Not responsible for grandchildrenGrandparents (60 years and over) Black or African American 33 79.7% Responsible for grandchildren8 20.3% Not responsible for grandchildrenOther race 17 100.0% Not responsible for grandchildrenHispanic or Latino 19 100.0% Not responsible for grandchildren