Estimated zip code population in 2022: 23,877 Zip code population in 2010: 22,194 Zip code population in 2000: 22,047
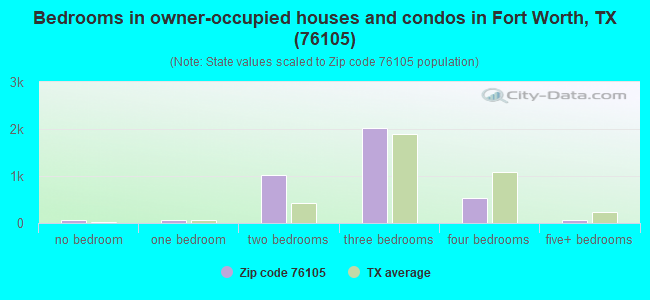
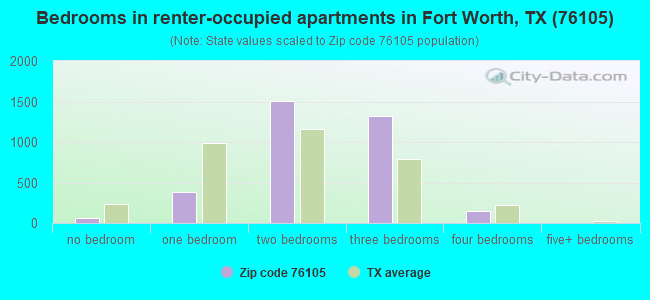
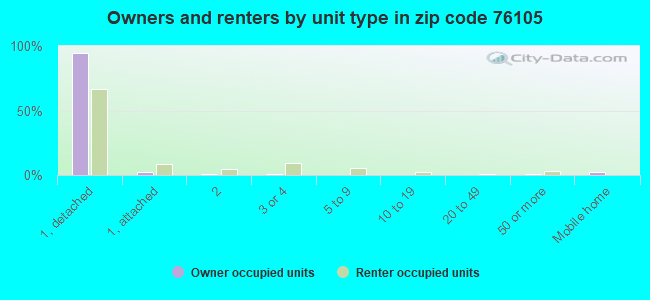
Houses and condos: 8,187 Renter-occupied apartments: 3,478
% of renters here:
48%
State:
38%
March 2022 cost of living index in zip code 76105: 93.6 (less than average, U.S. average is 100)
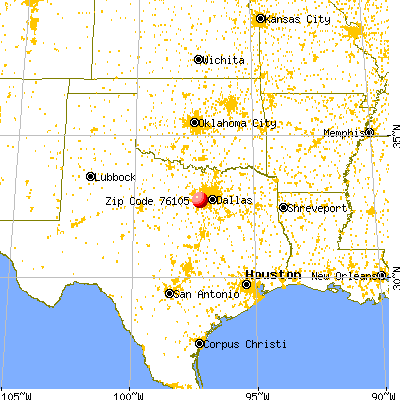
Land area: 5.6 sq. mi. Water area: 0.0 sq. mi.
Population density: 4,286 people per square mile
(average).
OSM Map
General Map
Google Map
MSN Map
OSM Map
General Map
Google Map
MSN Map
OSM Map
General Map
Google Map
MSN Map
OSM Map
General Map
Google Map
MSN Map
Please wait while loading the map...
Real estate property taxes paid for housing units in 2022:
This zip code:
1.3% ($1,552)
Texas:
1.5% ($4,050)
Median real estate property taxes paid for housing units with mortgages in 2022: $1,861 (1.3%) Median real estate property taxes paid for housing units with no mortgage in 2022: $1,495 (1.3%)
Averages for the 2020 tax year for zip code 76105, filed in 2021:
Average Adjusted Gross Income (AGI) in 2020: $29,322 (Individual Income Tax Returns)
Here:
$29,322
State:
$77,054
Salary/wage: $29,417 (reported on 85.1% of returns)
Here:
$29,417
State:
$62,766
(% of AGI for various income ranges: 1303.9% for AGIs below $25k, 3859.3% for AGIs $25k-50k, 6842.9% for AGIs $50k-75k, 10328.6% for AGIs $75k-100k, 15870.0% for AGIs $100k-200k)
Taxable interest for individuals: $212 (reported on 4.1% of returns)
This zip code:
$212
Texas:
$2,665
(% of AGI for various income ranges: 0.4% for AGIs below $25k, 1.1% for AGIs $25k-50k, 1.8% for AGIs $50k-75k, 11.4% for AGIs $75k-100k)
Ordinary dividends: $718 (reported on 1.1% of returns)
Here:
$718
State:
$10,044
(% of AGI for various income ranges: 0.5% for AGIs below $25k, 1.7% for AGIs $25k-50k, 1.3% for AGIs $50k-75k)
Net capital gain/loss in AGI: +$4,208 (reported on 1.3% of returns)
Here:
+$4,208
State:
+$39,590
(% of AGI for various income ranges: 3.3% for AGIs $25k-50k, 14.9% for AGIs $50k-75k, 157.6% for AGIs $75k-100k)
Profit/loss from business: +$5,066 (reported on 24.8% of returns)
Here:
+$5,066
State:
+$10,888
(% of AGI for various income ranges: 181.7% for AGIs below $25k, 100.6% for AGIs $25k-50k, 92.9% for AGIs $50k-75k, 392.4% for AGIs $75k-100k, 878.8% for AGIs $100k-200k)
Taxable individual retirement arrangement distribution: $6,608 (reported on 1.2% of returns)
76105:
$6,608
Texas:
$24,740
(% of AGI for various income ranges: 6.1% for AGIs below $25k, 10.0% for AGIs $25k-50k, 32.9% for AGIs $50k-75k)
Total itemized deductions: $26,765 (reported on 1.7% of returns)
Here:
$26,765
State:
$40,428
(% of AGI for various income ranges: 63.5% for AGIs $25k-50k, 243.7% for AGIs $50k-75k, 394.8% for AGIs $75k-100k)
Charity contributions: $9,662 (reported on 1.3% of returns)
Here:
$9,662
State:
$18,201
(% of AGI for various income ranges: 16.5% for AGIs $25k-50k, 99.7% for AGIs $50k-75k)
Taxes paid: $4,593 (reported on 1.5% of returns)
76105:
$4,593
State:
$7,821
(% of AGI for various income ranges: 9.7% for AGIs $25k-50k, 35.6% for AGIs $50k-75k, 63.3% for AGIs $75k-100k)
Earned income credit: $2,940 (reported on 36.9% of returns)
Here:
$2,940
State:
$2,584
(% of AGI for various income ranges: 187.8% for AGIs below $25k, 110.8% for AGIs $25k-50k, 2.0% for AGIs $50k-75k)
Percentage of individuals using paid preparers for their 2020 taxes: 91.4%
Here:
91%
State:
92%
(% for various income ranges: 90.6% for AGIs below $25k, 92.1% for AGIs $25k-50k, 92.9% for AGIs $50k-75k, 93.3% for AGIs $75k-100k, 92.9% for AGIs $100k-200k)
Averages for the 2012 tax year for zip code 76105, filed in 2013:
Average Adjusted Gross Income (AGI) in 2012: $23,117 (Individual Income Tax Returns)
Here:
$23,117
State:
$65,384
Salary/wage: $22,931 (reported on 87.0% of returns)
Here:
$22,931
State:
$52,524
(% of AGI for various income ranges: 79.7% for AGIs below $25k, 94.5% for AGIs $25k-50k, 89.4% for AGIs $50k-75k, 84.9% for AGIs $75k-100k, 56.7% for AGIs $100k-200k)
Taxable interest for individuals: $289 (reported on 4.4% of returns)
This zip code:
$289
Texas:
$2,372
(% of AGI for various income ranges: 0.1% for AGIs $50k-75k, 0.3% for AGIs $100k-200k)
Ordinary dividends: $1,980 (reported on 1.2% of returns)
Here:
$1,980
State:
$9,721
(% of AGI for various income ranges: 0.2% for AGIs below $25k)
Profit/loss from business: +$6,702 (reported on 23.4% of returns)
Here:
+$6,702
State:
+$13,732
(% of AGI for various income ranges: 15.1% for AGIs below $25k, 1.0% for AGIs $25k-50k, 4.2% for AGIs $50k-75k)
Taxable individual retirement arrangement distribution: $6,553 (reported on 1.7% of returns)
76105:
$6,553
Texas:
$19,511
(% of AGI for various income ranges: 0.3% for AGIs below $25k, 0.4% for AGIs $25k-50k, 1.6% for AGIs $50k-75k)
Total itemized deductions: $16,880 (39% of AGI, reported on 5.2% of returns)
Here:
$16,880
State:
$24,724
Here:
38.7% of AGI
State:
15.9% of AGI
(% of AGI for various income ranges: 1.9% for AGIs below $25k, 4.4% for AGIs $25k-50k, 5.9% for AGIs $50k-75k, 7.3% for AGIs $75k-100k, 5.1% for AGIs $100k-200k)
Charity contributions: $5,144 (reported on 3.7% of returns)
Here:
$5,144
State:
$6,808
(% of AGI for various income ranges: 0.3% for AGIs below $25k, 0.8% for AGIs $25k-50k, 1.7% for AGIs $50k-75k, 4.6% for AGIs $75k-100k)
Taxes paid: $2,412 (reported on 4.7% of returns)
76105:
$2,412
State:
$6,921
(% of AGI for various income ranges: 0.2% for AGIs below $25k, 0.6% for AGIs $25k-50k, 0.9% for AGIs $50k-75k, 2.0% for AGIs $75k-100k)
Earned income credit: $3,016 (reported on 47.5% of returns)
Here:
$3,016
State:
$2,570
(% of AGI for various income ranges: 13.9% for AGIs below $25k, 2.1% for AGIs $25k-50k)
Percentage of individuals using paid preparers for their 2012 taxes: 67.2%
Here:
67%
State:
51%
(% for various income ranges: 66.6% for AGIs below $25k, 68.4% for AGIs $25k-50k, 70.8% for AGIs $50k-75k, 66.7% for AGIs $75k-100k, 50.0% for AGIs $100k-200k)
Averages for the 2004 tax year for zip code 76105, filed in 2005:
Average Adjusted Gross Income (AGI) in 2004: $19,874 (Individual Income Tax Returns)
Here:
$19,874
State:
$47,881
Salary/wage: $19,974 (reported on 92.5% of returns)
Here:
$19,974
State:
$41,947
(% of AGI for various income ranges: 88.7% for AGIs below $10k, 93.7% for AGIs $10k-25k, 95.2% for AGIs $25k-50k, 90.5% for AGIs $50k-75k, 81.0% for AGIs $75k-100k, 62.2% for AGIs over 100k)
Taxable interest for individuals: $387 (reported on 7.5% of returns)
This zip code:
$387
Texas:
$2,255
(% of AGI for various income ranges: 0.2% for AGIs below $10k, 0.2% for AGIs $10k-25k, 0.1% for AGIs $25k-50k, 0.2% for AGIs $50k-75k, 0.2% for AGIs $75k-100k, 0.4% for AGIs over 100k)
Taxable dividends: $316 (reported on 1.8% of returns)
Here:
$316
State:
$4,261
(% of AGI for various income ranges: 0.1% for AGIs below $10k, 0.0% for AGIs $10k-25k, 0.0% for AGIs $25k-50k, 0.0% for AGIs $50k-75k, 0.1% for AGIs $75k-100k)
Net capital gain/loss: +$32 (reported on 0.8% of returns)
Here:
+$32
State:
+$16,110
Profit/loss from business: +$2,623 (reported on 13.2% of returns)
Here:
+$2,623
State:
+$11,013
(% of AGI for various income ranges: 8.7% for AGIs below $10k, 1.9% for AGIs $10k-25k, 0.8% for AGIs $25k-50k, 0.9% for AGIs $50k-75k)
IRA payment deduction: $1,189 (reported on 0.5% of returns)
76105:
$1,189
Texas:
$3,120
Total itemized deductions: $15,514 (39% of AGI, reported on 4.4% of returns)
Here:
$15,514
State:
$19,631
Here:
39.1% of AGI
State:
18.9% of AGI
(% of AGI for various income ranges: 1.7% for AGIs $10k-25k, 4.7% for AGIs $25k-50k, 6.4% for AGIs $50k-75k, 12.0% for AGIs $75k-100k)
Charity contributions deductions: $4,459 (11% of AGI, reported on 3.9% of returns)
Here:
$4,459
State:
$4,753
Here:
11.1% of AGI
State:
4.2% of AGI
(% of AGI for various income ranges: 0.4% for AGIs $10k-25k, 1.0% for AGIs $25k-50k, 2.2% for AGIs $50k-75k, 5.2% for AGIs $75k-100k)
Total tax: $1,855 (reported on 42.4% of returns)
76105:
$1,855
State:
$9,058
(% of AGI for various income ranges: 2.4% for AGIs below $10k, 2.1% for AGIs $10k-25k, 3.9% for AGIs $25k-50k, 7.9% for AGIs $50k-75k, 12.9% for AGIs $75k-100k, 18.8% for AGIs over 100k)
Earned income credit: $2,203 (reported on 51.0% of returns)
Here:
$2,203
State:
$2,024
Percentage of individuals using paid preparers for their 2004 taxes: 72.0%
Here:
72%
State:
57%
(% for various income ranges: 63.7% for AGIs below $10k, 77.3% for AGIs $10k-25k, 72.4% for AGIs $25k-50k, 65.9% for AGIs $50k-75k, 63.9% for AGIs $75k-100k, 62.5% for AGIs over 100k)
Likely homosexual households (counted as self-reported same-sex unmarried-partner households)
Lesbian couples: 0.2% of all households
Gay men: 0.0% of all households
Household received Food Stamps/SNAP in the past 12 months: 2,183 Household did not receive Food Stamps/SNAP in the past 12 months: 5,135
Women who had a birth in the past 12 months: 407 (142 now married, 257 unmarried) Women who did not have a birth in the past 12 months: 5,885 (2,291 now married, 3,603 unmarried)
Housing units in zip code 76105 with a mortgage: 1,145 (45 second mortgage, 37 both second mortgage and home equity loan) Houses without a mortgage: 41
Median monthly owner costs for units with a mortgage: $1,220 Median monthly owner costs for units without a mortgage: $433
Residents with income below the poverty level in 2022:
This zip code:
24.4%
Whole state:
14.0%
Residents with income below 50% of the poverty level in 2022:
This zip code:
12.8%
Whole state:
7.4%
Median number of rooms in houses and condos:
Here:
5.7
State:
6.3
Median number of rooms in apartments:
Here:
4.8
State:
4.0
Notable locations in this zip code not listed on our city pages
Churches in zip code 76105 include: Polytechnic Church (A), Fort Worth Bible Church (B), Burchill Church (C), New Mount Carmel Missionary Baptist Church (D), New Covenant Missionary Baptist Church (E), Lake Arlington Baptist Church (F), Immanuel Baptist Church (G), Holy Way Baptist Church (H), New Beginnings Baptist Church (I). Display/hide their locations on the map
2,882 married couples with children.
2,495 single-parent households (478 men, 2,017 women).
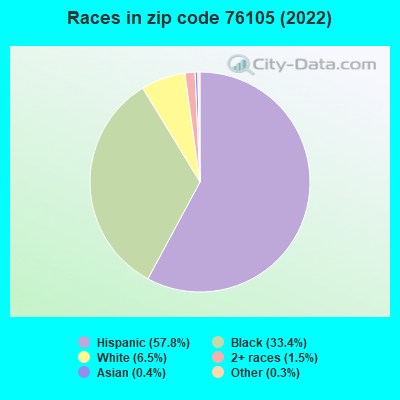
47.4% of residents of 76105 zip code speak English at home.
49.0% of residents speak Spanish at home (57% very well, 19% well, 16% not well, 7% not at all).
0.8% of residents speak other Indo-European language at home (96% very well, 4% well).
0.3% of residents speak Asian or Pacific Island language at home (76% very well, 24% well).
1.5% of residents speak other language at home (46% very well, 46% well, 8% not at all).
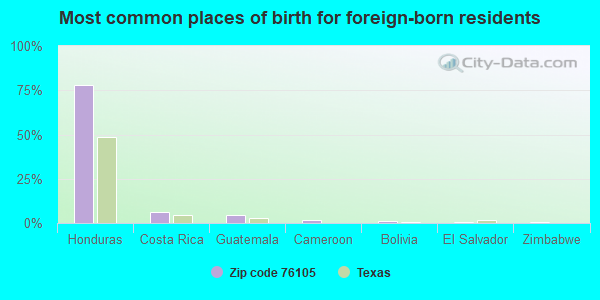
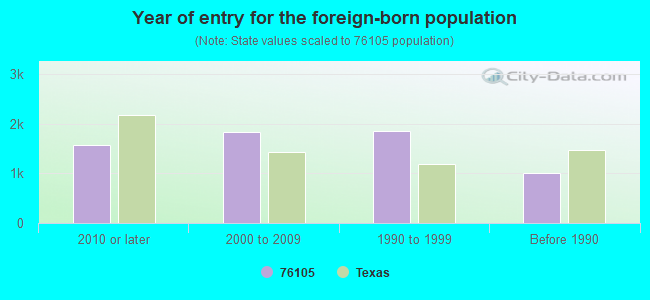
Foreign born population: 6,018 (25.2%) (23.5% of them are naturalized citizens)
Facilities with environmental interests located in this zip code:
AST RESEARCH INC (4211 E ROSEDALE ST in FORT WORTH, TX)
(Resource Conservation and Recovery Act (tracking hazardous waste)) Business NAICS classification: ELECTRONIC COMPUTER MANUFACTURING.
AUTOMOTIVE WASTE RECYCLERS (414 BLUE SMOKE CT W in FORT WORTH, TX)
TRANSPORTER (Resource Conservation and Recovery Act (tracking hazardous waste)) Organizations: PAIGE DANIEL (CONTACT/OWNER)
Housing units lacking complete plumbing facilities: 3.7% Housing units lacking complete kitchen facilities: 4.8%
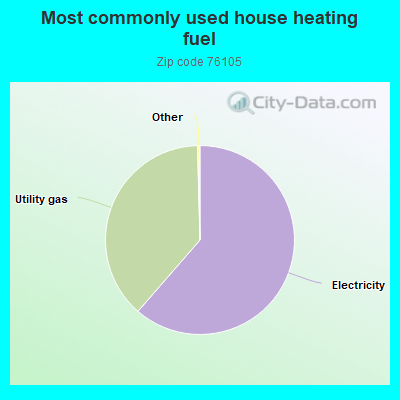
61.4%Electricity
38.2%Utility gas
Population in 1990: 20,947. Population change in the 1990s: +1,100 (+5.3%).
Place of birth for U.S.-born residents:
This state: 14,204
Northeast: 595
Midwest: 517
South: 1,250
West: 865
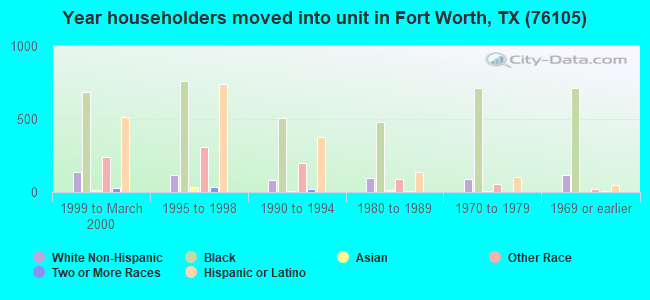
61% of the 76105 zip code residents lived in the same house 5 years ago. Out of people who lived in different houses, 76% lived in this county. Out of people who lived in different counties, 50% lived in Texas.
88% of the 76105 zip code residents lived in the same house 1 year ago. Out of people who lived in different houses, 64% moved from this county. Out of people who lived in different houses, 18% moved from different county within same state. Out of people who lived in different houses, 15% moved from different state. Out of people who lived in different houses, 1% moved from abroad.
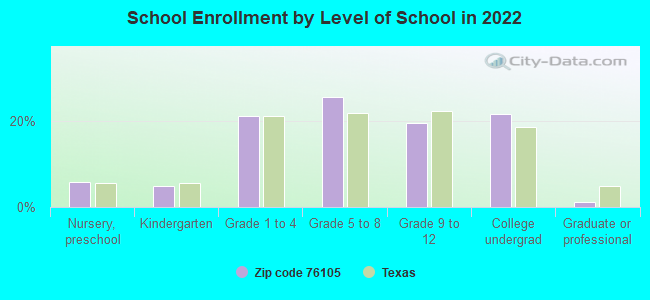
Private vs. public school enrollment:
Students in private schools in grades 1 to 8 (elementary and middle school): 259
Here:
8.2%
Texas:
8.8%
Students in private schools in grades 9 to 12 (high school): 39
Here:
3.0%
Texas:
8.0%
Students in private undergraduate colleges: 448
Here:
30.3%
Texas:
16.2%
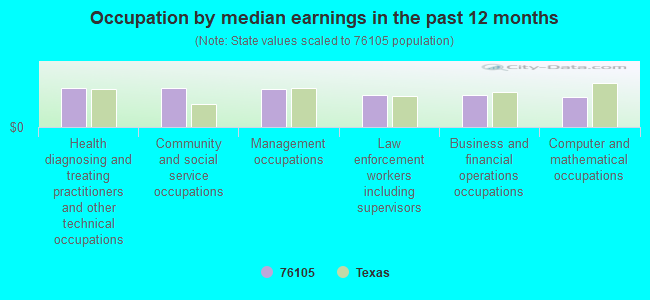
Occupation by median earnings in the past 12 months ($)
54,945Health diagnosing and treating practitioners and other technical occupations
54,412Community and social service occupations
53,498Management occupations
45,275Law enforcement workers including supervisors
44,920Business and financial operations occupations
42,624Computer and mathematical occupations
Companies with federal contracts located in this zip code (FORT WORTH, TX):
DK HANEY CONSTRUCTION, INC (3425 EAST VICKERY; small business) : $12,348,629 in 30 contractsfrom 2003 to 2006
Contracts for Maintenance, Repair or Alteration of Real Property -- Penal Facilities, Maintenance, Repair or Alteration of Real Property -- Other Administrative Facilities and Service Buildings, Maintenance, Repair or Alteration of Real Property -- Office Buildings, Maintenance, Repair or Alteration of Real Property -- Hospitals and Infirmaries, and moreby Bureau of Prisoners/Federal Prison System, Navy, Army Signed by year:2000: $0; 2001: $0; 2002: $0; 2003: $266,153; 2004: $1,060,898; 2005: $9,268,852; 2006: $1,752,726.
Biggest contracts:
$5,180,233 with Bureau of Prisoners/Federal Prison System for Maintenance, Repair or Alteration of Real Property -- Penal Facilities. Signed on 2005-10-11. Completion date: 2006-10-11.
$1,319,623 with Navy for Maintenance, Repair or Alteration of Real Property -- Other Administrative Facilities and Service Buildings. Taking place in FL. Signed on 2005-06-01. Completion date: 2006-02-26.
$1,132,354 with Navy for Maintenance, Repair or Alteration of Real Property -- Office Buildings. Taking place in MS. Signed on 2006-05-25. Completion date: 2006-11-06.
$1,086,331 with Navy for Maintenance, Repair or Alteration of Real Property -- Hospitals and Infirmaries. Taking place in FL. Signed on 2005-09-26. Completion date: 2006-02-08.
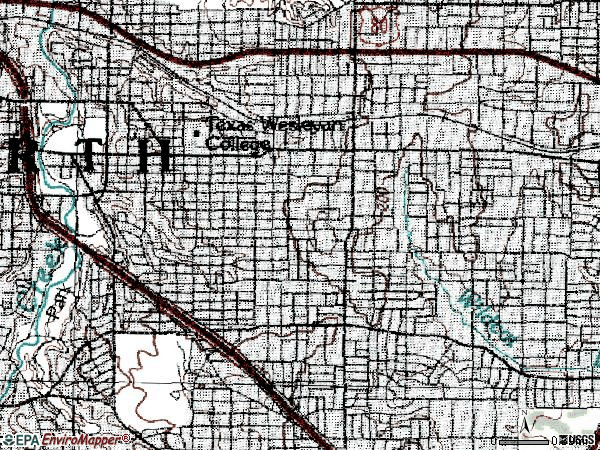
TEXAS WESLEYAN UNIVERSITY (1201 WESLEYAN ST) : $1,634,632 in 21 contractsfrom 1999 to 2004
Contracts for Lease or Rental of Facilities -- Office Buildings, Educational Services, Miscellaneous Items by Public Buildings Service, Army Signed by year:2000: $488,000; 2001: $376,000; 2002: $402,000; 2003: $234,712; 2004: $11,920; 2005: $0; 2006: $0.
Biggest contracts:
$122,000 with Public Buildings Service for Lease or Rental of Facilities -- Office Buildings. Signed on 2000-12-15. Completion date: 2000-12-15.
$122,000, same as above.Signed on 2001-03-15. Completion date: 2001-03-15.
$122,000, same as above.Signed on 2001-06-15. Completion date: 2001-06-15.
$122,000, same as above.Signed on 2000-03-15. Completion date: 2000-03-15.
GENERAL MACHINED PRODUCTS INC (3525 E VICKERY BLVD; small business) : $541,123 in 85 contractsfrom 2003 to 2006
Contracts for Nuts and Washers, Airfield Specialized Trucks and Trailers, Vehicular Brake, Steering, Axle, Wheel, and Track Components, Airframe Structural Components, and moreby Defense Logistics Agency Signed by year:2000: $0; 2001: $0; 2002: $0; 2003: $0; 2004: $178,029; 2005: $282,657; 2006: $80,437.
Biggest contracts:
$72,086 with Defense Logistics Agency for Nuts and Washers. Signed on 2004-12-29. Completion date: 2005-04-08.
$28,314 with Defense Logistics Agency for Airfield Specialized Trucks and Trailers. Signed on 2005-03-22. Completion date: 2005-09-14.
$21,708 with Defense Logistics Agency for Vehicular Brake, Steering, Axle, Wheel, and Track Components. Signed on 2005-06-30. Completion date: 2005-11-27.
$20,375 with Defense Logistics Agency for Airframe Structural Components. Signed on 2005-03-22. Completion date: 2006-05-03.
SHACKELFORD MACHINING INC (2407 LUDELLE ST; small business) : $48,723 in 13 contractsfrom 2004 to 2006
Contracts for Nuts and Washers, Nails, Machine Keys, and Pins, Bushings, Rings, Shims, and Spacers, Bolts by Defense Logistics Agency Signed by year:2000: $0; 2001: $0; 2002: $0; 2003: $0; 2004: $12,249; 2005: $26,949; 2006: $9,525.
Biggest contracts:
$7,400 with Defense Logistics Agency for Nuts and Washers. Signed on 2005-09-06. Completion date: 2005-12-05.
$6,633 with Defense Logistics Agency for Nails, Machine Keys, and Pins. Signed on 2004-12-03. Completion date: 2005-04-02.
$4,307 with Defense Logistics Agency for Nuts and Washers. Signed on 2005-04-08. Completion date: 2005-08-07.
$3,583 with Defense Logistics Agency for Bushings, Rings, Shims, and Spacers. Signed on 2006-02-23. Completion date: 2006-07-02.
AMERICAN ELECTRO TECH, INC (2641 LUDELLE ST; small business) : $41,310 in 10 contractsfrom 2005 to 2006
Contracts for Miscellaneous Electric Power and Distribution Equipment, Cable, Cord, and Wire Assemblies: Communications Equipment by Defense Logistics Agency Signed by year:2000: $0; 2001: $0; 2002: $0; 2003: $0; 2004: $0; 2005: $27,464; 2006: $13,846.
Biggest contracts:
$7,059 with Defense Logistics Agency for Miscellaneous Electric Power and Distribution Equipment. Signed on 2005-04-22. Completion date: 2005-05-29.
$5,116 with Defense Logistics Agency for Cable, Cord, and Wire Assemblies: Communications Equipment. Signed on 2005-06-03. Completion date: 2005-07-03.
$4,539, same as above.Signed on 2005-06-04. Completion date: 2005-07-07.
$4,458, same as above.Signed on 2006-02-22. Completion date: 2006-05-22.
XS SIGHT SYSTEMS, INC (2401 LUDELLE ST; small business) : $40,805 in 3 contractsfrom 2005 to 2006
$20,436 with Navy for Guns, through 30 mm. Signed on 2005-06-13. Completion date: 2005-08-10.
$13,501, same as above.Signed on 2005-08-03. Completion date: 2005-10-01.
$6,868, same as above.Signed on 2006-06-05. Completion date: 2006-07-31.
WILL'S PRO CUSTOM MANUFACTURIN (2745 LUDELLE ST; small business) : $30,224 in 2 contractsin 2006
$25,010 with Defense Logistics Agency for Vehicular Cab, Body, and Frame Structural Components. Signed on 2006-05-24. Completion date: 2006-09-06.
$5,214 with Defense Logistics Agency for Diesel Engines and Components. Signed on 2006-06-23. Completion date: 2007-02-27.
Top industries in this zip code by the number of employees in 2005:
Educational Services: Colleges, Universities, and Professional Schools (500-999 employees: 1 establishment)
Health Care and Social Assistance: Child Day Care Services (20-49: 3, 10-19: 4, 5-9: 2, 1-4: 2)
Other Services (except Public Administration): Religious Organizations (10-19: 5, 5-9: 4, 1-4: 11)
Health Care and Social Assistance: Other Individual and Family Services (50-99: 1, 5-9: 2, 1-4: 1)
Other Services (except Public Administration): Civic and Social Organizations (50-99: 1)
Arts, Entertainment, and Recreation: Fitness and Recreational Sports Centers (50-99: 1)
Educational Services: Elementary and Secondary Schools (20-49: 1, 10-19: 2)
Health Care and Social Assistance: Child and Youth Services (20-49: 1, 5-9: 2, 1-4: 2)
Health Care and Social Assistance: Residential Mental Health and Substance Abuse Facilities (20-49: 1, 10-19: 1)
People in group quarters in 2010:
272 people in college/university student housing
84 people in correctional residential facilities
22 people in group homes intended for adults
19 people in residential treatment centers for juveniles (non-correctional)
14 people in emergency and transitional shelters (with sleeping facilities) for people experiencing homelessness
4 people in other noninstitutional facilities
People in group quarters in 2000:
244 people in college dormitories (includes college quarters off campus)
55 people in halfway houses
50 people in nursing homes
14 people in unknown juvenile institutions
8 people in homes for the mentally ill
6 people in other noninstitutional group quarters
Fatal accident statistics in 2011:
Fatal accident count: 1
Vehicles involved in fatal accidents: 1
Fatal accidents caused by drunken drivers: 1
Fatalities: 1
Persons involved in fatal accidents: 1
Pedestrians involved in fatal accidents: 0
Fatal accident statistics in 2010:
Fatal accident count: 2
Vehicles involved in fatal accidents: 3
Fatal accidents caused by drunken drivers: 2
Fatalities: 3
Persons involved in fatal accidents: 8
Pedestrians involved in fatal accidents: 0
Home Mortgage Disclosure Act Aggregated Statistics For Year 2009 (Based on 5 full and 12 partial tracts)
A) FHA, FSA/RHS & VA Home Purchase Loans
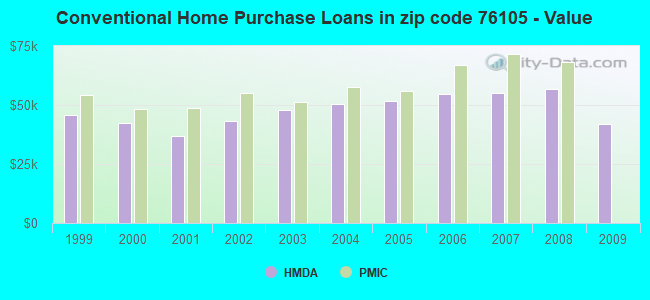
B) Conventional Home Purchase Loans
C) Refinancings
D) Home Improvement Loans
F) Non-occupant Loans on < 5 Family Dwellings (A B C & D)
G) Loans On Manufactured Home Dwelling (A B C & D)
Number
Average Value
Number
Average Value
Number
Average Value
Number
Average Value
Number
Average Value
Number
Average Value
LOANS ORIGINATED
14
$53,075
30
$41,944
17
$56,145
9
$21,757
21
$44,572
1
$20,320
APPLICATIONS APPROVED, NOT ACCEPTED
0
$0
2
$50,845
4
$48,768
2
$16,765
0
$0
0
$0
APPLICATIONS DENIED
4
$79,028
24
$41,022
74
$44,923
83
$18,643
35
$42,081
4
$18,022
APPLICATIONS WITHDRAWN
3
$91,307
1
$41,590
24
$48,258
9
$44,530
9
$41,133
0
$0
FILES CLOSED FOR INCOMPLETENESS
1
$110,220
1
$48,340
3
$64,043
8
$24,188
4
$36,312
0
$0
Aggregated Statistics For Year 2008 (Based on 5 full and 12 partial tracts)
A) FHA, FSA/RHS & VA Home Purchase Loans
B) Conventional Home Purchase Loans
C) Refinancings
D) Home Improvement Loans
E) Loans on Dwellings For 5+ Families
F) Non-occupant Loans on < 5 Family Dwellings (A B C & D)
G) Loans On Manufactured Home Dwelling (A B C & D)
Number
Average Value
Number
Average Value
Number
Average Value
Number
Average Value
Number
Average Value
Number
Average Value
Number
Average Value
LOANS ORIGINATED
17
$67,658
52
$56,842
55
$52,146
30
$30,421
0
$0
45
$63,888
2
$25,795
APPLICATIONS APPROVED, NOT ACCEPTED
4
$96,292
5
$90,292
15
$31,103
8
$21,120
0
$0
3
$82,477
0
$0
APPLICATIONS DENIED
6
$63,707
45
$66,030
175
$53,898
140
$20,070
0
$0
53
$62,338
2
$32,085
APPLICATIONS WITHDRAWN
3
$65,810
11
$59,535
32
$67,302
21
$33,326
1
$100,000
13
$55,175
0
$0
FILES CLOSED FOR INCOMPLETENESS
5
$88,732
12
$66,663
11
$54,597
7
$27,219
0
$0
1
$35,550
0
$0
Aggregated Statistics For Year 2007 (Based on 5 full and 12 partial tracts)
A) FHA, FSA/RHS & VA Home Purchase Loans
B) Conventional Home Purchase Loans
C) Refinancings
D) Home Improvement Loans
E) Loans on Dwellings For 5+ Families
F) Non-occupant Loans on < 5 Family Dwellings (A B C & D)
G) Loans On Manufactured Home Dwelling (A B C & D)
Number
Average Value
Number
Average Value
Number
Average Value
Number
Average Value
Number
Average Value
Number
Average Value
Number
Average Value
LOANS ORIGINATED
24
$65,478
203
$55,151
97
$56,522
53
$24,273
1
$449,540
134
$56,328
1
$100,170
APPLICATIONS APPROVED, NOT ACCEPTED
7
$90,324
70
$59,430
28
$55,646
11
$25,547
0
$0
38
$59,916
0
$0
APPLICATIONS DENIED
23
$69,435
148
$66,482
268
$54,885
215
$25,036
2
$134,190
119
$54,021
8
$45,899
APPLICATIONS WITHDRAWN
4
$86,330
25
$71,518
71
$63,268
24
$36,465
0
$0
18
$54,946
0
$0
FILES CLOSED FOR INCOMPLETENESS
2
$139,225
14
$73,265
24
$64,031
7
$23,957
0
$0
6
$51,513
0
$0
Aggregated Statistics For Year 2006 (Based on 5 full and 12 partial tracts)
A) FHA, FSA/RHS & VA Home Purchase Loans
B) Conventional Home Purchase Loans
C) Refinancings
D) Home Improvement Loans
E) Loans on Dwellings For 5+ Families
F) Non-occupant Loans on < 5 Family Dwellings (A B C & D)
G) Loans On Manufactured Home Dwelling (A B C & D)
Number
Average Value
Number
Average Value
Number
Average Value
Number
Average Value
Number
Average Value
Number
Average Value
Number
Average Value
LOANS ORIGINATED
25
$65,928
297
$54,817
177
$54,583
46
$24,139
2
$299,200
253
$56,491
1
$42,880
APPLICATIONS APPROVED, NOT ACCEPTED
1
$61,080
63
$52,294
32
$48,757
16
$16,379
0
$0
43
$55,670
5
$67,106
APPLICATIONS DENIED
11
$68,286
193
$58,809
311
$54,364
167
$19,954
0
$0
171
$51,831
9
$38,019
APPLICATIONS WITHDRAWN
5
$71,514
77
$62,222
130
$63,679
12
$27,247
0
$0
56
$62,810
0
$0
FILES CLOSED FOR INCOMPLETENESS
0
$0
21
$55,677
30
$66,571
3
$9,850
0
$0
13
$72,838
0
$0
Aggregated Statistics For Year 2005 (Based on 5 full and 12 partial tracts)
A) FHA, FSA/RHS & VA Home Purchase Loans
B) Conventional Home Purchase Loans
C) Refinancings
D) Home Improvement Loans
E) Loans on Dwellings For 5+ Families
F) Non-occupant Loans on < 5 Family Dwellings (A B C & D)
G) Loans On Manufactured Home Dwelling (A B C & D)
Number
Average Value
Number
Average Value
Number
Average Value
Number
Average Value
Number
Average Value
Number
Average Value
Number
Average Value
LOANS ORIGINATED
40
$71,408
213
$51,810
233
$52,586
46
$42,778
1
$1,880,000
171
$52,289
0
$0
APPLICATIONS APPROVED, NOT ACCEPTED
1
$149,350
39
$51,897
35
$42,562
14
$33,966
0
$0
28
$41,128
1
$100,000
APPLICATIONS DENIED
34
$88,500
194
$59,437
402
$48,564
182
$22,236
0
$0
143
$52,344
7
$41,107
APPLICATIONS WITHDRAWN
14
$91,190
68
$65,260
184
$65,000
50
$87,203
0
$0
39
$53,490
1
$44,000
FILES CLOSED FOR INCOMPLETENESS
3
$60,647
17
$72,471
52
$65,163
1
$28,750
0
$0
18
$58,036
0
$0
Aggregated Statistics For Year 2004 (Based on 5 full and 12 partial tracts)
A) FHA, FSA/RHS & VA Home Purchase Loans
B) Conventional Home Purchase Loans
C) Refinancings
D) Home Improvement Loans
E) Loans on Dwellings For 5+ Families
F) Non-occupant Loans on < 5 Family Dwellings (A B C & D)
G) Loans On Manufactured Home Dwelling (A B C & D)
Number
Average Value
Number
Average Value
Number
Average Value
Number
Average Value
Number
Average Value
Number
Average Value
Number
Average Value
LOANS ORIGINATED
69
$68,841
126
$50,411
211
$47,925
42
$27,371
0
$0
114
$47,542
0
$0
APPLICATIONS APPROVED, NOT ACCEPTED
2
$52,135
48
$67,340
53
$41,056
13
$19,890
0
$0
28
$49,846
0
$0
APPLICATIONS DENIED
42
$78,410
96
$56,790
425
$42,494
173
$21,028
1
$2,000,000
95
$44,932
2
$40,385
APPLICATIONS WITHDRAWN
29
$89,468
40
$58,500
145
$53,955
10
$28,815
0
$0
30
$44,958
0
$0
FILES CLOSED FOR INCOMPLETENESS
2
$90,930
13
$49,832
39
$65,243
4
$25,845
0
$0
8
$58,781
0
$0
Aggregated Statistics For Year 2003 (Based on 5 full and 12 partial tracts)
A) FHA, FSA/RHS & VA Home Purchase Loans
B) Conventional Home Purchase Loans
C) Refinancings
D) Home Improvement Loans
F) Non-occupant Loans on < 5 Family Dwellings (A B C & D)
Number
Average Value
Number
Average Value
Number
Average Value
Number
Average Value
Number
Average Value
LOANS ORIGINATED
80
$55,328
96
$47,993
210
$41,659
22
$18,128
94
$36,176
APPLICATIONS APPROVED, NOT ACCEPTED
5
$45,158
27
$50,636
34
$34,420
27
$28,719
17
$42,434
APPLICATIONS DENIED
12
$62,205
75
$52,036
393
$38,015
99
$16,292
71
$36,150
APPLICATIONS WITHDRAWN
15
$53,568
28
$43,581
138
$45,185
8
$25,746
16
$38,509
FILES CLOSED FOR INCOMPLETENESS
3
$49,063
12
$54,292
15
$43,383
2
$26,645
6
$46,113
Aggregated Statistics For Year 2002 (Based on 5 full and 12 partial tracts)
A) FHA, FSA/RHS & VA Home Purchase Loans
B) Conventional Home Purchase Loans
C) Refinancings
D) Home Improvement Loans
F) Non-occupant Loans on < 5 Family Dwellings (A B C & D)
Number
Average Value
Number
Average Value
Number
Average Value
Number
Average Value
Number
Average Value
LOANS ORIGINATED
111
$59,554
93
$43,352
151
$38,659
31
$17,965
55
$37,467
APPLICATIONS APPROVED, NOT ACCEPTED
5
$41,100
30
$37,689
38
$29,446
26
$25,197
13
$39,029
APPLICATIONS DENIED
25
$63,718
97
$44,708
227
$34,585
89
$16,638
46
$27,818
APPLICATIONS WITHDRAWN
9
$94,160
11
$51,829
129
$38,056
6
$21,983
15
$38,467
FILES CLOSED FOR INCOMPLETENESS
9
$66,993
12
$43,682
22
$37,673
0
$0
6
$35,452
Aggregated Statistics For Year 2001 (Based on 5 full and 12 partial tracts)
A) FHA, FSA/RHS & VA Home Purchase Loans
B) Conventional Home Purchase Loans
C) Refinancings
D) Home Improvement Loans
E) Loans on Dwellings For 5+ Families
F) Non-occupant Loans on < 5 Family Dwellings (A B C & D)
Number
Average Value
Number
Average Value
Number
Average Value
Number
Average Value
Number
Average Value
Number
Average Value
LOANS ORIGINATED
54
$45,485
99
$36,747
109
$35,349
45
$15,538
0
$0
39
$32,488
APPLICATIONS APPROVED, NOT ACCEPTED
3
$45,207
24
$42,399
26
$27,019
19
$12,366
1
$30,940
8
$23,589
APPLICATIONS DENIED
8
$65,826
213
$42,234
205
$32,693
108
$14,299
0
$0
25
$30,998
APPLICATIONS WITHDRAWN
6
$71,820
14
$39,499
121
$35,268
22
$22,333
0
$0
0
$0
FILES CLOSED FOR INCOMPLETENESS
0
$0
9
$41,816
11
$45,592
2
$38,450
0
$0
1
$60,560
Aggregated Statistics For Year 2000 (Based on 5 full and 12 partial tracts)
A) FHA, FSA/RHS & VA Home Purchase Loans
B) Conventional Home Purchase Loans
C) Refinancings
D) Home Improvement Loans
E) Loans on Dwellings For 5+ Families
F) Non-occupant Loans on < 5 Family Dwellings (A B C & D)
Number
Average Value
Number
Average Value
Number
Average Value
Number
Average Value
Number
Average Value
Number
Average Value
LOANS ORIGINATED
78
$47,427
104
$42,236
112
$33,039
48
$15,013
0
$0
61
$32,931
APPLICATIONS APPROVED, NOT ACCEPTED
6
$39,762
36
$37,489
38
$27,761
59
$13,963
0
$0
15
$27,277
APPLICATIONS DENIED
13
$36,798
124
$40,509
143
$30,342
119
$11,764
0
$0
39
$28,885
APPLICATIONS WITHDRAWN
12
$44,202
21
$36,086
70
$36,943
6
$7,188
1
$2,175,000
8
$32,121
FILES CLOSED FOR INCOMPLETENESS
6
$37,733
8
$34,619
38
$40,562
0
$0
0
$0
14
$40,315
Aggregated Statistics For Year 1999 (Based on 4 full and 7 partial tracts)
A) FHA, FSA/RHS & VA Home Purchase Loans
B) Conventional Home Purchase Loans
C) Refinancings
D) Home Improvement Loans
F) Non-occupant Loans on < 5 Family Dwellings (A B C & D)
2002 - 2017 National Fire Incident Reporting System (NFIRS) incidents
According to the data from the years 2002 - 2017 the average number of fires per year is 118. The highest number of fires - 190 took place in 2002, and the least - 19 in 2017. The data has a decreasing trend.
When looking into fire subcategories, the most incidents belonged to: Outside Fires (41.4%), and Structure Fires (36.5%).
Fire incident types reported to NFIRS in Zip Code 76105


 Nearest zip codes: 76103, 76119, 76104, 76112, 76111, 76102.


 According to the data from the years 2002 - 2017 the average number of fires per year is 118. The highest number of fires - 190 took place in 2002, and the least - 19 in 2017. The data has a decreasing trend.
 When looking into fire subcategories, the most incidents belonged to: Outside Fires (41.4%), and Structure Fires (36.5%).