Estimated zip code population in 2022: 34,678 Zip code population in 2010: 35,897 Zip code population in 2000: 27,677
Houses and condos: 14,735 Renter-occupied apartments: 8,170
% of renters here:
58%
State:
38%
March 2022 cost of living index in zip code 77477: 96.6 (near average, U.S. average is 100)
Land area: 10.5 sq. mi. Water area: 0.1 sq. mi.
Population density: 3,311 people per square mile
(average).
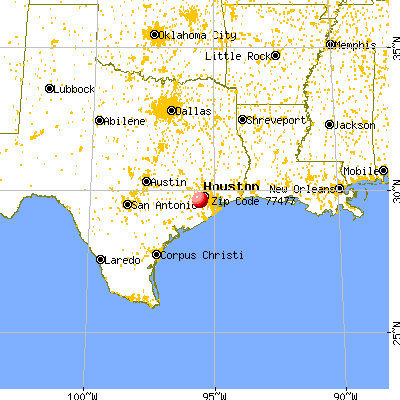
OSM Map
General Map
Google Map
MSN Map
OSM Map
General Map
Google Map
MSN Map
OSM Map
General Map
Google Map
MSN Map
OSM Map
General Map
Google Map
MSN Map
Please wait while loading the map...
Real estate property taxes paid for housing units in 2022:
This zip code:
1.5% ($3,752)
Texas:
1.5% ($4,050)
Median real estate property taxes paid for housing units with mortgages in 2022: $4,387 (1.7%) Median real estate property taxes paid for housing units with no mortgage in 2022: $3,290 (1.4%)
Estimated median house/condo value in 2022: $249,827
77477:
$249,827
Texas:
$275,400
According to our research of Texas and other state lists, there were 45 registered sex offenders living in 77477 zip code as of June 02, 2024. The ratio of all residents to sex offenders in zip code 77477 is 829 to 1. The ratio of registered sex offenders to all residents in this zip code is lower than the state average.
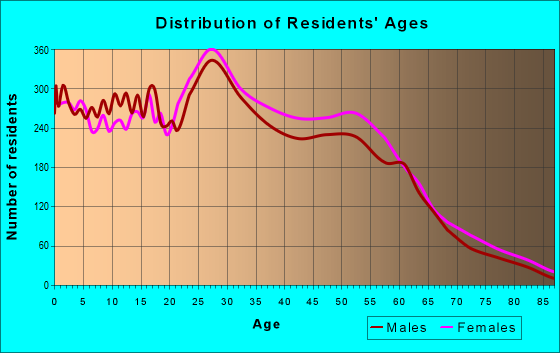
Median resident age:
This zip code:
34.1 years
Texas median age:
35.6 years
Average household size:
This zip code:
2.5 people
Texas:
2.6 people
Averages for the 2020 tax year for zip code 77477, filed in 2021:
Average Adjusted Gross Income (AGI) in 2020: $49,135 (Individual Income Tax Returns)
Here:
$49,135
State:
$77,054
Salary/wage: $45,500 (reported on 83.6% of returns)
Here:
$45,500
State:
$62,766
(% of AGI for various income ranges: 1224.0% for AGIs below $25k, 3755.8% for AGIs $25k-50k, 6812.4% for AGIs $50k-75k, 9994.3% for AGIs $75k-100k, 18710.7% for AGIs $100k-200k, 69352.5% for AGIs over 200k)
Taxable interest for individuals: $1,602 (reported on 16.1% of returns)
This zip code:
$1,602
Texas:
$2,665
(% of AGI for various income ranges: 8.4% for AGIs below $25k, 13.7% for AGIs $25k-50k, 35.1% for AGIs $50k-75k, 72.5% for AGIs $75k-100k, 133.0% for AGIs $100k-200k, 1193.8% for AGIs over 200k)
Ordinary dividends: $3,766 (reported on 10.7% of returns)
Here:
$3,766
State:
$10,044
(% of AGI for various income ranges: 7.9% for AGIs below $25k, 11.2% for AGIs $25k-50k, 38.6% for AGIs $50k-75k, 88.6% for AGIs $75k-100k, 241.1% for AGIs $100k-200k, 2952.5% for AGIs over 200k)
Net capital gain/loss in AGI: +$8,322 (reported on 10.5% of returns)
Here:
+$8,322
State:
+$39,590
(% of AGI for various income ranges: 3.2% for AGIs below $25k, 13.6% for AGIs $25k-50k, 51.7% for AGIs $50k-75k, 111.2% for AGIs $75k-100k, 416.4% for AGIs $100k-200k, 10462.5% for AGIs over 200k)
Profit/loss from business: +$4,884 (reported on 25.2% of returns)
Here:
+$4,884
State:
+$10,888
(% of AGI for various income ranges: 146.0% for AGIs below $25k, 60.6% for AGIs $25k-50k, 100.4% for AGIs $50k-75k, 268.8% for AGIs $75k-100k, 517.8% for AGIs $100k-200k, 3017.5% for AGIs over 200k)
Taxable individual retirement arrangement distribution: $18,993 (reported on 5.0% of returns)
77477:
$18,993
Texas:
$24,740
(% of AGI for various income ranges: 25.9% for AGIs below $25k, 53.9% for AGIs $25k-50k, 134.8% for AGIs $50k-75k, 316.1% for AGIs $75k-100k, 642.7% for AGIs $100k-200k, 2335.0% for AGIs over 200k)
Total itemized deductions: $30,514 (reported on 5.1% of returns)
Here:
$30,514
State:
$40,428
(% of AGI for various income ranges: 21.2% for AGIs below $25k, 109.5% for AGIs $25k-50k, 312.9% for AGIs $50k-75k, 428.0% for AGIs $75k-100k, 798.8% for AGIs $100k-200k, 5211.2% for AGIs over 200k)
Charity contributions: $13,626 (reported on 4.2% of returns)
Here:
$13,626
State:
$18,201
(% of AGI for various income ranges: 2.8% for AGIs below $25k, 27.4% for AGIs $25k-50k, 91.2% for AGIs $50k-75k, 126.7% for AGIs $75k-100k, 312.0% for AGIs $100k-200k, 3655.0% for AGIs over 200k)
Taxes paid: $6,212 (reported on 4.7% of returns)
77477:
$6,212
State:
$7,821
(% of AGI for various income ranges: 4.2% for AGIs below $25k, 19.9% for AGIs $25k-50k, 58.8% for AGIs $50k-75k, 84.8% for AGIs $75k-100k, 174.8% for AGIs $100k-200k, 736.2% for AGIs over 200k)
Earned income credit: $2,513 (reported on 23.5% of returns)
Here:
$2,513
State:
$2,584
(% of AGI for various income ranges: 129.9% for AGIs below $25k, 85.2% for AGIs $25k-50k, 1.1% for AGIs $50k-75k)
Percentage of individuals using paid preparers for their 2020 taxes: 90.7%
Here:
91%
State:
92%
(% for various income ranges: 89.6% for AGIs below $25k, 91.9% for AGIs $25k-50k, 91.7% for AGIs $50k-75k, 90.0% for AGIs $75k-100k, 89.5% for AGIs $100k-200k, 92.9% for AGIs over 200k)
Averages for the 2012 tax year for zip code 77477, filed in 2013:
Average Adjusted Gross Income (AGI) in 2012: $47,259 (Individual Income Tax Returns)
Here:
$47,259
State:
$65,384
Salary/wage: $44,403 (reported on 88.3% of returns)
Here:
$44,403
State:
$52,524
(% of AGI for various income ranges: 80.2% for AGIs below $25k, 90.4% for AGIs $25k-50k, 88.4% for AGIs $50k-75k, 85.8% for AGIs $75k-100k, 85.9% for AGIs $100k-200k, 53.9% for AGIs over 200k)
Taxable interest for individuals: $1,330 (reported on 19.4% of returns)
This zip code:
$1,330
Texas:
$2,372
(% of AGI for various income ranges: 0.6% for AGIs below $25k, 0.2% for AGIs $25k-50k, 0.4% for AGIs $50k-75k, 0.8% for AGIs $75k-100k, 0.3% for AGIs $100k-200k, 1.5% for AGIs over 200k)
Ordinary dividends: $4,609 (reported on 10.6% of returns)
Here:
$4,609
State:
$9,721
(% of AGI for various income ranges: 0.9% for AGIs below $25k, 0.5% for AGIs $25k-50k, 0.5% for AGIs $50k-75k, 1.1% for AGIs $75k-100k, 0.6% for AGIs $100k-200k, 3.8% for AGIs over 200k)
Net capital gain/loss in AGI: +$7,586 (reported on 8.2% of returns)
Here:
+$7,586
State:
+$35,319
(% of AGI for various income ranges: 0.2% for AGIs $50k-75k, 0.5% for AGIs $75k-100k, 0.6% for AGIs $100k-200k, 9.2% for AGIs over 200k)
Profit/loss from business: +$8,764 (reported on 20.1% of returns)
Here:
+$8,764
State:
+$13,732
(% of AGI for various income ranges: 13.0% for AGIs below $25k, 2.7% for AGIs $25k-50k, 2.2% for AGIs $50k-75k, 2.8% for AGIs $75k-100k, 2.3% for AGIs $100k-200k, 3.3% for AGIs over 200k)
Taxable individual retirement arrangement distribution: $15,522 (reported on 5.1% of returns)
77477:
$15,522
Texas:
$19,511
(% of AGI for various income ranges: 1.2% for AGIs below $25k, 1.1% for AGIs $25k-50k, 1.5% for AGIs $50k-75k, 1.5% for AGIs $75k-100k, 2.1% for AGIs $100k-200k, 2.8% for AGIs over 200k)
Self-employment retirement plans: $16,325 (reported on 0.3% of returns)
77477:
$16,325
Texas:
$23,938
Total itemized deductions: $19,063 (22% of AGI, reported on 20.2% of returns)
Here:
$19,063
State:
$24,724
Here:
21.7% of AGI
State:
15.9% of AGI
(% of AGI for various income ranges: 4.8% for AGIs below $25k, 7.1% for AGIs $25k-50k, 10.0% for AGIs $50k-75k, 9.5% for AGIs $75k-100k, 9.1% for AGIs $100k-200k, 6.8% for AGIs over 200k)
Charity contributions: $5,048 (reported on 16.3% of returns)
Here:
$5,048
State:
$6,808
(% of AGI for various income ranges: 0.5% for AGIs below $25k, 1.1% for AGIs $25k-50k, 1.8% for AGIs $50k-75k, 2.0% for AGIs $75k-100k, 2.4% for AGIs $100k-200k, 2.5% for AGIs over 200k)
Taxes paid: $4,269 (reported on 19.4% of returns)
77477:
$4,269
State:
$6,921
(% of AGI for various income ranges: 0.8% for AGIs below $25k, 1.2% for AGIs $25k-50k, 2.0% for AGIs $50k-75k, 2.0% for AGIs $75k-100k, 2.4% for AGIs $100k-200k, 1.6% for AGIs over 200k)
Earned income credit: $2,450 (reported on 23.8% of returns)
Here:
$2,450
State:
$2,570
(% of AGI for various income ranges: 8.7% for AGIs below $25k, 1.3% for AGIs $25k-50k)
Percentage of individuals using paid preparers for their 2012 taxes: 52.5%
Here:
53%
State:
51%
(% for various income ranges: 54.8% for AGIs below $25k, 50.1% for AGIs $25k-50k, 50.5% for AGIs $50k-75k, 52.1% for AGIs $75k-100k, 51.5% for AGIs $100k-200k, 63.6% for AGIs over 200k)
Averages for the 2004 tax year for zip code 77477, filed in 2005:
Average Adjusted Gross Income (AGI) in 2004: $41,261 (Individual Income Tax Returns)
Here:
$41,261
State:
$47,881
Salary/wage: $40,097 (reported on 90.1% of returns)
Here:
$40,097
State:
$41,947
(% of AGI for various income ranges: 109.5% for AGIs below $10k, 86.1% for AGIs $10k-25k, 92.7% for AGIs $25k-50k, 89.5% for AGIs $50k-75k, 90.3% for AGIs $75k-100k, 79.3% for AGIs over 100k)
Taxable interest for individuals: $1,251 (reported on 30.3% of returns)
This zip code:
$1,251
Texas:
$2,255
(% of AGI for various income ranges: 1.6% for AGIs below $10k, 1.2% for AGIs $10k-25k, 0.7% for AGIs $25k-50k, 0.8% for AGIs $50k-75k, 0.8% for AGIs $75k-100k, 1.2% for AGIs over 100k)
Taxable dividends: $1,455 (reported on 14.3% of returns)
Here:
$1,455
State:
$4,261
(% of AGI for various income ranges: 1.1% for AGIs below $10k, 0.4% for AGIs $10k-25k, 0.3% for AGIs $25k-50k, 0.4% for AGIs $50k-75k, 0.5% for AGIs $75k-100k, 0.7% for AGIs over 100k)
Net capital gain/loss: +$2,652 (reported on 12.3% of returns)
Here:
+$2,652
State:
+$16,110
(% of AGI for various income ranges: -1.8% for AGIs below $10k, 0.0% for AGIs $10k-25k, 0.2% for AGIs $25k-50k, 0.5% for AGIs $50k-75k, 0.7% for AGIs $75k-100k, 2.0% for AGIs over 100k)
Profit/loss from business: +$7,531 (reported on 18.2% of returns)
Here:
+$7,531
State:
+$11,013
(% of AGI for various income ranges: 10.8% for AGIs below $10k, 8.0% for AGIs $10k-25k, 2.4% for AGIs $25k-50k, 2.0% for AGIs $50k-75k, 2.0% for AGIs $75k-100k, 3.6% for AGIs over 100k)
IRA payment deduction: $3,220 (reported on 2.3% of returns)
77477:
$3,220
Texas:
$3,120
(% of AGI for various income ranges: 0.2% for AGIs $10k-25k, 0.2% for AGIs $25k-50k, 0.2% for AGIs $50k-75k, 0.2% for AGIs $75k-100k, 0.1% for AGIs over 100k)
Self-employed pension: $12,952 (reported on 0.5% of returns)
Here:
$12,952
Texas:
$16,401
Total itemized deductions: $16,092 (22% of AGI, reported on 26.3% of returns)
Here:
$16,092
State:
$19,631
Here:
21.9% of AGI
State:
18.9% of AGI
(% of AGI for various income ranges: 6.9% for AGIs below $10k, 5.9% for AGIs $10k-25k, 9.6% for AGIs $25k-50k, 11.7% for AGIs $50k-75k, 12.2% for AGIs $75k-100k, 10.5% for AGIs over 100k)
Charity contributions deductions: $3,874 (5% of AGI, reported on 22.4% of returns)
Here:
$3,874
State:
$4,753
Here:
5.0% of AGI
State:
4.2% of AGI
(% of AGI for various income ranges: 0.4% for AGIs below $10k, 0.8% for AGIs $10k-25k, 1.6% for AGIs $25k-50k, 2.4% for AGIs $50k-75k, 2.6% for AGIs $75k-100k, 2.6% for AGIs over 100k)
Total tax: $6,041 (reported on 71.7% of returns)
77477:
$6,041
State:
$9,058
(% of AGI for various income ranges: 4.0% for AGIs below $10k, 3.8% for AGIs $10k-25k, 6.6% for AGIs $25k-50k, 9.5% for AGIs $50k-75k, 11.1% for AGIs $75k-100k, 17.3% for AGIs over 100k)
Earned income credit: $1,930 (reported on 21.0% of returns)
Here:
$1,930
State:
$2,024
Percentage of individuals using paid preparers for their 2004 taxes: 52.4%
Here:
52%
State:
57%
(% for various income ranges: 47.9% for AGIs below $10k, 60.3% for AGIs $10k-25k, 51.6% for AGIs $25k-50k, 47.6% for AGIs $50k-75k, 47.0% for AGIs $75k-100k, 53.0% for AGIs over 100k)
Likely homosexual households (counted as self-reported same-sex unmarried-partner households)
Lesbian couples: 0.4% of all households
Gay men: 0.0% of all households
Household received Food Stamps/SNAP in the past 12 months: 2,243 Household did not receive Food Stamps/SNAP in the past 12 months: 11,828
Women who had a birth in the past 12 months: 482 (480 now married, 10 unmarried) Women who did not have a birth in the past 12 months: 9,049 (3,285 now married, 5,786 unmarried)
Housing units in zip code 77477 with a mortgage: 3,011 (58 second mortgage, 28 both second mortgage and home equity loan) Houses without a mortgage: 56
Median monthly owner costs for units with a mortgage: $1,686 Median monthly owner costs for units without a mortgage: $664
Residents with income below the poverty level in 2022:
This zip code:
12.0%
Whole state:
14.0%
Residents with income below 50% of the poverty level in 2022:
This zip code:
6.5%
Whole state:
7.4%
Median number of rooms in houses and condos:
Here:
6.5
State:
6.3
Median number of rooms in apartments:
Here:
3.7
State:
4.0
Notable locations in this zip code not listed on our city pages
Notable locations in zip code 77477: The Oaks Center (A), Stafford Volunteer Fire Department Station 1 (B), Stafford Volunteer Fire Department Station 2 (C), Stafford Police Department (D), Meadows Place Police Department (E), Stafford Volunteer Fire Department Station 3 (F). Display/hide their locations on the map
Shopping Centers: Dove Country Shopping Center (1), Fountains on the Lake Shopping Center (2), Meadows Center Mall Shopping Center (3), Quail Creek Center Shopping Center (4), Quail Ridge Plaza Shopping Center (5). Display/hide their locations on the map
Churches in zip code 77477 include: East Wind Missionary Baptist Church (A), Bethel Baptist Church (B), All Saints Episcopal Church (C), Calvary Church of God in Christ (D), Redeemed Christian Church of God (E), Church of Christ Murphy Road (F), Willowridge Baptist Church (G), West Side Baptist Church (H), Sugarland Chinese Baptist Church (I). Display/hide their locations on the map
In group quarters: 64 (-1 institutionalized population)
Size of family households: 3,606 2-persons, 2,491 3-persons, 1,775 4-persons, 926 5-persons, 258 6-persons, 152 7-or-more-persons
Size of nonfamily households: 3,789 1-person, 940 2-persons, 125 3-persons
3,568 married couples with children.
3,413 single-parent households (658 men, 2,755 women).
53.9% of residents of 77477 zip code speak English at home.
19.5% of residents speak Spanish at home (57% very well, 19% well, 11% not well, 13% not at all).
8.1% of residents speak other Indo-European language at home (65% very well, 26% well, 7% not well, 2% not at all).
16.8% of residents speak Asian or Pacific Island language at home (52% very well, 33% well, 11% not well, 3% not at all).
2.8% of residents speak other language at home (86% very well, 14% well).
Foreign born population: 11,919 (34.4%) (52.5% of them are naturalized citizens)
Major facilities with environmental interests located in this zip code:
ANDERSON GREENWOOD & COMPANY (3950 GREENBRIAR DRIVE in STAFFORD, TX)
CRITERIA AND HAZARDOUS AIR POLLUTANT INVENTORY (Inventory of air pollution sources) (Resource Conservation and Recovery Act (tracking hazardous waste)) HAZARDOUS WASTE BIENNIAL REPORTER (Resource Conservation and Recovery Act (tracking hazardous waste)) Small Quantity Generators, between 100 kg and 1000 kg of hazardous waste/month (Resource Conservation and Recovery Act (tracking hazardous waste)) TRI REPORTER (Tracking of toxic chemicals releasing facilities) Business SIC classification: INDUSTRIAL VALVES Business NAICS classification: INDUSTRIAL VALVE MANUFACTURING.; INDUSTRIAL VALVE MANUFACTURING. Organizations: TYCO VALVES & CONTROLS LP (CONTACT/OPERATOR)
Alternative names: ANDERSON GREENWOOD CROSBY, TYCO VALVES & CONTROLS L. P. STAFFORD
AQUA-PAK, INC. (2671 S MAIN in STAFFORD, TX)
(Integrated Compliance Information System) - ICIS-06-1998-0629, FORMAL ENFORCEMENT ACTION Business SIC classification: CHEMICALS AND CHEMICAL PREPARATIONS
ANALYSTS SERVICES INC (12715 ROYAL DR in STAFFORD, TX)
Large Quantity Generators, more that 1000 kg of hazardous waste/month (Resource Conservation and Recovery Act (tracking hazardous waste)) - notification TSD (Resource Conservation and Recovery Act (tracking hazardous waste)) - notification Organizations: FORGERONMIKE (CONTACT/OWNER)
AUTONATION USA (12202A MURPHY RD in STAFFORD, TX)
HAZARDOUS WASTE BIENNIAL REPORTER (Resource Conservation and Recovery Act (tracking hazardous waste)) (Resource Conservation and Recovery Act (tracking hazardous waste))
APOLLO PAINT & BODY SHOP INC (4121 S MAIN in STAFFORD, TX)
(Resource Conservation and Recovery Act (tracking hazardous waste))
BARNETT AUTO GROUP (12450 SOUTHWEST FREEWAY in STAFFORD, TX)
(Resource Conservation and Recovery Act (tracking hazardous waste)) Organizations: SMITHLOU (CONTACT/OPERATOR)
, MOTORS HOLDING RICK BROWN (CONTACT/OWNER)
AIR SEAL FILTER HOUSINGS (1112 STAFFORDSHIRE ROAD in STAFFORD, TX)
Small Quantity Generators, between 100 kg and 1000 kg of hazardous waste/month (Resource Conservation and Recovery Act (tracking hazardous waste)) TRI REPORTER (Tracking of toxic chemicals releasing facilities) Business SIC classification: INDUSTRIAL AND COMMERCIAL FANS AND BLOWERS AND AIR PURIFICATION EQUIPMENT Business NAICS classification: SHEET METAL WORK MANUFACTURING.
ARCHER DODGE (12053 SOUTHWEST FREEWAY in STAFFORD, TX)
AIR MINOR (AIRS/AFS) ENFORCEMENT/COMPLIANCE ACTIVITY (Integrated Compliance Information System) Business SIC classification: MOTOR VEHICLE DEALERS (NEW AND USED) Alternative names: ARCHER DODGE RV
AMAZING DRY CLEAN (11747 W BELLFORT in STAFFORD, TX)
(Resource Conservation and Recovery Act (tracking hazardous waste))
ATEC INC (12600 EXECUTIVE DRIVE in STAFFORD, TX)
Small Quantity Generators, between 100 kg and 1000 kg of hazardous waste/month (Resource Conservation and Recovery Act (tracking hazardous waste)) Business NAICS classification: OTHER COMMERCIAL AND SERVICE INDUSTRY MACHINERY MANUFACTURING.
AURORA ELECTRONICS INC (12503 EXCHANGE DR STE 554 in STAFFORD, TX)
(Resource Conservation and Recovery Act (tracking hazardous waste))
AUTOMAX INC (4214 BLUEBONNET DRIVE in STAFFORD, TX)
(Resource Conservation and Recovery Act (tracking hazardous waste))
B & B MOBILE AUTO (13003 MURPHY RD STE F1 in STAFFORD, TX)
(Resource Conservation and Recovery Act (tracking hazardous waste)) Business NAICS classification: GENERAL AUTOMOTIVE REPAIR.
Housing units lacking complete plumbing facilities: 0.4% Housing units lacking complete kitchen facilities: 1.7%
60.8%Electricity
36.1%Utility gas
1.5%No fuel used
1.4%Bottled, tank, or LP gas
Population in 1990: 18,952. Population change in the 1990s: +8,725 (+46.0%).
Place of birth for U.S.-born residents:
This state: 15,324
Northeast: 638
Midwest: 1,619
South: 3,597
West: 1,536
46% of the 77477 zip code residents lived in the same house 5 years ago. Out of people who lived in different houses, 37% lived in this county. Out of people who lived in different counties, 50% lived in Texas.
85% of the 77477 zip code residents lived in the same house 1 year ago. Out of people who lived in different houses, 27% moved from this county. Out of people who lived in different houses, 54% moved from different county within same state. Out of people who lived in different houses, 16% moved from different state. Out of people who lived in different houses, 6% moved from abroad.
Private vs. public school enrollment:
Students in private schools in grades 1 to 8 (elementary and middle school): 268
Here:
7.6%
Texas:
8.8%
Students in private schools in grades 9 to 12 (high school): 84
Here:
5.7%
Texas:
8.0%
Students in private undergraduate colleges: 157
Here:
7.1%
Texas:
16.2%
Occupation by median earnings in the past 12 months ($)
90,873Computer and mathematical occupations
83,395Health diagnosing and treating practitioners and other technical occupations
76,670Architecture and engineering occupations
70,399Life, physical, and social science occupations
69,216Business and financial operations occupations
62,888Legal occupations
Companies with biggest federal contracts located in this zip code (STAFFORD, TX):
MKM ENGINEERS, INC (4153 BLUEBONNET DRIVE; small business) : $124,753,516 in 463 contractsfrom 1999 to 2006
Contracts for Hazardous Substance Removal, Cleanup, and Disposal Services and Operational Support, Development of Environmental Impact Statements and Assessments, Other Environmental Services, Studies, and Analytical Support, Maintenance, Repair or Alteration of Real Property -- Other Conservation and Development Facilities, and moreby Army, ENERGY, Department of, Defense Logistics Agency, EPA, and others Signed by year:2000: $9,957,138; 2001: $20,332,710; 2002: $25,231,625; 2003: $28,028,343; 2004: $17,330,528; 2005: $22,347,488; 2006: $1,229,028.
Biggest contracts:
$5,991,853 with Army for Hazardous Substance Removal, Cleanup, and Disposal Services and Operational Support. Taking place in IL. Signed on 2005-07-28. Completion date: 2012-09-30.
$3,495,320, same as above.Signed on 2005-05-19. Completion date: 2012-09-30.
$2,999,767 with Army for Hazardous Substance Removal, Cleanup, and Disposal Services and Operational Support. Signed on 2003-08-20. Completion date: 2004-08-31.
$2,967,705 with Army for Development of Environmental Impact Statements and Assessments. Taking place in MI. Signed on 2002-06-04. Completion date: 2004-09-30.
PIKA INTERNATIONAL, INC (12919 SW FREEWAY STE 190; small business) : $20,072,267 in 45 contractsfrom 2004 to 2006
Contracts for Demolition of Buildings, Development of Environmental Impact Statements and Assessments, Maintenance, Repair or Alteration of Real Property -- Office Buildings, Hazardous Substance Removal, Cleanup, and Disposal Services and Operational Support, and moreby Army, Minerals Management Service, U.S. Coast Guard, U.S. Fish and Wildlife Service, and others Signed by year:2000: $0; 2001: $0; 2002: $0; 2003: $0; 2004: $2,035,153; 2005: $9,465,594; 2006: $8,571,520.
Biggest contracts:
$2,900,000 with Army for Demolition of Buildings. Taking place in OH. Signed on 2006-04-10. Completion date: 2008-04-30.
$2,336,483 with Army for Development of Environmental Impact Statements and Assessments. Signed on 2005-09-08. Completion date: 2006-04-28.
$2,010,946 with Army for Maintenance, Repair or Alteration of Real Property -- Office Buildings. Taking place in NE. Signed on 2005-09-13. Completion date: 2007-05-12.
$1,935,377 with Army for Hazardous Substance Removal, Cleanup, and Disposal Services and Operational Support. Taking place in IN. Signed on 2005-09-28. Completion date: 2006-03-31.
ATEC, INC (12600 EXECUTIVE DRIVE; small business) : $8,948,925 in 124 contractsfrom 1999 to 2006
Contracts for Aircraft Maintenance and Repair Shop Specialized Equipment, Maintenance, Repair and Rebuilding of Equipment -- Aircraft and Airframe Structural Components, Hand Tools, Power Driven, Torque Converters and Speed Changers, and moreby Navy, Defense Logistics Agency, Air Force, Army, and others Signed by year:2000: $1,148,547; 2001: $159,799; 2002: $661,201; 2003: $280,000; 2004: $654,680; 2005: $5,158,104; 2006: $779,935.
Biggest contracts:
$3,887,713 with Navy for Aircraft Maintenance and Repair Shop Specialized Equipment. Taking place in NC. Signed on 2005-05-13. Completion date: 2006-08-31.
$677,064 with Navy for Maintenance, Repair and Rebuilding of Equipment -- Aircraft and Airframe Structural Components. Signed on 2000-11-29. Completion date: 2001-09-18.
$389,304 with Defense Logistics Agency for Aircraft Maintenance and Repair Shop Specialized Equipment. Signed on 2006-03-31. Completion date: 2006-09-29.
$320,371 with Air Force for Aircraft Maintenance and Repair Shop Specialized Equipment. Signed on 2002-07-26. Completion date: 2002-07-19.
LASER SHOT INC (12818 CENTURY DR; small business) : $2,616,412 in 38 contractsfrom 2002 to 2006
Contracts for Training/Curriculum Development, Training Aids, Armament Training Devices, Operation Training Devices, and moreby Army, Federal Law Enforcement Training Center, Navy, Federal Bureau of Investigation, and others Signed by year:2000: $0; 2001: $0; 2002: $88,235; 2003: $0; 2004: $1,171,308; 2005: $1,021,991; 2006: $334,878.
Biggest contracts:
$490,691 with Army for Training/Curriculum Development. Signed on 2004-09-24. Completion date: 2004-10-15.
$290,763 with Federal Law Enforcement Training Center for Training/Curriculum Development. Taking place in NM. Signed on 2005-09-28. Completion date: 2005-10-31.
$221,128 with Navy for Training Aids. Signed on 2005-08-23. Completion date: 2006-09-15.
$195,602, same as above.Signed on 2005-08-19. Completion date: 2005-10-16.
SOUTHWEST ELECTRONIC ENERGY CO (12701 ROYAL DRIVE) : $775,609 in 15 contractsfrom 2001 to 2006
Contracts for Batteries, Nonrechargeable, Miscellaneous Electrical and Electronic Components, Ammunition Maintenance, Repair, and Checkout Specialized Equipment, Batteries, Rechargeable, and moreby Army, Navy, Air Force, Defense Logistics Agency, and others Signed by year:2000: $0; 2001: $69,600; 2002: $126,317; 2003: $445,967; 2004: $5,367; 2005: $52,733; 2006: $75,625.
Biggest contracts:
$435,125 with Army for Batteries, Nonrechargeable. Signed on 2003-11-17. Completion date: 2003-12-31.
$99,700 with Navy for Miscellaneous Electrical and Electronic Components. Signed on 2002-12-12. Completion date: 2003-01-23.
$70,428 with Air Force for Ammunition Maintenance, Repair, and Checkout Specialized Equipment. Signed on 2006-05-16. Completion date: 2006-06-20.
$69,600 with Navy for Batteries, Rechargeable. Signed on 2001-12-18. Completion date: 2002-02-15.
AMERICAN MECHANICAL SERVICES O (13627 STAFFORD RD; small business) : $759,598 in 14 contractsfrom 2000 to 2005
Contracts for Maintenance, Repair or Alteration of Real Property -- Office Buildings, Maintenance, Repair or Alteration of Real Property -- Heating and Cooling Plants, Maintenance, Repair and Rebuilding of Equipment -- Refrigeration, Air Conditioning, and Air Circulating Equipment, Maintenance, Repair or Alteration of Real Property -- Other Administrative Facilities and Service Buildings by Public Buildings Service, Navy Signed by year:2000: $488,363; 2001: $178,000; 2002: $18,375; 2003: $31,464; 2004: $32,781; 2005: $10,615; 2006: $0.
Biggest contracts:
$422,000 with Public Buildings Service for Maintenance, Repair or Alteration of Real Property -- Office Buildings. Signed on 2000-12-15. Completion date: 2001-07-15.
$135,000, same as above.Signed on 2001-05-15. Completion date: 2001-10-15.
$65,200 with Navy for Maintenance, Repair or Alteration of Real Property -- Heating and Cooling Plants. Signed on 2000-11-08. Completion date: 2000-11-20.
$43,000 with Public Buildings Service for Maintenance, Repair or Alteration of Real Property -- Office Buildings. Signed on 2001-05-15. Completion date: 2001-07-15.
MICROWAVE NETWORKS SOLUTIONS I (4000 GREENBRIAR DR STE 100; small business)
$431,167 with Army for Miscellaneous Communication Equipment. Signed on 2006-03-25. Completion date: 2006-10-30.
JFL COMMUNICATIONS, INC. (10404 CASH ROAD, BUILDING; small business) : $183,271 in 2 contractsin 1999
$107,291 with U.S. Army Corps of Engineers - civil program financing only for Miscellaneous Communication Equipment. Taking place in TN. Signed on 1999-12-13. Completion date: 1999-12-27.
$75,980 with U.S. Army Corps of Engineers - civil program financing only for Miscellaneous Communication Equipment. Signed on 1999-11-29. Completion date: 1999-12-27.
INTEGRATED GPS TECHNOLOGIES, I (4007 GREENBRIAR DR, SUITE; small business) : $140,950 in 2 contractsfrom 1999 to 2001
$96,700 with Navy for Radio and Television Communication Equipment, Except Airborne. Signed on 1999-10-06. Completion date: 1999-11-30.
$44,250 with Navy for ADP Input/Output and Storage Devices. Signed on 2001-06-25. Completion date: 2001-07-20.
CHAMPION SEATING CO , INC (111 BRAND LANE, STE 100; small business) : $109,214 in 7 contractsfrom 2004 to 2006
Contracts for Office Furniture, by Army, Navy, Department of State Signed by year:2000: $0; 2001: $0; 2002: $0; 2003: $0; 2004: $13,629; 2005: $79,571; 2006: $16,014.
Biggest contracts:
$27,842 with Army for Office Furniture. Signed on 2005-02-15. Completion date: 2005-03-14.
$18,038, same as above.Signed on 2005-05-26. Completion date: 2005-05-06.
$16,014, same as above.Signed on 2006-07-06. Completion date: 2006-08-23.
$14,992, same as above.Signed on 2005-07-19. Completion date: 2005-08-15.
Top industries in this zip code by the number of employees in 2005:
Management of Companies and Enterprises: Corporate, Subsidiary, and Regional Managing Offices (100-249: 3, 50-99: 1, 20-49: 4, 10-19: 2, 5-9: 2)
Administrative and Support and Waste Management and Remediation Services: Temporary Help Services (100-249: 3, 50-99: 2, 20-49: 1, 10-19: 1, 5-9: 1, 1-4: 1)
Health Care and Social Assistance: Home Health Care Services (250-499: 1, 20-49: 2, 5-9: 1, 1-4: 6)
People in group quarters in 2010:
7 people in other noninstitutional facilities
People in group quarters in 2000:
104 people in other noninstitutional group quarters
Fatal accident statistics in 2014:
Fatal accident count: 1
Vehicles involved in fatal accidents: 1
Fatal accidents caused by drunken drivers: 0
Fatalities: 1
Persons involved in fatal accidents: 1
Pedestrians involved in fatal accidents: 0
Fatal accident statistics in 2013:
Fatal accident count: 4
Vehicles involved in fatal accidents: 6
Fatal accidents caused by drunken drivers: 0
Fatalities: 4
Persons involved in fatal accidents: 5
Pedestrians involved in fatal accidents: 1
Home Mortgage Disclosure Act Aggregated Statistics For Year 2009 (Based on 4 full and 12 partial tracts)
A) FHA, FSA/RHS & VA Home Purchase Loans
B) Conventional Home Purchase Loans
C) Refinancings
D) Home Improvement Loans
F) Non-occupant Loans on < 5 Family Dwellings (A B C & D)
G) Loans On Manufactured Home Dwelling (A B C & D)
Number
Average Value
Number
Average Value
Number
Average Value
Number
Average Value
Number
Average Value
Number
Average Value
LOANS ORIGINATED
178
$132,155
133
$116,615
396
$123,910
30
$43,082
39
$94,424
4
$47,462
APPLICATIONS APPROVED, NOT ACCEPTED
11
$120,549
16
$144,935
71
$110,559
9
$22,102
0
$0
0
$0
APPLICATIONS DENIED
51
$122,184
48
$87,043
278
$122,088
92
$31,834
26
$83,389
6
$24,180
APPLICATIONS WITHDRAWN
25
$125,070
31
$133,439
157
$116,652
21
$32,795
10
$86,082
0
$0
FILES CLOSED FOR INCOMPLETENESS
10
$148,843
11
$115,944
48
$146,850
4
$44,262
3
$44,060
0
$0
Aggregated Statistics For Year 2008 (Based on 4 full and 12 partial tracts)
A) FHA, FSA/RHS & VA Home Purchase Loans
B) Conventional Home Purchase Loans
C) Refinancings
D) Home Improvement Loans
E) Loans on Dwellings For 5+ Families
F) Non-occupant Loans on < 5 Family Dwellings (A B C & D)
G) Loans On Manufactured Home Dwelling (A B C & D)
Number
Average Value
Number
Average Value
Number
Average Value
Number
Average Value
Number
Average Value
Number
Average Value
Number
Average Value
LOANS ORIGINATED
158
$130,290
320
$110,404
275
$112,177
60
$44,529
2
$14,826,175
67
$90,491
2
$51,750
APPLICATIONS APPROVED, NOT ACCEPTED
9
$121,399
39
$123,053
56
$115,573
18
$35,889
0
$0
12
$91,962
3
$72,023
APPLICATIONS DENIED
29
$107,607
100
$125,565
370
$114,796
156
$37,545
0
$0
44
$102,545
9
$67,153
APPLICATIONS WITHDRAWN
22
$129,901
60
$128,067
122
$115,875
13
$62,999
2
$17,236,495
9
$67,930
0
$0
FILES CLOSED FOR INCOMPLETENESS
2
$117,845
20
$145,436
35
$115,403
7
$61,803
0
$0
5
$183,878
0
$0
Aggregated Statistics For Year 2007 (Based on 4 full and 12 partial tracts)
A) FHA, FSA/RHS & VA Home Purchase Loans
B) Conventional Home Purchase Loans
C) Refinancings
D) Home Improvement Loans
F) Non-occupant Loans on < 5 Family Dwellings (A B C & D)
G) Loans On Manufactured Home Dwelling (A B C & D)
Number
Average Value
Number
Average Value
Number
Average Value
Number
Average Value
Number
Average Value
Number
Average Value
LOANS ORIGINATED
53
$132,197
701
$119,613
355
$105,102
85
$48,470
175
$102,003
2
$66,680
APPLICATIONS APPROVED, NOT ACCEPTED
2
$151,030
116
$116,031
121
$115,619
33
$38,000
31
$101,883
1
$103,930
APPLICATIONS DENIED
16
$133,761
264
$119,203
629
$113,970
164
$37,168
78
$101,767
8
$63,221
APPLICATIONS WITHDRAWN
8
$149,578
112
$132,327
252
$121,926
26
$57,290
26
$130,313
0
$0
FILES CLOSED FOR INCOMPLETENESS
0
$0
46
$116,921
101
$124,432
4
$74,218
4
$106,822
0
$0
Aggregated Statistics For Year 2006 (Based on 4 full and 12 partial tracts)
A) FHA, FSA/RHS & VA Home Purchase Loans
B) Conventional Home Purchase Loans
C) Refinancings
D) Home Improvement Loans
E) Loans on Dwellings For 5+ Families
F) Non-occupant Loans on < 5 Family Dwellings (A B C & D)
G) Loans On Manufactured Home Dwelling (A B C & D)
Number
Average Value
Number
Average Value
Number
Average Value
Number
Average Value
Number
Average Value
Number
Average Value
Number
Average Value
LOANS ORIGINATED
50
$137,947
1,212
$97,108
548
$100,987
94
$40,638
2
$27,783,570
205
$95,768
7
$54,740
APPLICATIONS APPROVED, NOT ACCEPTED
4
$107,560
284
$95,080
145
$104,096
20
$18,157
0
$0
27
$114,098
10
$39,396
APPLICATIONS DENIED
8
$125,862
349
$92,835
744
$108,110
186
$38,578
0
$0
73
$88,312
21
$45,877
APPLICATIONS WITHDRAWN
3
$126,767
146
$116,819
465
$106,114
34
$54,580
0
$0
19
$95,417
2
$134,055
FILES CLOSED FOR INCOMPLETENESS
2
$148,950
59
$85,931
151
$112,690
7
$55,760
0
$0
8
$89,805
0
$0
Aggregated Statistics For Year 2005 (Based on 4 full and 12 partial tracts)
A) FHA, FSA/RHS & VA Home Purchase Loans
B) Conventional Home Purchase Loans
C) Refinancings
D) Home Improvement Loans
E) Loans on Dwellings For 5+ Families
F) Non-occupant Loans on < 5 Family Dwellings (A B C & D)
G) Loans On Manufactured Home Dwelling (A B C & D)
Number
Average Value
Number
Average Value
Number
Average Value
Number
Average Value
Number
Average Value
Number
Average Value
Number
Average Value
LOANS ORIGINATED
52
$135,365
1,335
$93,646
664
$97,710
96
$65,206
0
$0
151
$83,375
6
$40,717
APPLICATIONS APPROVED, NOT ACCEPTED
9
$135,490
315
$88,604
160
$94,176
33
$26,767
0
$0
37
$76,053
11
$32,441
APPLICATIONS DENIED
7
$122,646
555
$90,025
964
$104,884
187
$44,958
0
$0
69
$93,480
13
$32,909
APPLICATIONS WITHDRAWN
11
$116,965
241
$94,349
507
$122,226
102
$221,241
2
$1,261,110
43
$98,386
1
$47,240
FILES CLOSED FOR INCOMPLETENESS
0
$0
89
$106,448
357
$111,872
4
$60,528
0
$0
21
$108,588
0
$0
Aggregated Statistics For Year 2004 (Based on 4 full and 12 partial tracts)
A) FHA, FSA/RHS & VA Home Purchase Loans
B) Conventional Home Purchase Loans
C) Refinancings
D) Home Improvement Loans
F) Non-occupant Loans on < 5 Family Dwellings (A B C & D)
G) Loans On Manufactured Home Dwelling (A B C & D)
Number
Average Value
Number
Average Value
Number
Average Value
Number
Average Value
Number
Average Value
Number
Average Value
LOANS ORIGINATED
100
$127,985
1,130
$96,383
916
$94,649
97
$39,001
117
$80,785
18
$44,175
APPLICATIONS APPROVED, NOT ACCEPTED
10
$99,240
295
$92,540
215
$97,957
17
$54,106
22
$95,274
11
$39,908
APPLICATIONS DENIED
28
$139,015
422
$91,119
870
$96,618
141
$36,161
54
$81,068
24
$39,037
APPLICATIONS WITHDRAWN
39
$133,157
305
$107,082
460
$101,675
40
$47,598
17
$84,593
3
$409,330
FILES CLOSED FOR INCOMPLETENESS
0
$0
62
$108,831
349
$104,911
8
$43,941
9
$98,494
0
$0
Aggregated Statistics For Year 2003 (Based on 4 full and 12 partial tracts)
A) FHA, FSA/RHS & VA Home Purchase Loans
B) Conventional Home Purchase Loans
C) Refinancings
D) Home Improvement Loans
F) Non-occupant Loans on < 5 Family Dwellings (A B C & D)
Number
Average Value
Number
Average Value
Number
Average Value
Number
Average Value
Number
Average Value
LOANS ORIGINATED
142
$121,160
806
$102,166
1,894
$91,656
105
$23,978
109
$74,001
APPLICATIONS APPROVED, NOT ACCEPTED
6
$113,773
185
$98,423
344
$92,467
33
$40,358
31
$84,798
APPLICATIONS DENIED
14
$126,343
247
$88,724
1,448
$95,416
138
$25,436
53
$76,011
APPLICATIONS WITHDRAWN
21
$126,574
120
$94,198
722
$92,258
21
$23,783
22
$64,735
FILES CLOSED FOR INCOMPLETENESS
3
$122,947
57
$108,410
122
$92,375
3
$26,203
6
$60,167
Aggregated Statistics For Year 1999 (Based on 1 full and 6 partial tracts)
A) FHA, FSA/RHS & VA Home Purchase Loans
B) Conventional Home Purchase Loans
C) Refinancings
D) Home Improvement Loans
E) Loans on Dwellings For 5+ Families
F) Non-occupant Loans on < 5 Family Dwellings (A B C & D)
2002 - 2018 National Fire Incident Reporting System (NFIRS) incidents
According to the data from the years 2002 - 2018 the average number of fire incidents per year is 86. The highest number of fire incidents - 168 took place in 2016, and the least - 23 in 2009. The data has a rising trend.
When looking into fire subcategories, the most incidents belonged to: Structure Fires (60.6%), and Outside Fires (24.4%).
Fire incident types reported to NFIRS in Zip Code 77477


 Nearest zip codes: 77031, 77478, 77099, 77071, 77489, 77072.


 According to the data from the years 2002 - 2018 the average number of fire incidents per year is 86. The highest number of fire incidents - 168 took place in 2016, and the least - 23 in 2009. The data has a rising trend.
 When looking into fire subcategories, the most incidents belonged to: Structure Fires (60.6%), and Outside Fires (24.4%).