Pocatello, ID (Idaho) Houses and Residents
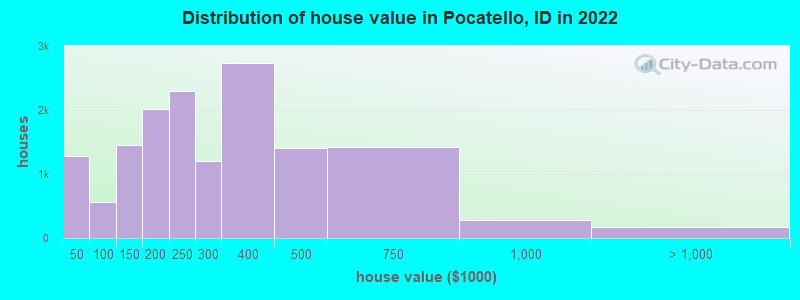
Estimated median house or condo value in 2022: $276,405 (it was $83,100 in 2000 )
Pocatello:
$276,405Idaho:
$432,500
Lower value quartile - upper value quartile: $193,868 - $380,878Mean price in 2022: Detached houses: $320,260 Here:
$320,260State:
$527,539
Townhouses or other attached units: $248,703 Here:
$248,703State:
$416,749
In 2-unit structures: $196,915 Here:
$196,915State:
$523,641
In 3-to-4-unit structures: $205,501 Here:
$205,501State:
$384,926
In 5-or-more-unit structures: $825,853 Here:
$825,853State:
$590,418
Mobile homes: $52,803 Here:
$52,803State:
$150,232
Occupied boats, RVs, vans, etc.: $61,990 Here:
$61,990State:
$136,871
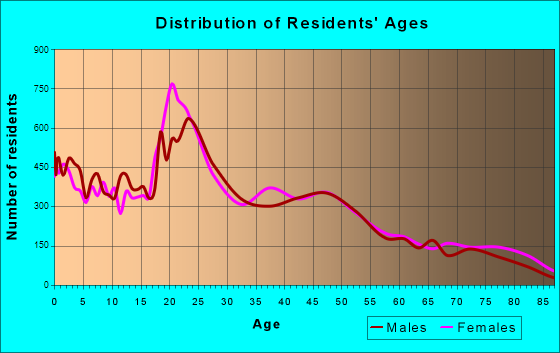
Total population: 54,292 (Urban population: 51,334, Rural population: 231 (all nonfarm) )
Houses: 24,051 (22,300 occupied: 14,490 owner occupied, 8,296 renter occupied )
% of renters here:
36%State:
28%
Housing density: 852 houses/condos per square mile
Median price asked for vacant for-sale houses and condos in 2022: $471,938.
Median contract rent in 2022: $734 (lower quartile is $569, upper quartile is $1,026)
Median rent asked for vacant for-rent units in 2022: $937
Median gross rent in Pocatello, ID in 2022: $852
Housing units in Pocatello with a mortgage: 9,406 (1,372 second mortgage, 30 home equity loan, 1,028 both second mortgage and home equity loan )Houses without a mortgage: 225
Median household income for houses/condos with a mortgage: $83,873
Median household income for apartments without a mortgage: $53,890
Median monthly housing costs: $927
Data:
Median house or condo value ($)
Median house or condo value ($ change since 2000)
Median house or condo value ($) - White
Median house or condo value ($) - Black or African American
Median house or condo value ($) - Asian
Median house or condo value ($) - Hispanic or Latino
Median house or condo value ($) - American Indian and Alaska Native
Median house or condo value ($) - Multirace
Median house or condo value ($) - Other Race
Median price asked for mobile homes ($)
Household density (households per square mile)
Mean house or condo value by units in structure - 1, detached ($)
Mean house or condo value by units in structure - 1, attached ($)
Mean house or condo value by units in structure - 2 ($)
Mean house or condo value by units in structure by units in structure - 3 or 4 ($)
Mean house or condo value by units in structure - 5 or more ($)
Mean house or condo value by units in structure - Boat, RV, van, etc. ($)
Mean house or condo value by units in structure - Mobile home ($)
Median contract rent ($)
Median contract rent - Lower quartile ($)
Median contract rent - Upper quartile ($)
Median gross rent ($)
Urban houses (%)
Rural houses (%)
Houses occupied (%)
Houses occupied (% change since 2000)
Houses owner occupied (%)
Houses owner occupied (% change since 2000)
Houses renter occupied (%)
Houses renter occupied (% change since 2000)
Vacant housing units - For rent (%)
Vacant housing units - For rent (% change since 2000)
Vacant housing units - For sale only (%)
Vacant housing units - For sale only (% change since 2000)
Vacant housing units - Rented or sold, not occupied (%)
Vacant housing units - Rented or sold, not occupied (% change since 2000)
Vacant housing units - For seasonal, recreational, or occasional use (%)
Vacant housing units - For seasonal, recreational, or occasional use (% change since 2000)
Vacant housing units - For migrant workers (%)
Vacant housing units - For migrant workers (% change since 2000)
Vacant housing units - Other vacant (%)
Vacant housing units - Other vacant (% change since 2000)
Median monthly housing costs ($)
Median household income for houses/condos with a mortgage ($)
Median household income for houses/condos without a mortgage ($)
Median household income ($)
Median household income ($) - White
Median household income ($) - Black or African American
Median household income ($) - Asian
Median household income ($) - Hispanic or Latino
Median household income ($) - American Indian and Alaska Native
Median household income ($) - Multirace
Median household income ($) - Other Race
Mortgage status - with mortgage (%)
Mortgage status - with second mortgage (%)
Mortgage status - with home equity loan (%)
Mortgage status - with both second mortgage and home equity loan (%)
Mortgage status - without a mortgage (%)
Median year house/condo built
Median year apartment built
Household type by relationship - Male householder living alone (%)
Household type by relationship - Male householder not living alone (%)
Household type by relationship - Female householder living alone (%)
Household type by relationship - Female householder not living alone (%)
Household type by relationship - Opposite-Sex spouse (%)
Household type by relationship - Same-Sex spouse (%)
Household type by relationship - Opposite-Sex unmarried partner (%)
Household type by relationship - Same-Sex unmarried partner (%)
Household type by relationship - In group quarters (%)
Size of family households - 2-person household (%)
Size of family households - 3-person household (%)
Size of family households - 4-person household (%)
Size of family households - 5-person household (%)
Size of family households - 6-person household (%)
Size of family households - 7-or-more-person household (%)
Size of nonfamily households - 1-person household (%)
Size of nonfamily households - 2-person household (%)
Size of nonfamily households - 3-person household (%)
Size of nonfamily households - 4-person household (%)
Size of nonfamily households - 5-person household (%)
Size of nonfamily households - 6-person household (%)
Size of nonfamily households - 7-or-moreperson household (%)
Year house built - Built 2010 or later (%)
Year house built - Built 2000 to 2009 (%)
Year house built - Built 1990 to 1999 (%)
Year house built - Built 1980 to 1989 (%)
Year house built - Built 1970 to 1979 (%)
Year house built - Built 1960 to 1969 (%)
Year house built - Built 1950 to 1959 (%)
Year house built - Built 1940 to 1949 (%)
Year house built - Built 1939 or earlier (%)
Median number of rooms in houses and condos
Median number of rooms in apartments
Median number of bedrooms in owner occupied houses
Mean number of bedrooms in owner occupied houses
Median number of bedrooms in renter occupied houses
Mean number of bedrooms in renter occupied houses
Median number of vehichles in owner occupied houses
Mean number of vehichles in owner occupied houses
Median number of vehichles in renter occupied houses
Mean number of vehichles in renter occupied houses
Rooms in owner-occupied houses - 1 room (%)
Rooms in owner-occupied houses - 2 rooms (%)
Rooms in owner-occupied houses - 3 rooms (%)
Rooms in owner-occupied houses - 4 rooms (%)
Rooms in owner-occupied houses - 5 rooms (%)
Rooms in owner-occupied houses - 6 rooms (%)
Rooms in owner-occupied houses - 7 rooms (%)
Rooms in owner-occupied houses - 8 rooms (%)
Rooms in owner-occupied houses - 9+ rooms (%)
Rooms in renter-occupied houses - 1 room (%)
Rooms in renter-occupied houses - 2 rooms (%)
Rooms in renter-occupied houses - 3 rooms (%)
Rooms in renter-occupied houses - 4 rooms (%)
Rooms in renter-occupied houses - 5 rooms (%)
Rooms in renter-occupied houses - 6 rooms (%)
Rooms in renter-occupied houses - 7 rooms (%)
Rooms in renter-occupied houses - 8 rooms (%)
Rooms in renter-occupied houses - 9+ rooms (%)
Bedrooms in owner-occupied houses - no bedrooms (%)
Bedrooms in owner-occupied houses - 1 bedroom (%)
Bedrooms in owner-occupied houses - 2 bedrooms (%)
Bedrooms in owner-occupied houses - 3 bedrooms (%)
Bedrooms in owner-occupied houses - 4 bedrooms (%)
Bedrooms in owner-occupied houses - 5+ bedrooms (%)
Bedrooms in renter-occupied houses - no bedrooms (%)
Bedrooms in renter-occupied houses - 1 bedroom (%)
Bedrooms in renter-occupied houses - 2 bedrooms (%)
Bedrooms in renter-occupied houses - 3 bedrooms (%)
Bedrooms in renter-occupied houses - 4 bedrooms (%)
Bedrooms in renter-occupied houses - 5+ bedrooms (%)
Vehicles available in owner-occupied houses - no vehicle available (%)
Vehicles available in owner-occupied houses - 1 vehicle available(%)
Vehicles available in owner-occupied houses - 2 Vehicles available (%)
Vehicles available in owner-occupied houses - 3 Vehicles available (%)
Vehicles available in owner-occupied houses - 4 Vehicles available (%)
Vehicles available in owner-occupied houses - 5+ Vehicles available (%)
Vehicles available in renter-occupied houses - no vehicle available (%)
Vehicles available in renter-occupied houses - 1 vehicle available (%)
Vehicles available in renter-occupied houses - 2 Vehicles available (%)
Vehicles available in renter-occupied houses - 3 Vehicles available (%)
Vehicles available in renter-occupied houses - 4 Vehicles available (%)
Vehicles available in renter-occupied houses - 5+ Vehicles available (%)
Housing units in structures - 1, detached (%)
Housing units in structures - 1, attached (%)
Housing units in structures - 2 (%)
Housing units in structures - 3 or 4 (%)
Housing units in structures - 5 to 9 (%)
Housing units in structures - 10 to 19 (%)
Housing units in structures - 20 to 49 (%)
Housing units in structures - 50 or more (%)
Housing units in structures - Mobile home (%)
Housing units in structures - Boat, RV, van, etc. (%)
Housing units in structures - Owners - 1, detached (%)
Housing units in structures - Owners - 1, attached (%)
Housing units in structures - Owners - 2 (%)
Housing units in structures - Owners - 3 or 4 (%)
Housing units in structures - Owners - 5 to 9 (%)
Housing units in structures - Owners - 10 to 19 (%)
Housing units in structures - Owners - 20 to 49 (%)
Housing units in structures - Owners - 50 or more (%)
Housing units in structures - Owners - Mobile home (%)
Housing units in structures - Owners - Boat, RV, van, etc. (%)
Housing units in structures - Renters - 1, detached (%)
Housing units in structures - Renters - 1, attached (%)
Housing units in structures - Renters - 2 (%)
Housing units in structures - Renters - 3 or 4 (%)
Housing units in structures - Renters - 5 to 9 (%)
Housing units in structures - Renters - 10 to 19 (%)
Housing units in structures - Renters - 20 to 49 (%)
Housing units in structures - Renters - 50 or more (%)
Housing units in structures - Renters - Mobile home (%)
Housing units in structures - Renters - Boat, RV, van, etc. (%)
House/condo owner moved in on average (years ago)
Renter moved in on average (years ago)
Year householder moved into unit - Moved in 1999 to March 2000 (%)
Year householder moved into unit - Moved in 1999 to March 2000 (%) - White
Year householder moved into unit - Moved in 1999 to March 2000 (%) - Black or African American
Year householder moved into unit - Moved in 1999 to March 2000 (%) - Asian
Year householder moved into unit - Moved in 1999 to March 2000 (%) - Hispanic or Latino
Year householder moved into unit - Moved in 1999 to March 2000 (%) - American Indian and Alaska Native
Year householder moved into unit - Moved in 1999 to March 2000 (%) - Multirace
Year householder moved into unit - Moved in 1999 to March 2000 (%) - Other Race
Year householder moved into unit - Moved in 1995 to 1998 (%)
Year householder moved into unit - Moved in 1995 to 1998 (%) - White
Year householder moved into unit - Moved in 1995 to 1998 (%) - Black or African American
Year householder moved into unit - Moved in 1995 to 1998 (%) - Asian
Year householder moved into unit - Moved in 1995 to 1998 (%) - Hispanic or Latino
Year householder moved into unit - Moved in 1995 to 1998 (%) - American Indian and Alaska Native
Year householder moved into unit - Moved in 1995 to 1998 (%) - Multirace
Year householder moved into unit - Moved in 1995 to 1998 (%) - Other Race
Year householder moved into unit - Moved in 1990 to 1994 (%)
Year householder moved into unit - Moved in 1990 to 1994 (%) - White
Year householder moved into unit - Moved in 1990 to 1994 (%) - Black or African American
Year householder moved into unit - Moved in 1990 to 1994 (%) - Asian
Year householder moved into unit - Moved in 1990 to 1994 (%) - Hispanic or Latino
Year householder moved into unit - Moved in 1990 to 1994 (%) - American Indian and Alaska Native
Year householder moved into unit - Moved in 1990 to 1994 (%) - Multirace
Year householder moved into unit - Moved in 1990 to 1994 (%) - Other Race
Year householder moved into unit - Moved in 1980 to 1989 (%)
Year householder moved into unit - Moved in 1980 to 1989 (%) - White
Year householder moved into unit - Moved in 1980 to 1989 (%) - Black or African American
Year householder moved into unit - Moved in 1980 to 1989 (%) - Asian
Year householder moved into unit - Moved in 1980 to 1989 (%) - Hispanic or Latino
Year householder moved into unit - Moved in 1980 to 1989 (%) - American Indian and Alaska Native
Year householder moved into unit - Moved in 1980 to 1989 (%) - Multirace
Year householder moved into unit - Moved in 1980 to 1989 (%) - Other Race
Year householder moved into unit - Moved in 1970 to 1979 (%)
Year householder moved into unit - Moved in 1970 to 1979 (%) - White
Year householder moved into unit - Moved in 1970 to 1979 (%) - Black or African American
Year householder moved into unit - Moved in 1970 to 1979 (%) - Asian
Year householder moved into unit - Moved in 1970 to 1979 (%) - Hispanic or Latino
Year householder moved into unit - Moved in 1970 to 1979 (%) - American Indian and Alaska Native
Year householder moved into unit - Moved in 1970 to 1979 (%) - Multirace
Year householder moved into unit - Moved in 1970 to 1979 (%) - Other Race
Year householder moved into unit - Moved in 1969 or earlier (%)
Year householder moved into unit - Moved in 1969 or earlier (%) - White
Year householder moved into unit - Moved in 1969 or earlier (%) - Black or African American
Year householder moved into unit - Moved in 1969 or earlier (%) - Asian
Year householder moved into unit - Moved in 1969 or earlier (%) - Hispanic or Latino
Year householder moved into unit - Moved in 1969 or earlier (%) - American Indian and Alaska Native
Year householder moved into unit - Moved in 1969 or earlier (%) - Multirace
Year householder moved into unit - Moved in 1969 or earlier (%) - Other Race
Housing units lacking complete plumbing facilities (%)
Housing units lacking complete kitchen facilities (%)
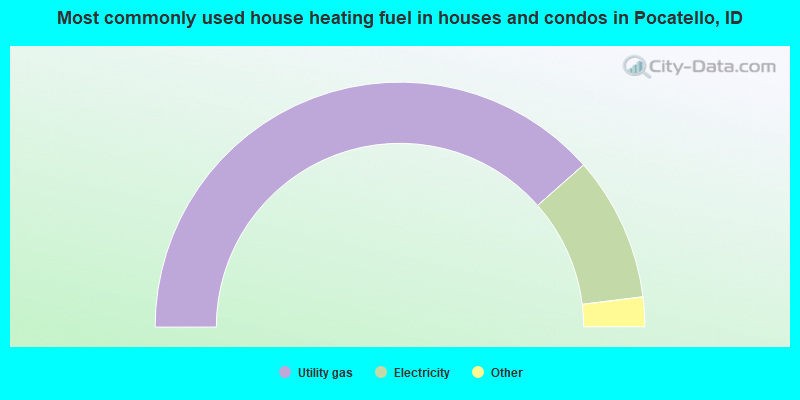
House heating fuel used in houses and condos - Utility gas (%)
House heating fuel used in houses and condos - Bottled, tank, or LP gas (%)
House heating fuel used in houses and condos - Electricity (%)
House heating fuel used in houses and condos - Fuel oil, kerosene, etc. (%)
House heating fuel used in houses and condos - Coal or coke (%)
House heating fuel used in houses and condos - Wood (%)
House heating fuel used in houses and condos - Solar energy (%)
House heating fuel used in houses and condos - Other fuel (%)
House heating fuel used in houses and condos - No fuel used (%)
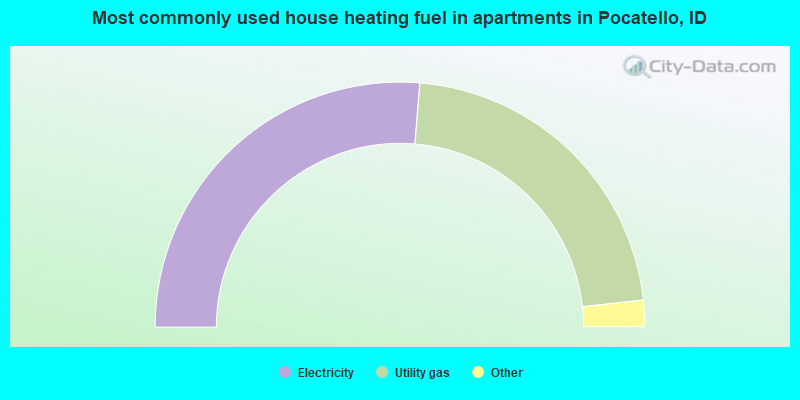
House heating fuel used in apartments - Utility gas (%)
House heating fuel used in apartments - Bottled, tank, or LP gas (%)
House heating fuel used in apartments - Electricity (%)
House heating fuel used in apartments - Fuel oil, kerosene, etc. (%)
House heating fuel used in apartments - Coal or coke (%)
House heating fuel used in apartments - Wood (%)
House heating fuel used in apartments - Solar energy (%)
House heating fuel used in apartments - Other fuel (%)
House heating fuel used in apartments - No fuel used (%)
Latest news about housing in Pocatello, ID collected exclusively by city-data.com from local newspapers, TV, and radio stations
Median year house/condo built: 1970Median year apartment built: 1970Household type by relationship:
Households: 57,929
Male householders: 11,757 (4,061 living alone ), Female householders: 10,415 (3,642 living alone )9,949 spouses (9,864 opposite-sex spouses ), 1,586 unmarried partners , (1,441 opposite-sex unmarried partners ), 16,544 children (15,044 natural , 460 adopted , 1,040 stepchildren ), 1,047 grandchildren , 366 brothers or sisters , 469 parents , 22 foster children , 608 other relatives , 2,150 non-relatives In group quarters: 3,011
Size of family households: 5,257 2-persons , 2,665 3-persons , 2,356 4-persons , 1,488 5-persons , 835 6-persons , 369 7-or-more-persons .
Size of nonfamily households: 7,651 1-person , 1,611 2-persons , 401 3-persons , 138 4-persons , 33 5-persons , 16 7-or-more-persons .
9,947 married couples with children. single-parent households (628 men , 2,088 women ).
94.1% of residents of Pocatello speak English at home. of residents speak Spanish at home (80% speak English very well , 10% speak English well , 8% speak English not well , 2% don't speak English at all ).of residents speak other Indo-European language at home (54% speak English very well , 21% speak English well , 22% speak English not well , 2% don't speak English at all ).of residents speak Asian or Pacific Island language at home (57% speak English very well , 34% speak English well , 9% speak English not well ).of residents speak other language at home (61% speak English very well , 38% speak English well , 1% speak English not well ).
Foreign born population: 2,836 (4.9%)of them are naturalized citizens )
Median number of rooms in houses and condos:
Median number of rooms in apartments
Owner-occupied Renter-occupied
Rooms in owner-occupied houses in Pocatello, Idaho
69 1 room 113 2 rooms 261 3 rooms 1,069 4 rooms 1,979 5 rooms 1,710 6 rooms 2,407 7 rooms 2,291 8 rooms 4,592 9+ rooms
Rooms in renter-occupied apartments in Pocatello, Idaho
585 1 room 520 2 rooms 987 3 rooms 2,085 4 rooms 1,915 5 rooms 1,069 6 rooms 463 7 rooms 411 8 rooms 261 9+ rooms
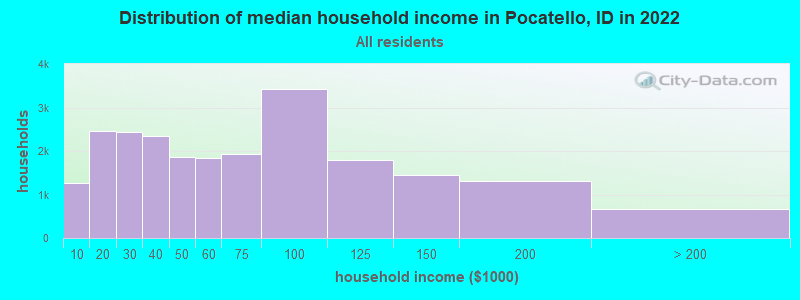
Pocatello, ID household income distribution 1,273 Less than $10,0002,460 $10,000 to $19,9992,443 $20,000 to $29,9992,342 $30,000 to $39,9991,873 $40,000 to $49,9991,833 $50,000 to $59,9991,941 $60,000 to $74,9993,432 $75,000 to $99,9991,802 $100,000 to $124,9991,444 $125,000 to $149,9991,311 $150,000 to $199,999671 $200,000 or more
Home value of owner - occupied houses in 2022 in Pocatello, ID 506 Less than $10,00067 $10,000 to $14,999172 $15,000 to $19,999116 $20,000 to $24,999190 $25,000 to $29,999117 $30,000 to $34,99959 $35,000 to $39,99948 $40,000 to $49,99933 $50,000 to $59,999149 $60,000 to $69,99922 $70,000 to $79,999111 $80,000 to $89,999193 $90,000 to $99,999640 $100,000 to $124,999807 $125,000 to $149,999961 $150,000 to $174,9991,056 $175,000 to $199,9992,298 $200,000 to $249,9991,209 $250,000 to $299,9992,734 $300,000 to $399,9991,410 $400,000 to $499,9991,428 $500,000 to $749,999288 $750,000 to $999,999138 $1,000,000 to $1,499,99938 $2,000,000 or moreRent paid by renters in 2022 in Pocatello, ID 23 Less than $10053 $100 to $149318 $150 to $19935 $200 to $249184 $250 to $299193 $300 to $349103 $350 to $399316 $400 to $449265 $450 to $499429 $500 to $549390 $550 to $599299 $600 to $649799 $650 to $699675 $700 to $749392 $750 to $799501 $800 to $899715 $900 to $9991,530 $1,000 to $1,249377 $1,250 to $1,499164 $1,500 to $1,99945 $2,500 to $2,999173 No cash rent
Percentage of workers working in this county: 85.3%Number of people working at home: 2,331 (8.7% of all workers )
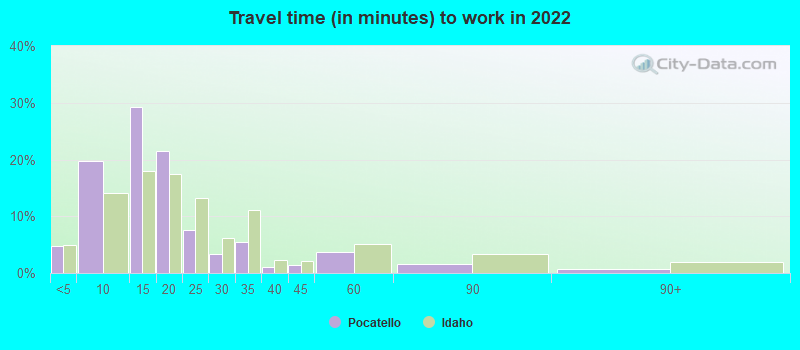
Travel time to work (commute)
Less than 5 minutes: 1,4505 to 9 minutes: 5,59510 to 14 minutes: 6,98615 to 19 minutes: 4,49820 to 24 minutes: 1,88925 to 29 minutes: 38330 to 34 minutes: 1,29335 to 39 minutes: 8440 to 44 minutes: 14645 to 59 minutes: 56060 to 89 minutes: 90790 or more minutes: 380
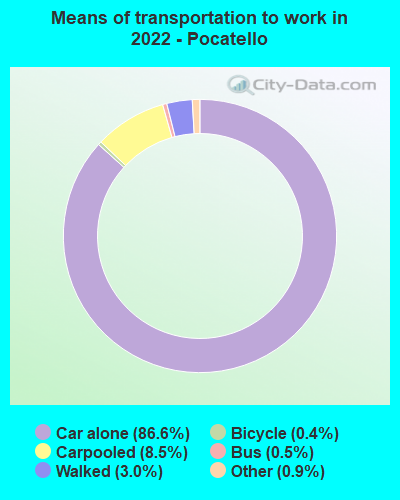
Means of transportation to work:
Drove a car alone: 23,489 (77.7%)Carpooled: 2,706 (9.0%)Bus : 209 (0.7%)Taxi: 491 (1.6%)Bicycle: 107 (0.4%)Walked: 776 (2.6%)Worked at home: 2,331 (7.7%)
Unemployment by race in 2022
Unemployment rate for White non-Hispanic residents 7.8% Males1.9% FemalesUnemployment rate for Black residents 23.0% MalesUnemployment rate for American Indian and Alaska Native residents 16.1% MalesUnemployment rate for Asian residents 1.1% MalesUnemployment rate for two or more race residents 4.5% Males4.8% FemalesUnemployment rate for Hispanic or Latino residents 17.5% Males0.7% Females
Year of entry for the foreign-born population in Pocatello, Idaho
1,134 2010 or later 453 2000 to 2009 278 1990 to 1999 247 1980 to 1989 167 1970 to 1979 302 Before 1970
First ancestries reported:
English: 5,066 (21.6%)
American: 2,859 (12.2%)
German: 1,831 (7.8%)
European: 1,296 (5.5%)
Irish: 1,187 (5.1%)
Norwegian: 488 (2.1%)
Scottish: 486 (2.1%)
Swedish: 460 (2.0%)
Danish: 326 (1.4%)
Italian: 293 (1.2%)
Welsh: 249 (1.1%)
Polish: 177 (0.8%)
French: 163 (0.7%)
Scandinavian: 162 (0.7%)
British: 138 (0.6%)
Scotch-Irish: 130 (0.6%)
Dutch: 112 (0.5%)
Northern European: 94 (0.4%)
Basque: 81 (0.3%)
Iranian: 77 (0.3%)
Swiss: 65 (0.3%)
Belgian: 60 (0.3%)
Ethiopian: 54 (0.2%)
French Canadian: 50 (0.2%)
Romanian: 44 (0.2%)
Russian: 44 (0.2%)
Armenian: 34 (0.1%)
Afghan: 33 (0.1%)
Portuguese: 28 (0.1%)
Brazilian: 28 (0.1%)
Eastern European: 26 (0.1%)
Nigerian: 26 (0.1%)
Greek: 24 (0.1%)
Ghanaian: 23 (0.10%)
Pennsylvania German: 21 (0.09%)
New Zealander: 17 (0.07%)
Czech: 17 (0.07%)
Ukrainian: 16 (0.07%)
Assyrian: 13 (0.06%)
Canadian: 13 (0.06%)
Icelander: 12 (0.05%)
Egyptian: 9 (0.04%)
Austrian: 9 (0.04%)
African: 9 (0.04%)
Lithuanian: 8 (0.03%)
Slovak: 8 (0.03%)
Croatian: 7 (0.03%)
Most common places of birth for foreign-born residents (%): Mexico Pocatello:
12.6% (285)Idaho:
49.9% (53,107)
Colombia Pocatello:
6.4% (145)Idaho:
1.2% (1,289)
Canada Pocatello:
6.3% (142)Idaho:
5.2% (5,503)
Indonesia Pocatello:
5.6% (127)Idaho:
0.3% (307)
England Pocatello:
4.3% (98)Idaho:
1.5% (1,595)
Japan Pocatello:
4.3% (96)Idaho:
0.8% (867)
India Pocatello:
4.0% (91)Idaho:
2.0% (2,143)
Thailand Pocatello:
3.9% (87)Idaho:
0.6% (679)
Philippines Pocatello:
3.7% (84)Idaho:
2.1% (2,230)
Other Eastern Europe Pocatello:
3.2% (72)Idaho:
0.2% (177)
Germany Pocatello:
3.1% (69)Idaho:
2.4% (2,535)
China, excluding Hong Kong and Taiwan Pocatello:
3.0% (67)Idaho:
2.1% (2,219)
Afghanistan Pocatello:
2.8% (64)Idaho:
0.4% (465)
Nigeria Pocatello:
2.8% (62)Idaho:
0.2% (246)
Saudi Arabia Pocatello:
2.6% (59)Idaho:
0.3% (318)
Nepal Pocatello:
2.4% (54)Idaho:
1.0% (1,091)
Korea Pocatello:
2.1% (48)Idaho:
1.7% (1,802)
Vietnam Pocatello:
2.0% (44)Idaho:
1.2% (1,257)
Iran Pocatello:
1.9% (43)Idaho:
0.6% (622)
Romania Pocatello:
1.9% (42)Idaho:
0.5% (520)
United Kingdom, excluding England and Scotland Pocatello:
1.7% (39)Idaho:
0.7% (771)
Place of birth for U.S.-born residents:
This state: 32,900Other state: 21,623Northeast: 827Midwest: 2,319South: 2,647West: 15,847 81.8% of Pocatello residents lived in the same house 1 years ago.
Out of people who lived in different houses, 32.4% lived in this county.
Out of people who lived in different counties, 51.7% lived in Idaho.
Pocatello:
81.8%State average:
85.1%
Education attainment for males 25 years and older:
No schooling: 83Nursery to 4th grade: 05th and 6th grade: 297th and 8th grade: 769th grade: 12410th grade: 31211th grade: 34012th grade, no diploma: 270High school graduate (or equivalency): 4,978Less than 1 year of college: 1,623Some college more than 1 year, no degree: 2,911Associate degree: 1,567Bachelor's degree: 3,648Master's degree: 745Professional school degree: 397Doctorate degree: 906
Education attainment for females 25 years and older:
No schooling: 145Nursery to 4th grade: 35th and 6th grade: 1047th and 8th grade: 1109th grade: 23410th grade: 32511th grade: 15512th grade, no diploma: 258High school graduate (or equivalency): 4,223Less than 1 year of college: 1,507Some college more than 1 year, no degree: 3,693Associate degree: 1,813Bachelor's degree: 3,733Master's degree: 1,903Professional school degree: 171Doctorate degree: 206
Housing units in structures:
One, detached: 15,126One, attached: 1,285Two: 1,5483 or 4: 1,6535 to 9: 1,00710 to 19: 69620 to 49: 55650 or more: 350Mobile homes: 1,714Boats, RVs, vans, etc.: 113Median worth of mobile homes: $40,625
Housing units lacking complete plumbing facilities in 2022: 0.6%Housing units lacking complete kitchen facilities in 2022: 1.5%House/condo owner moved in on average 10 years ago
Renter moved in on average 1 years ago
Private vs. public school enrollment:
Students in private schools in grades 1 to 8 (elementary and middle school): 778 Students in private schools in grades 9 to 12 (high school): 88 Students in private undergraduate colleges: 305