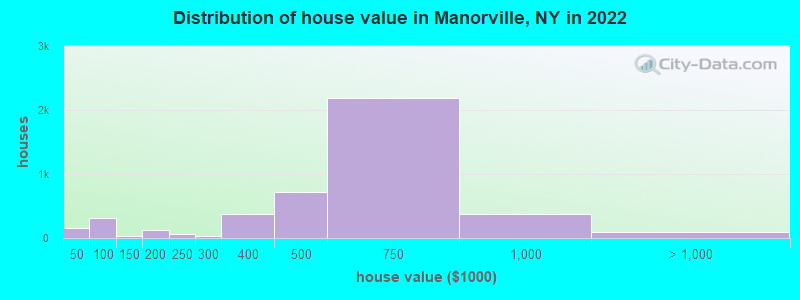
Estimated median house or condo value in 2022: $580,168 (it was $189,800 in 2000)
Manorville:
$580,168
NY:
$400,400
Mean prices in 2022:all housing units: $648,309; detached houses: $664,885; townhouses or other attached units: $541,828; in 2-unit structures: $735,387; in 3-to-4-unit structures: $523,799; in 5-or-more-unit structures: $413,065; mobile homes: $230,025
Median gross rent in 2022: $2,230.
March 2022 cost of living index in Manorville: 150.7 (very high, U.S. average is 100)
Percentage of residents living in poverty in 2022: 10.2%
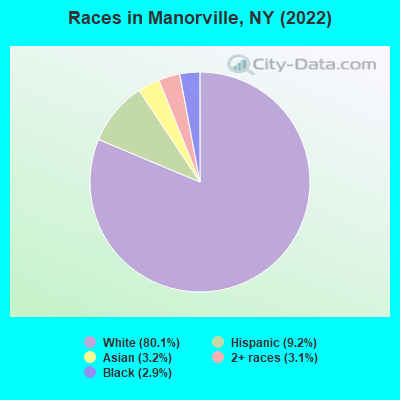
(8.4% for White Non-Hispanic residents, 15.8% for Black residents, 30.7% for Hispanic or Latino residents, 25.8% for other race residents, 31.8% for two or more races residents)
According to our research of New York and other state lists, there were 3 registered sex offenders living in Manorville, New York as of June 12, 2024. The ratio of all residents to sex offenders in Manorville is 4,943 to 1. The ratio of registered sex offenders to all residents in this city is much lower than the state average.
Recent articles from our blog. Our writers, many of them Ph.D. graduates or candidates, create easy-to-read articles on a wide variety of topics.
Latest news from Manorville, NY collected exclusively by city-data.com from local newspapers, TV, and radio stations
Ancestries: Italian (43.0%), Irish (10.1%), German (7.1%), Polish (4.9%), American (3.0%), Hungarian (1.7%).
Current Local Time: EST time zone
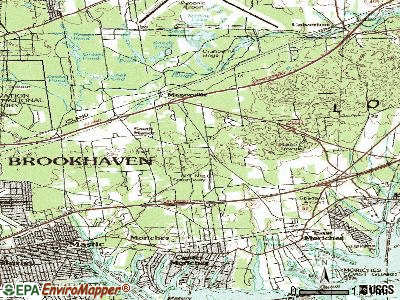
Land area: 25.4 square miles.
Population density: 564 people per square mile (low).
1,057 residents are foreign born (3.6% Europe, 3.0% Asia, 1.5% Latin America).
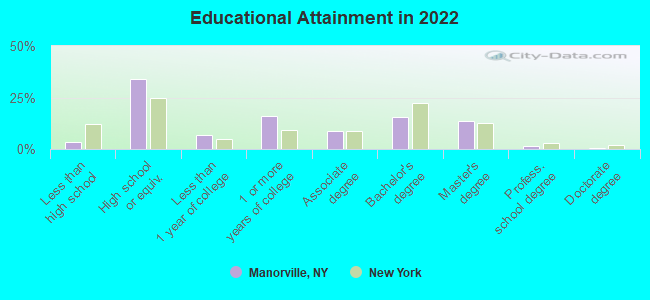
This place:
8.3%
New York:
22.6%
Median real estate property taxes paid for housing units with mortgages in 2022: $10,001 (1.6%) Median real estate property taxes paid for housing units with no mortgage in 2022: $8,463 (1.7%)
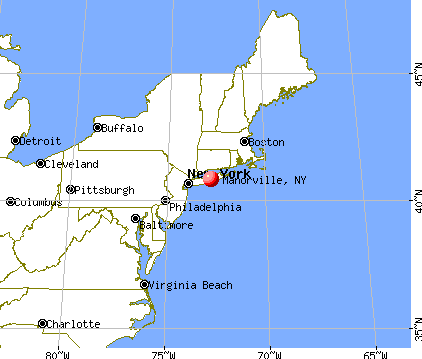
Nearest city with pop. 50,000+: Brentwood, NY (24.0 miles , pop. 53,917).
Nearest city with pop. 200,000+: North Hempstead, NY (46.0 miles , pop. 222,611).
Nearest city with pop. 1,000,000+: Queens, NY (54.6 miles , pop. 2,229,379).
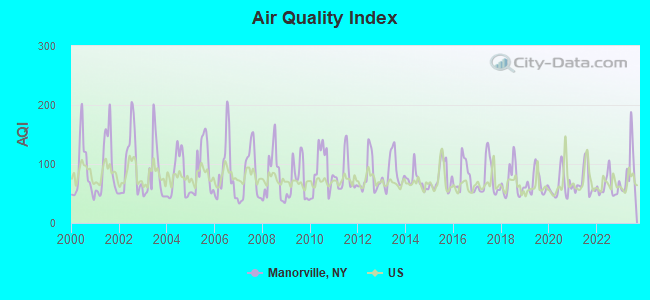
Air Quality Index (AQI) level in 2023 was 87.8. This is worse than average.
City:
87.8
U.S.:
72.6
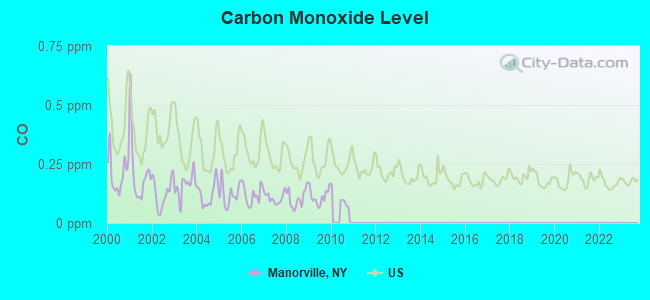
Carbon Monoxide (CO) [ppm] level in 2009 was 0.112. This is significantly better than average.Closest monitor was 13.9 miles away from the city center.
City:
0.112
U.S.:
0.251
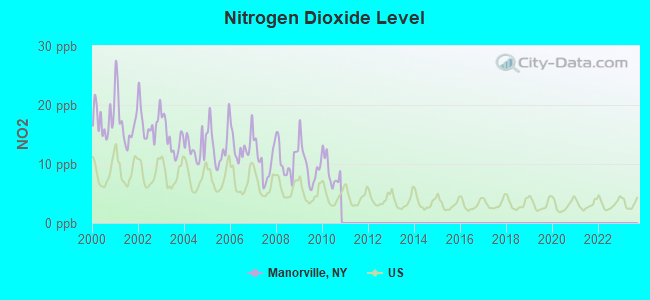
Nitrogen Dioxide (NO2) [ppb] level in 2010 was 8.78. This is significantly worse than average.Closest monitor was 8.1 miles away from the city center.
City:
8.78
U.S.:
5.11
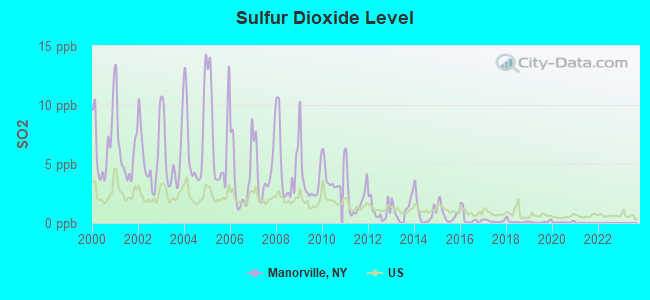
Sulfur Dioxide (SO2) [ppb] level in 2020 was 0.0629. This is significantly better than average.Closest monitor was 8.1 miles away from the city center.
City:
0.0629
U.S.:
1.5147
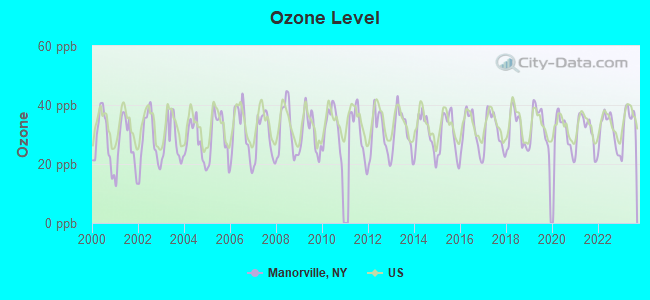
Ozone [ppb] level in 2023 was 34.6. This is about average.Closest monitor was 8.9 miles away from the city center.
City:
34.6
U.S.:
33.3
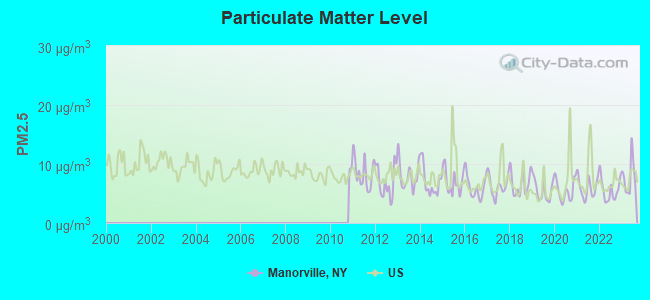
Particulate Matter (PM2.5) [µg/m3] level in 2023 was 7.79. This is about average.There were 0 monitors within city limits.
City:
7.79
U.S.:
8.11
Tornado activity:
Manorville-area historical tornado activity is near New York state average. It is 65% smaller than the overall U.S. average.
On 7/10/1989, a category F4 (max. wind speeds 207-260 mph) tornado 33.3 miles away from the Manorville place center injured 40 peopleand causedbetween $50,000,000 and $500,000,000 in damages.
On 7/10/1989, a category F2 (max. wind speeds 113-157 mph) tornado 2.1 miles away from the place center injured one person.
Earthquake activity:
Manorville-area historical earthquake activity is significantly above New York state average. It is 72% smaller than the overall U.S. average.
On 10/7/1983 at 10:18:46, a magnitude 5.3 (5.1 MB, 5.3 LG, 5.1 ML, Class: Moderate, Intensity: VI - VII) earthquake occurred 228.8 miles away from Manorville center On 8/23/2011 at 17:51:04, a magnitude 5.8 (5.8 MW, Depth: 3.7 mi) earthquake occurred 341.8 miles away from Manorville center On 4/20/2002 at 10:50:47, a magnitude 5.3 (5.3 ML, Depth: 3.0 mi) earthquake occurred 257.6 miles away from Manorville center On 8/22/1992 at 12:20:32, a magnitude 4.8 (4.8 MB, 3.8 MS, 4.7 LG, Depth: 6.2 mi, Class: Light, Intensity: IV - V) earthquake occurred 178.1 miles away from Manorville center On 4/20/2002 at 10:50:47, a magnitude 5.2 (5.2 MB, 4.2 MS, 5.2 MW, 5.0 MW) earthquake occurred 256.0 miles away from the city center On 1/19/1982 at 00:14:42, a magnitude 4.7 (4.5 MB, 4.7 MD, 4.5 LG) earthquake occurred 193.4 miles away from the city center Magnitude types: regional Lg-wave magnitude (LG), body-wave magnitude (MB), duration magnitude (MD), local magnitude (ML), surface-wave magnitude (MS), moment magnitude (MW)
Natural disasters:
The number of natural disasters in Suffolk County (28) is a lot greater than the US average (15). Major Disasters (Presidential) Declared: 19 Emergencies Declared: 7
Causes of natural disasters: Hurricanes: 9, Floods: 7, Storms: 7, Snowstorms: 4, Winter Storms: 3, Blizzards: 2, Heavy Rain: 1, Power Outage: 1, Tropical Depression: 1, Tropical Storm: 1, Water Shortage: 1, Other: 3 (Note: some incidents may be assigned to more than one category).
Hospitals and medical centers in Manorville:
INDEPENDENT GROUP HOME LIVING PROGRAM, INC (288 CHAPMAN BLVD)
INDEPENDENT GROUP HOME LIVING PROGRAM, INC (44 WOODLAND AVE)
MARYHAVEN CENTER OF HOPE, INC (226 EASTPORT MANOR RD)
Colleges/universities with over 2000 students nearest to Manorville:
Suffolk County Community College (about 14 miles; Selden, NY; Full-time enrollment: 18,540)
Stony Brook University (about 18 miles; Stony Brook, NY; FT enrollment: 22,071)
Dowling College (about 21 miles; Oakdale, NY; FT enrollment: 2,598)
Porter and Chester Institute of Stratford (about 29 miles; Stratford, CT; FT enrollment: 2,822)
University of Bridgeport (about 31 miles; Bridgeport, CT; FT enrollment: 3,708)
Housatonic Community College (about 31 miles; Bridgeport, CT; FT enrollment: 3,677)
University of New Haven (about 32 miles; West Haven, CT; FT enrollment: 6,205)
Notable locations in Manorville: Rock Hill Country Club (A), New York National Speedway (B), Pine Hills Country Club (C), Long Island Game Farm (D), Manorville Fire Department (E). Display/hide their locations on the map
Churches in Manorville include: Brookfield Presbyterian Church (A), Manorville Community Church (B), Saint Peter and Paul Roman Catholic Church (C). Display/hide their locations on the map
Cemeteries: Brookfield Cemetery (1), Old Presbyterian Cemetery (2), Robinson and Gordon Private Graveyard (3), Wines Private Graveyard (4), Methodist Cemetery (5). Display/hide their locations on the map
Tourist attractions: Long Island Game Farm Wild Life Park (Petting Zoos; Chapman Boulevard) (1), Petting Zoo (Petting Zoos; 184 Wading River Manor R) (2). Display/hide their approximate locations on the map
Suffolk County has a predicted average indoor radon screening level less than 2 pCi/L (pico curies per liter) - Low Potential
Drinking water stations with addresses in Manorville and their reported violations in the past:
LONG ISLAND GAME FARM (Population served: 200, Groundwater):
Past health violations:
MCL, Monthly (TCR) - Between JUL-2012 and SEP-2012, Contaminant: Coliform. Follow-up actions: St Public Notif requested (SEP-13-2012), St Formal NOV issued (SEP-13-2012), St Compliance achieved (OCT-12-2012)
MCL, Acute (TCR) - Between JUL-2011 and SEP-2011, Contaminant: Coliform. Follow-up actions: St Formal NOV issued (JUL-13-2011), St Public Notif requested (JUL-13-2011), St Compliance achieved (AUG-09-2011)
MCL, Monthly (TCR) - In MAR-2011, Contaminant: Coliform. Follow-up actions: St Public Notif requested (MAY-06-2011), St Formal NOV issued (MAY-06-2011), St Compliance achieved (AUG-09-2011)
Past monitoring violations:
One regular monitoring violation
ROCK HILL COUNTRY CLUB (Population served: 150, Groundwater):
Past health violations:
MCL, Monthly (TCR) - Between JAN-2012 and MAR-2012, Contaminant: Coliform. Follow-up actions: St Public Notif requested (MAR-28-2012), St Formal NOV issued (MAR-28-2012), St Compliance achieved (MAY-20-2013)
Average household size:
This place:
2.8 people
New York:
2.6 people
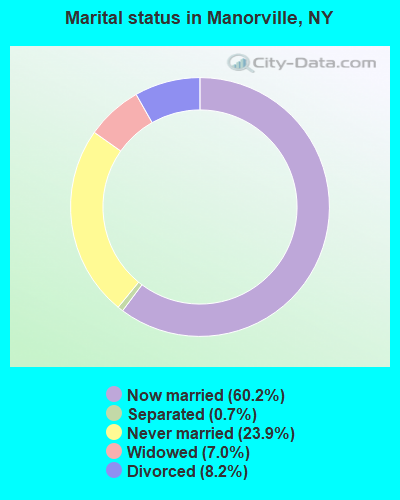
Percentage of family households:
This place:
72.6%
Whole state:
63.5%
Percentage of households with unmarried partners:
This place:
5.5%
Whole state:
6.8%
Likely homosexual households (counted as self-reported same-sex unmarried-partner households)
Lesbian couples: 0.4% of all households
Gay men: 0.5% of all households
People in group quarters in Manorville in 2010:
76 people in group homes intended for adults
12 people in residential treatment centers for adults
2 people in other noninstitutional facilities
48 people in homes for the mentally retarded in 2000
3 people in religious group quarters in 2000
Banks with branches in Manorville (2011 data):
The Suffolk County National Bank of Riverhead: Manorville Branch at 460 County Road 111 Ste 18, branch established on 2002/06/17. Info updated 2012/01/10: Bank assets: $1,483.9 mil, Deposits: $1,312.3 mil, headquarters in Riverhead, NY, positive income, Commercial Lending Specialization, 30 total offices, Holding Company: Suffolk Bancorp
Capital One, National Association: Manorville Branch at 485 County Road 111, branch established on 2003/05/02. Info updated 2011/07/01: Bank assets: $133,477.8 mil, Deposits: $97,063.7 mil, headquarters in Mclean, VA, positive income, 984 total offices, Holding Company: Capital One Financial Corporation
Religion statistics for Manorville, NY (based on Suffolk County data)
Religion
Adherents
Congregations
Catholic
879,457
75
Mainline Protestant
69,205
182
Evangelical Protestant
58,909
264
Other
50,771
124
Orthodox
10,190
10
Black Protestant
8,298
49
None
416,520
-
Source: Clifford Grammich, Kirk Hadaway, Richard Houseal, Dale E.Jones, Alexei Krindatch, Richie Stanley and Richard H.Taylor. 2012. 2010 U.S.Religion Census: Religious Congregations & Membership Study. Association of Statisticians of American Religious Bodies. Jones, Dale E., et al. 2002. Congregations and Membership in the United States 2000. Nashville, TN: Glenmary Research Center. Graphs represent county-level data
Aircraft: CESSNA 172N (Category: Land, Seats: 4, Weight: Up to 12,499 Pounds, Speed: 105 mph), Engine: LYCOMING 0-320 SERIES (180 HP) (Reciprocating) N-Number: 2448E, N2448E, N-2448E, Serial Number: 17271288, Airworthiness Date: 08/31/1978, Certificate Issue Date: 07/05/2018 Registrant (Corporation): Pwc Engine Air Inc, 418 Wading River Rd, Manorville, NY 11949
Aircraft: AERONCA 7BCM (Category: Land, Seats: 2, Weight: Up to 12,499 Pounds, Speed: 90 mph), Engine: CONT MOTOR C85 SERIES (85 HP) (Reciprocating) N-Number: 814NG, N814NG, N-814NG, Serial Number: 7BCM-28, Year manufactured: 1947, Certificate Issue Date: 10/11/2019 Registrant (Co-Owned): Patrick J Peyton, 157 Gothic Cir, Manorville, NY 11949, Other Owners: John L Schulz
Aircraft: AERONCA 7AC (Category: Land, Seats: 2, Weight: Up to 12,499 Pounds, Speed: 90 mph), Engine: CONT MOTOR A&C65 SERIES (65 HP) (Reciprocating) N-Number: 83098, N83098, N-83098, Serial Number: 7AC-1755, Year manufactured: 1946, Airworthiness Date: 08/23/1955 Registrant (Individual): Reported Sale, 2 Easterly Court, Manorville, NY 11940
Aircraft: PIPER PA-32-300 (Category: Land, Seats: 6, Weight: Up to 12,499 Pounds, Speed: 126 mph), Engine: LYCOMING TI0-540 SER (310 HP) (Reciprocating) N-Number: 8768K, N8768K, N-8768K, Serial Number: 32-7340149, Airworthiness Date: 06/07/1963, Certificate Issue Date: 09/12/2019 Registrant (Individual): John A Dilavore, 6 Donnelly Ct, Manorville, NY 11949 Deregistered:Cancel Date: 05/21/1965
Aircraft: MOONEY M20C (Category: Land, Seats: 4, Weight: Up to 12,499 Pounds, Speed: 127 mph), Engine: LYCOMING O&VO-360 SER (180 HP) (Reciprocating) N-Number: 9268V, N9268V, N-9268V, Serial Number: 690072, Year manufactured: 1969, Airworthiness Date: 07/11/1969, Certificate Issue Date: 09/18/2017 Registrant (Individual): Edward C Nelson, 17 Rockhill Circle, Manorville, NY 11949
Aircraft: PIPER PA-24-260 (Category: Land, Seats: 4, Weight: Up to 12,499 Pounds, Speed: 135 mph), Engine: LYCOMING TI0-540 SER (310 HP) (Reciprocating) N-Number: 9313P, N9313P, N-9313P, Serial Number: 24-4809, Year manufactured: 1969, Airworthiness Date: 05/07/1969, Certificate Issue Date: 02/26/1991 Registrant (Individual): Edward A Jr Pencosky, 268 Dayton Ave, Manorville, NY 11949
Home Mortgage Disclosure Act Aggregated Statistics For Year 2009 (Based on 2 partial tracts)
A) FHA, FSA/RHS & VA Home Purchase Loans
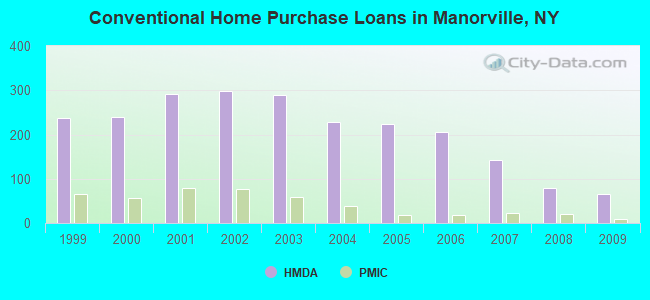
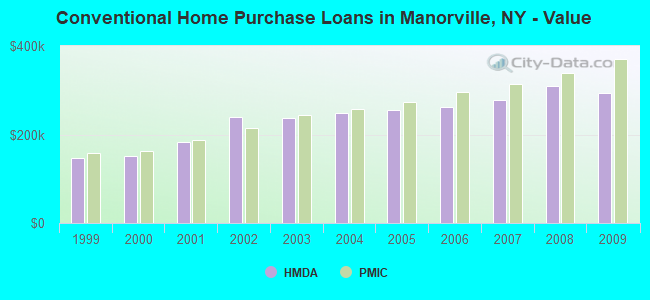
B) Conventional Home Purchase Loans
C) Refinancings
D) Home Improvement Loans
E) Loans on Dwellings For 5+ Families
F) Non-occupant Loans on < 5 Family Dwellings (A B C & D)
G) Loans On Manufactured Home Dwelling (A B C & D)
Number
Average Value
Number
Average Value
Number
Average Value
Number
Average Value
Number
Average Value
Number
Average Value
Number
Average Value
LOANS ORIGINATED
31
$342,773
65
$294,704
208
$241,814
15
$173,985
0
$0
4
$187,465
0
$0
APPLICATIONS APPROVED, NOT ACCEPTED
2
$370,440
6
$283,828
32
$277,425
5
$72,280
0
$0
1
$78,820
0
$0
APPLICATIONS DENIED
4
$291,782
15
$257,713
113
$295,443
12
$82,417
1
$436,690
3
$104,373
0
$0
APPLICATIONS WITHDRAWN
6
$264,925
14
$234,644
81
$259,551
5
$79,932
0
$0
1
$296,110
2
$34,970
FILES CLOSED FOR INCOMPLETENESS
2
$394,275
3
$396,143
24
$285,907
3
$182,967
0
$0
0
$0
0
$0
Aggregated Statistics For Year 2008 (Based on 2 partial tracts)
A) FHA, FSA/RHS & VA Home Purchase Loans
B) Conventional Home Purchase Loans
C) Refinancings
D) Home Improvement Loans
E) Loans on Dwellings For 5+ Families
F) Non-occupant Loans on < 5 Family Dwellings (A B C & D)
G) Loans On Manufactured Home Dwelling (A B C & D)
Number
Average Value
Number
Average Value
Number
Average Value
Number
Average Value
Number
Average Value
Number
Average Value
Number
Average Value
LOANS ORIGINATED
18
$313,341
80
$310,148
148
$226,333
38
$80,926
1
$18,315,610
9
$219,521
0
$0
APPLICATIONS APPROVED, NOT ACCEPTED
2
$392,105
18
$308,792
30
$277,573
11
$85,023
0
$0
1
$160,510
0
$0
APPLICATIONS DENIED
3
$339,707
29
$338,563
106
$282,010
26
$61,032
0
$0
4
$155,155
1
$49,710
APPLICATIONS WITHDRAWN
2
$294,430
10
$375,031
53
$277,936
7
$115,299
0
$0
2
$276,525
0
$0
FILES CLOSED FOR INCOMPLETENESS
1
$253,510
8
$295,055
12
$371,486
7
$140,596
0
$0
2
$276,525
0
$0
Aggregated Statistics For Year 2007 (Based on 2 partial tracts)
A) FHA, FSA/RHS & VA Home Purchase Loans
B) Conventional Home Purchase Loans
C) Refinancings
D) Home Improvement Loans
F) Non-occupant Loans on < 5 Family Dwellings (A B C & D)
G) Loans On Manufactured Home Dwelling (A B C & D)
Number
Average Value
Number
Average Value
Number
Average Value
Number
Average Value
Number
Average Value
Number
Average Value
LOANS ORIGINATED
6
$296,795
143
$278,391
231
$235,430
69
$78,215
12
$180,654
0
$0
APPLICATIONS APPROVED, NOT ACCEPTED
0
$0
31
$290,645
54
$269,408
14
$150,606
6
$225,305
0
$0
APPLICATIONS DENIED
1
$312,050
60
$274,655
183
$301,234
33
$152,378
5
$224,206
2
$68,150
APPLICATIONS WITHDRAWN
1
$235,830
25
$268,502
70
$271,939
14
$127,864
3
$256,093
1
$44,840
FILES CLOSED FOR INCOMPLETENESS
0
$0
13
$356,676
44
$297,133
4
$140,050
1
$372,800
0
$0
Aggregated Statistics For Year 2006 (Based on 2 partial tracts)
A) FHA, FSA/RHS & VA Home Purchase Loans
B) Conventional Home Purchase Loans
C) Refinancings
D) Home Improvement Loans
F) Non-occupant Loans on < 5 Family Dwellings (A B C & D)
G) Loans On Manufactured Home Dwelling (A B C & D)
Number
Average Value
Number
Average Value
Number
Average Value
Number
Average Value
Number
Average Value
Number
Average Value
LOANS ORIGINATED
3
$268,413
205
$261,345
330
$253,334
86
$73,886
18
$208,511
0
$0
APPLICATIONS APPROVED, NOT ACCEPTED
0
$0
29
$280,244
75
$259,344
24
$101,150
4
$368,198
0
$0
APPLICATIONS DENIED
2
$175,960
52
$214,114
206
$300,633
35
$116,372
12
$245,367
4
$114,105
APPLICATIONS WITHDRAWN
0
$0
40
$231,961
180
$263,566
14
$129,611
7
$212,311
0
$0
FILES CLOSED FOR INCOMPLETENESS
0
$0
10
$222,613
45
$306,577
1
$63,910
1
$311,150
0
$0
Aggregated Statistics For Year 2005 (Based on 2 partial tracts)
A) FHA, FSA/RHS & VA Home Purchase Loans
B) Conventional Home Purchase Loans
C) Refinancings
D) Home Improvement Loans
F) Non-occupant Loans on < 5 Family Dwellings (A B C & D)
G) Loans On Manufactured Home Dwelling (A B C & D)
Number
Average Value
Number
Average Value
Number
Average Value
Number
Average Value
Number
Average Value
Number
Average Value
LOANS ORIGINATED
2
$198,430
223
$255,915
430
$247,785
57
$98,841
29
$151,584
0
$0
APPLICATIONS APPROVED, NOT ACCEPTED
0
$0
39
$282,602
81
$235,667
14
$79,959
4
$186,442
0
$0
APPLICATIONS DENIED
1
$116,460
41
$260,480
158
$250,332
47
$130,535
2
$187,635
2
$42,595
APPLICATIONS WITHDRAWN
0
$0
44
$230,988
157
$256,640
22
$248,550
8
$264,021
1
$145,270
FILES CLOSED FOR INCOMPLETENESS
0
$0
14
$290,530
117
$270,581
6
$101,252
1
$443,870
1
$53,800
Aggregated Statistics For Year 2004 (Based on 2 partial tracts)
A) FHA, FSA/RHS & VA Home Purchase Loans
B) Conventional Home Purchase Loans
C) Refinancings
D) Home Improvement Loans
F) Non-occupant Loans on < 5 Family Dwellings (A B C & D)
G) Loans On Manufactured Home Dwelling (A B C & D)
Number
Average Value
Number
Average Value
Number
Average Value
Number
Average Value
Number
Average Value
Number
Average Value
LOANS ORIGINATED
3
$194,367
229
$247,506
455
$213,071
78
$99,977
28
$159,908
1
$17,930
APPLICATIONS APPROVED, NOT ACCEPTED
0
$0
41
$289,567
81
$218,882
18
$63,221
3
$110,167
1
$26,900
APPLICATIONS DENIED
3
$181,967
47
$258,840
169
$221,078
55
$108,921
8
$132,868
3
$67,253
APPLICATIONS WITHDRAWN
1
$245,700
38
$261,621
177
$230,946
19
$138,927
7
$224,860
0
$0
FILES CLOSED FOR INCOMPLETENESS
0
$0
17
$284,194
77
$229,002
7
$54,453
3
$141,947
0
$0
Aggregated Statistics For Year 2003 (Based on 2 partial tracts)
A) FHA, FSA/RHS & VA Home Purchase Loans
B) Conventional Home Purchase Loans
C) Refinancings
D) Home Improvement Loans
F) Non-occupant Loans on < 5 Family Dwellings (A B C & D)
Number
Average Value
Number
Average Value
Number
Average Value
Number
Average Value
Number
Average Value
LOANS ORIGINATED
14
$220,654
290
$237,256
962
$189,999
67
$48,025
17
$169,497
APPLICATIONS APPROVED, NOT ACCEPTED
1
$116,570
44
$233,136
147
$192,143
19
$48,888
7
$164,103
APPLICATIONS DENIED
2
$58,050
52
$235,810
254
$197,576
46
$36,720
8
$181,529
APPLICATIONS WITHDRAWN
1
$168,580
32
$257,843
198
$187,997
23
$49,507
3
$208,157
FILES CLOSED FOR INCOMPLETENESS
3
$174,897
10
$282,850
24
$181,523
11
$44,615
0
$0
Aggregated Statistics For Year 2002 (Based on 2 partial tracts)
A) FHA, FSA/RHS & VA Home Purchase Loans
B) Conventional Home Purchase Loans
C) Refinancings
D) Home Improvement Loans
F) Non-occupant Loans on < 5 Family Dwellings (A B C & D)
Number
Average Value
Number
Average Value
Number
Average Value
Number
Average Value
Number
Average Value
LOANS ORIGINATED
27
$157,264
298
$240,069
649
$164,223
97
$47,379
18
$115,043
APPLICATIONS APPROVED, NOT ACCEPTED
1
$220,590
34
$221,904
127
$153,794
21
$45,997
2
$68,600
APPLICATIONS DENIED
3
$169,703
52
$206,722
201
$157,521
53
$39,571
7
$67,167
APPLICATIONS WITHDRAWN
2
$147,060
58
$210,402
181
$156,995
35
$58,946
4
$155,322
FILES CLOSED FOR INCOMPLETENESS
1
$84,290
17
$222,015
70
$166,797
2
$51,380
4
$152,975
Aggregated Statistics For Year 2001 (Based on 2 partial tracts)
A) FHA, FSA/RHS & VA Home Purchase Loans
B) Conventional Home Purchase Loans
C) Refinancings
D) Home Improvement Loans
E) Loans on Dwellings For 5+ Families
F) Non-occupant Loans on < 5 Family Dwellings (A B C & D)
Number
Average Value
Number
Average Value
Number
Average Value
Number
Average Value
Number
Average Value
Number
Average Value
LOANS ORIGINATED
31
$149,610
292
$182,323
427
$258,914
71
$39,344
1
$91,460
6
$154,583
APPLICATIONS APPROVED, NOT ACCEPTED
3
$105,693
26
$175,119
74
$142,177
25
$45,693
1
$143,470
0
$0
APPLICATIONS DENIED
7
$111,911
43
$237,753
176
$138,412
45
$26,708
0
$0
6
$135,345
APPLICATIONS WITHDRAWN
5
$132,168
65
$205,891
144
$151,943
18
$32,364
0
$0
2
$92,110
FILES CLOSED FOR INCOMPLETENESS
2
$114,250
12
$201,014
39
$130,679
5
$41,404
0
$0
1
$27,690
Aggregated Statistics For Year 2000 (Based on 2 partial tracts)
A) FHA, FSA/RHS & VA Home Purchase Loans
B) Conventional Home Purchase Loans
C) Refinancings
D) Home Improvement Loans
E) Loans on Dwellings For 5+ Families
F) Non-occupant Loans on < 5 Family Dwellings (A B C & D)
Number
Average Value
Number
Average Value
Number
Average Value
Number
Average Value
Number
Average Value
Number
Average Value
LOANS ORIGINATED
24
$129,292
239
$152,093
113
$104,521
71
$28,655
1
$37,640
8
$71,739
APPLICATIONS APPROVED, NOT ACCEPTED
1
$110,290
41
$155,210
43
$136,662
24
$36,571
0
$0
3
$40,967
APPLICATIONS DENIED
8
$134,939
54
$157,404
125
$109,431
37
$31,147
0
$0
6
$41,798
APPLICATIONS WITHDRAWN
9
$118,346
29
$144,340
111
$87,692
8
$43,099
0
$0
6
$39,490
FILES CLOSED FOR INCOMPLETENESS
3
$89,717
4
$179,482
19
$123,085
3
$39,693
0
$0
0
$0
Aggregated Statistics For Year 1999 (Based on 2 partial tracts)
A) FHA, FSA/RHS & VA Home Purchase Loans
B) Conventional Home Purchase Loans
C) Refinancings
D) Home Improvement Loans
F) Non-occupant Loans on < 5 Family Dwellings (A B C & D)
Detailed PMIC statistics for the following Tracts:1594.09
, 1594.10
2002 - 2018 National Fire Incident Reporting System (NFIRS) incidents
Based on the data from the years 2002 - 2018 the average number of fire incidents per year is 44. The highest number of fires - 109 took place in 2002, and the least - 0 in 2003. The data has a decreasing trend.
When looking into fire subcategories, the most reports belonged to: Outside Fires (52.3%), and Structure Fires (28.3%).
Fire incident types reported to NFIRS in Manorville, NY


 Recent articles from our blog. Our writers, many of them Ph.D. graduates or candidates, create easy-to-read articles on a wide variety of topics.

 (24.0 miles


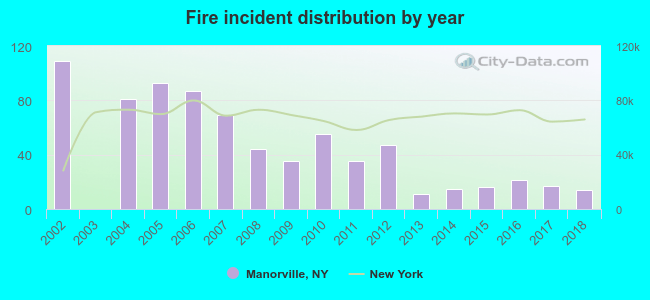 Based on the data from the years 2002 - 2018 the average number of fire incidents per year is 44. The highest number of fires - 109 took place in 2002, and the least - 0 in 2003. The data has a decreasing trend.
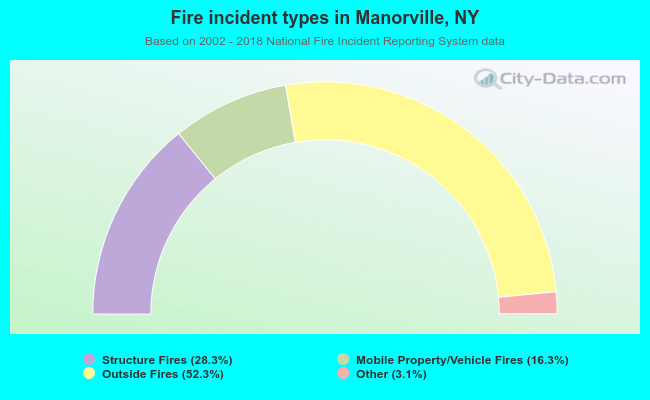 When looking into fire subcategories, the most reports belonged to: Outside Fires (52.3%), and Structure Fires (28.3%).