Estimated zip code population in 2022: 64,398 Zip code population in 2010: 62,543 Zip code population in 2000: 60,460
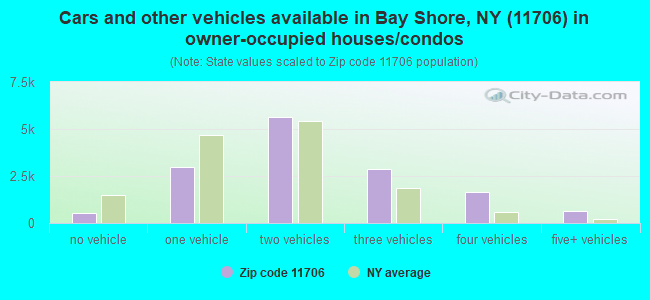
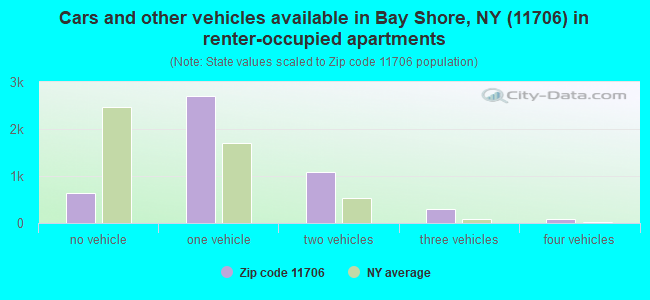
Houses and condos: 21,536 Renter-occupied apartments: 4,804
% of renters here:
25%
State:
46%
March 2022 cost of living index in zip code 11706: 147.9 (very high, U.S. average is 100)
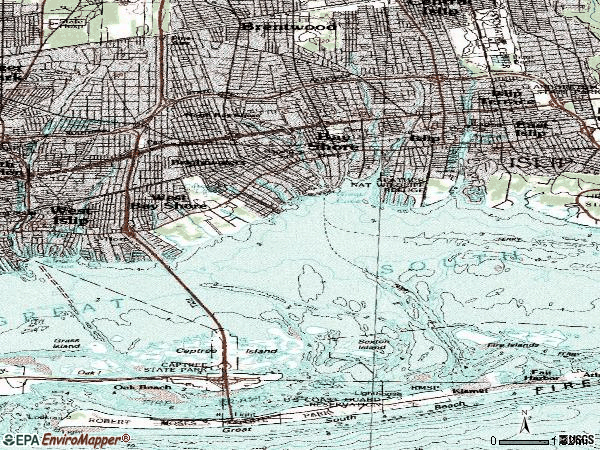
Land area: 17.1 sq. mi. Water area: 1.2 sq. mi.
Population density: 3,776 people per square mile
(average).
OSM Map
General Map
Google Map
MSN Map
OSM Map
General Map
Google Map
MSN Map
OSM Map
General Map
Google Map
MSN Map
OSM Map
General Map
Google Map
MSN Map
Please wait while loading the map...
Real estate property taxes paid for housing units in 2022:
This zip code:
2.2% ($9,774)
New York:
1.5% ($6,180)
Median real estate property taxes paid for housing units with mortgages in 2022: $9,816 (2.2%) Median real estate property taxes paid for housing units with no mortgage in 2022: $9,753 (2.2%)
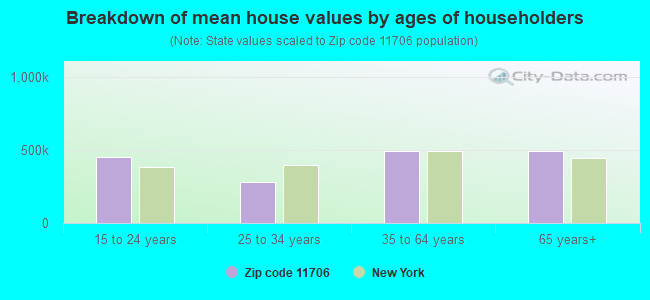
Estimated median house/condo value in 2022: $450,958
11706:
$450,958
New York:
$400,400
According to our research of New York and other state lists, there were 44 registered sex offenders living in 11706 zip code as of June 12, 2024. The ratio of all residents to sex offenders in zip code 11706 is 1,567 to 1. The ratio of registered sex offenders to all residents in this zip code is lower than the state average.
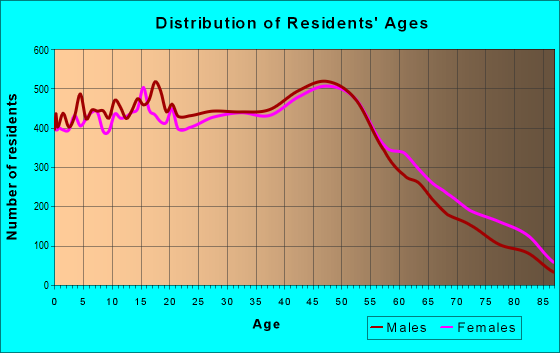
Median resident age:
This zip code:
38.2 years
New York median age:
40.0 years
Average household size:
This zip code:
3.3 people
New York:
2.5 people
Averages for the 2020 tax year for zip code 11706, filed in 2021:
Average Adjusted Gross Income (AGI) in 2020: $61,703 (Individual Income Tax Returns)
Here:
$61,703
State:
$90,930
Salary/wage: $54,127 (reported on 84.6% of returns)
Here:
$54,127
State:
$72,104
(% of AGI for various income ranges: 1244.2% for AGIs below $25k, 3646.7% for AGIs $25k-50k, 6684.5% for AGIs $50k-75k, 9701.9% for AGIs $75k-100k, 17205.1% for AGIs $100k-200k, 64871.5% for AGIs over 200k)
Taxable interest for individuals: $1,040 (reported on 29.9% of returns)
This zip code:
$1,040
New York:
$3,075
(% of AGI for various income ranges: 8.8% for AGIs below $25k, 10.1% for AGIs $25k-50k, 18.9% for AGIs $50k-75k, 42.7% for AGIs $75k-100k, 110.0% for AGIs $100k-200k, 1177.1% for AGIs over 200k)
Ordinary dividends: $5,442 (reported on 11.8% of returns)
Here:
$5,442
State:
$11,095
(% of AGI for various income ranges: 12.6% for AGIs below $25k, 18.5% for AGIs $25k-50k, 31.1% for AGIs $50k-75k, 73.7% for AGIs $75k-100k, 185.9% for AGIs $100k-200k, 3008.8% for AGIs over 200k)
Net capital gain/loss in AGI: +$15,296 (reported on 10.9% of returns)
Here:
+$15,296
State:
+$44,925
(% of AGI for various income ranges: 5.0% for AGIs below $25k, 11.9% for AGIs $25k-50k, 25.9% for AGIs $50k-75k, 88.9% for AGIs $75k-100k, 347.4% for AGIs $100k-200k, 11042.2% for AGIs over 200k)
Profit/loss from business: +$8,858 (reported on 15.5% of returns)
Here:
+$8,858
State:
+$14,940
(% of AGI for various income ranges: 206.4% for AGIs below $25k, 102.5% for AGIs $25k-50k, 105.4% for AGIs $50k-75k, 121.4% for AGIs $75k-100k, 208.2% for AGIs $100k-200k, 2993.9% for AGIs over 200k)
Taxable individual retirement arrangement distribution: $17,638 (reported on 4.9% of returns)
11706:
$17,638
New York:
$19,609
(% of AGI for various income ranges: 23.3% for AGIs below $25k, 34.0% for AGIs $25k-50k, 77.9% for AGIs $50k-75k, 164.8% for AGIs $75k-100k, 420.9% for AGIs $100k-200k, 1962.4% for AGIs over 200k)
Self-employed (Keogh) retirement plans: $25,533 (reported on 0.3% of returns)
11706:
$25,533
New York:
$32,497
(% of AGI for various income ranges: 25.6% for AGIs $75k-100k, 419.0% for AGIs over 200k)
Total itemized deductions: $26,712 (reported on 13.0% of returns)
Here:
$26,712
State:
$39,326
(% of AGI for various income ranges: 73.7% for AGIs below $25k, 202.6% for AGIs $25k-50k, 554.9% for AGIs $50k-75k, 866.7% for AGIs $75k-100k, 1346.1% for AGIs $100k-200k, 5168.8% for AGIs over 200k)
Charity contributions: $4,861 (reported on 10.0% of returns)
Here:
$4,861
State:
$15,420
(% of AGI for various income ranges: 3.7% for AGIs below $25k, 13.4% for AGIs $25k-50k, 48.4% for AGIs $50k-75k, 93.6% for AGIs $75k-100k, 195.1% for AGIs $100k-200k, 1574.6% for AGIs over 200k)
Taxes paid: $9,773 (reported on 12.9% of returns)
11706:
$9,773
State:
$9,183
(% of AGI for various income ranges: 30.2% for AGIs below $25k, 81.5% for AGIs $25k-50k, 218.4% for AGIs $50k-75k, 333.1% for AGIs $75k-100k, 502.1% for AGIs $100k-200k, 1327.1% for AGIs over 200k)
Earned income credit: $2,218 (reported on 15.7% of returns)
Here:
$2,218
State:
$2,138
(% of AGI for various income ranges: 97.4% for AGIs below $25k, 64.0% for AGIs $25k-50k, 0.9% for AGIs $50k-75k)
Percentage of individuals using paid preparers for their 2020 taxes: 93.9%
Here:
94%
State:
95%
(% for various income ranges: 91.0% for AGIs below $25k, 95.2% for AGIs $25k-50k, 94.9% for AGIs $50k-75k, 94.7% for AGIs $75k-100k, 95.5% for AGIs $100k-200k, 96.5% for AGIs over 200k)
Averages for the 2012 tax year for zip code 11706, filed in 2013:
Average Adjusted Gross Income (AGI) in 2012: $55,462 (Individual Income Tax Returns)
Here:
$55,462
State:
$77,088
Salary/wage: $48,426 (reported on 86.5% of returns)
Here:
$48,426
State:
$60,593
(% of AGI for various income ranges: 77.0% for AGIs below $25k, 86.9% for AGIs $25k-50k, 82.9% for AGIs $50k-75k, 80.6% for AGIs $75k-100k, 80.8% for AGIs $100k-200k, 52.6% for AGIs over 200k)
Taxable interest for individuals: $1,046 (reported on 32.5% of returns)
This zip code:
$1,046
New York:
$3,125
(% of AGI for various income ranges: 0.5% for AGIs below $25k, 0.3% for AGIs $25k-50k, 0.5% for AGIs $50k-75k, 0.4% for AGIs $75k-100k, 0.4% for AGIs $100k-200k, 1.2% for AGIs over 200k)
Ordinary dividends: $5,826 (reported on 12.9% of returns)
Here:
$5,826
State:
$10,299
(% of AGI for various income ranges: 0.8% for AGIs below $25k, 0.4% for AGIs $25k-50k, 0.7% for AGIs $50k-75k, 0.7% for AGIs $75k-100k, 0.9% for AGIs $100k-200k, 3.7% for AGIs over 200k)
Net capital gain/loss in AGI: +$8,814 (reported on 9.6% of returns)
Here:
+$8,814
State:
+$42,474
(% of AGI for various income ranges: 0.3% for AGIs $75k-100k, 0.5% for AGIs $100k-200k, 6.4% for AGIs over 200k)
Profit/loss from business: +$9,560 (reported on 12.5% of returns)
Here:
+$9,560
State:
+$16,168
(% of AGI for various income ranges: 8.9% for AGIs below $25k, 2.0% for AGIs $25k-50k, 1.1% for AGIs $50k-75k, 1.0% for AGIs $75k-100k, 1.2% for AGIs $100k-200k, 1.9% for AGIs over 200k)
Taxable individual retirement arrangement distribution: $14,732 (reported on 6.7% of returns)
11706:
$14,732
New York:
$17,621
(% of AGI for various income ranges: 1.7% for AGIs below $25k, 1.2% for AGIs $25k-50k, 1.7% for AGIs $50k-75k, 2.0% for AGIs $75k-100k, 2.5% for AGIs $100k-200k, 1.3% for AGIs over 200k)
Self-employment retirement plans: $21,750 (reported on 0.3% of returns)
11706:
$21,750
New York:
$27,330
(% of AGI for various income ranges: 0.1% for AGIs below $25k, 0.3% for AGIs over 200k)
Total itemized deductions: $26,238 (26% of AGI, reported on 38.9% of returns)
Here:
$26,238
State:
$34,985
Here:
25.7% of AGI
State:
21.3% of AGI
(% of AGI for various income ranges: 11.2% for AGIs below $25k, 15.9% for AGIs $25k-50k, 21.4% for AGIs $50k-75k, 22.6% for AGIs $75k-100k, 22.6% for AGIs $100k-200k, 14.4% for AGIs over 200k)
Charity contributions: $2,754 (reported on 32.8% of returns)
Here:
$2,754
State:
$5,572
(% of AGI for various income ranges: 0.7% for AGIs below $25k, 1.3% for AGIs $25k-50k, 1.8% for AGIs $50k-75k, 1.9% for AGIs $75k-100k, 2.0% for AGIs $100k-200k, 1.6% for AGIs over 200k)
Taxes paid: $12,452 (reported on 38.8% of returns)
11706:
$12,452
State:
$18,656
(% of AGI for various income ranges: 4.4% for AGIs below $25k, 6.1% for AGIs $25k-50k, 9.0% for AGIs $50k-75k, 10.3% for AGIs $75k-100k, 11.0% for AGIs $100k-200k, 9.0% for AGIs over 200k)
Earned income credit: $2,270 (reported on 20.9% of returns)
Here:
$2,270
State:
$2,230
(% of AGI for various income ranges: 7.0% for AGIs below $25k, 1.2% for AGIs $25k-50k)
Percentage of individuals using paid preparers for their 2012 taxes: 72.3%
Here:
72%
State:
66%
(% for various income ranges: 69.6% for AGIs below $25k, 71.2% for AGIs $25k-50k, 73.4% for AGIs $50k-75k, 75.5% for AGIs $75k-100k, 78.8% for AGIs $100k-200k, 85.1% for AGIs over 200k)
Averages for the 2004 tax year for zip code 11706, filed in 2005:
Average Adjusted Gross Income (AGI) in 2004: $47,371 (Individual Income Tax Returns)
Here:
$47,371
State:
$59,519
Salary/wage: $42,470 (reported on 87.8% of returns)
Here:
$42,470
State:
$50,673
(% of AGI for various income ranges: 98.0% for AGIs below $10k, 81.5% for AGIs $10k-25k, 88.3% for AGIs $25k-50k, 85.7% for AGIs $50k-75k, 84.0% for AGIs $75k-100k, 66.0% for AGIs over 100k)
Taxable interest for individuals: $1,204 (reported on 46.0% of returns)
This zip code:
$1,204
New York:
$2,377
(% of AGI for various income ranges: 3.1% for AGIs below $10k, 1.2% for AGIs $10k-25k, 0.8% for AGIs $25k-50k, 0.8% for AGIs $50k-75k, 0.8% for AGIs $75k-100k, 1.6% for AGIs over 100k)
Taxable dividends: $3,033 (reported on 17.8% of returns)
Here:
$3,033
State:
$5,394
(% of AGI for various income ranges: 2.9% for AGIs below $10k, 0.7% for AGIs $10k-25k, 0.5% for AGIs $25k-50k, 0.5% for AGIs $50k-75k, 0.6% for AGIs $75k-100k, 2.1% for AGIs over 100k)
Net capital gain/loss: +$13,428 (reported on 13.4% of returns)
Here:
+$13,428
State:
+$23,581
(% of AGI for various income ranges: -0.6% for AGIs below $10k, -0.0% for AGIs $10k-25k, 0.1% for AGIs $25k-50k, 0.2% for AGIs $50k-75k, 0.7% for AGIs $75k-100k, 10.2% for AGIs over 100k)
Profit/loss from business: +$10,098 (reported on 11.5% of returns)
Here:
+$10,098
State:
+$13,809
(% of AGI for various income ranges: 15.3% for AGIs below $10k, 5.8% for AGIs $10k-25k, 2.0% for AGIs $25k-50k, 1.2% for AGIs $50k-75k, 1.1% for AGIs $75k-100k, 2.5% for AGIs over 100k)
IRA payment deduction: $3,248 (reported on 2.4% of returns)
11706:
$3,248
New York:
$3,115
(% of AGI for various income ranges: 0.2% for AGIs below $10k, 0.3% for AGIs $10k-25k, 0.2% for AGIs $25k-50k, 0.2% for AGIs $50k-75k, 0.2% for AGIs $75k-100k, 0.1% for AGIs over 100k)
Self-employed pension: $12,735 (reported on 0.5% of returns)
Here:
$12,735
New York:
$19,016
(% of AGI for various income ranges: 0.1% for AGIs $25k-50k, 0.0% for AGIs $50k-75k, 0.1% for AGIs $75k-100k, 0.3% for AGIs over 100k)
Total itemized deductions: $21,899 (28% of AGI, reported on 46.6% of returns)
Here:
$21,899
State:
$25,864
Here:
28.5% of AGI
State:
21.9% of AGI
(% of AGI for various income ranges: 14.6% for AGIs below $10k, 18.5% for AGIs $10k-25k, 23.6% for AGIs $25k-50k, 26.1% for AGIs $50k-75k, 25.0% for AGIs $75k-100k, 17.7% for AGIs over 100k)
Charity contributions deductions: $2,794 (3% of AGI, reported on 42.6% of returns)
Here:
$2,794
State:
$4,439
Here:
3.5% of AGI
State:
3.6% of AGI
(% of AGI for various income ranges: 0.8% for AGIs below $10k, 1.6% for AGIs $10k-25k, 2.5% for AGIs $25k-50k, 2.9% for AGIs $50k-75k, 2.8% for AGIs $75k-100k, 2.5% for AGIs over 100k)
Total tax: $7,122 (reported on 72.1% of returns)
11706:
$7,122
State:
$11,730
(% of AGI for various income ranges: 3.3% for AGIs below $10k, 3.5% for AGIs $10k-25k, 5.8% for AGIs $25k-50k, 7.8% for AGIs $50k-75k, 9.1% for AGIs $75k-100k, 18.2% for AGIs over 100k)
Earned income credit: $1,735 (reported on 17.8% of returns)
Here:
$1,735
State:
$1,757
Percentage of individuals using paid preparers for their 2004 taxes: 73.2%
Here:
73%
State:
67%
(% for various income ranges: 65.0% for AGIs below $10k, 74.1% for AGIs $10k-25k, 72.5% for AGIs $25k-50k, 76.0% for AGIs $50k-75k, 78.4% for AGIs $75k-100k, 79.7% for AGIs over 100k)
Likely homosexual households (counted as self-reported same-sex unmarried-partner households)
Lesbian couples: 0.2% of all households
Gay men: 0.0% of all households
Household received Food Stamps/SNAP in the past 12 months: 2,490 Household did not receive Food Stamps/SNAP in the past 12 months: 16,852
Women who had a birth in the past 12 months: 1,437 (858 now married, 586 unmarried) Women who did not have a birth in the past 12 months: 14,242 (5,282 now married, 8,955 unmarried)
Housing units in zip code 11706 with a mortgage: 10,150 (1,039 second mortgage, 38 home equity loan, 761 both second mortgage and home equity loan) Houses without a mortgage: 276
Median monthly owner costs for units with a mortgage: $2,853 Median monthly owner costs for units without a mortgage: $1,315
Residents with income below the poverty level in 2022:
This zip code:
8.5%
Whole state:
14.3%
Residents with income below 50% of the poverty level in 2022:
This zip code:
4.3%
Whole state:
6.8%
Median number of rooms in houses and condos:
Here:
6.4
State:
6.3
Median number of rooms in apartments:
Here:
3.8
State:
3.8
Notable locations in this zip code not listed on our city pages
8,585 married couples with children.
2,511 single-parent households (523 men, 1,988 women).
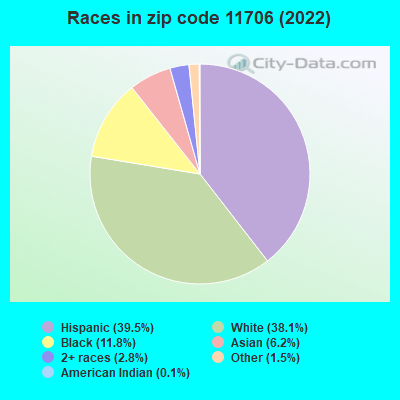
57.9% of residents of 11706 zip code speak English at home.
32.6% of residents speak Spanish at home (53% very well, 23% well, 17% not well, 8% not at all).
7.6% of residents speak other Indo-European language at home (56% very well, 37% well, 4% not well, 3% not at all).
1.0% of residents speak Asian or Pacific Island language at home (64% very well, 20% well, 16% not well).
0.5% of residents speak other language at home (74% very well, 8% well, 18% not well).
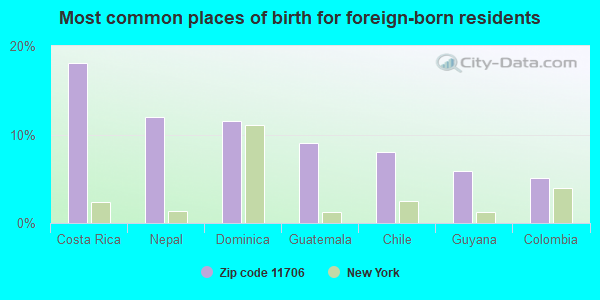
Foreign born population: 18,369 (28.5%) (57.5% of them are naturalized citizens)
Major facilities with environmental interests located in this zip code:
CON WAY CENTRAL EXPRESS XIY (130 S 4TH ST in BAY SHORE, NY)
STATE MASTER (New York facility tracking) - National Pollutant Discharge Elimination System Permit Small Quantity Generators, between 100 kg and 1000 kg of hazardous waste/month (Resource Conservation and Recovery Act (tracking hazardous waste)) Business SIC classification: TRUCKING, EXCEPT LOCAL Business NAICS classification: GENERAL FREIGHT TRUCKING, LONG-DISTANCE, LESS THAN TRUCKLOAD. Organizations: CON-WAY CENTRAL EXPRESS (CONTACT/OPERATOR)
, CON-WAY TRANSPORTATION (CONTACT/OWNER)
, CNF TRANSPORTATION INC (LEGALLY RESPONSIBLE PARTY)
Alternative names: CONSOLIDATED FREIGHTWAYS
J & S CUSTOM COLLISION CORP (10 BAY AVENUE in BAYSHORE, NY) . Federal Facility. POSTAL SERVICE
STATE MASTER (New York facility tracking) - AIR PROGRAM (Resource Conservation and Recovery Act (tracking hazardous waste)) Alternative names: J & S CUSTOM AUTO COLLISION
HUBBARD POWER & LIGHT INC. PROPERTY (1600 FIFTH AVENUE in BAYSHORE, NY)
AIR MAJOR (AIRS/AFS) STATE MASTER (New York facility tracking) - AIR PROGRAM, CRITERIA AND HAZARDOUS AIR POLLUTANT INVENTORY (Inventory of air pollution sources) Business SIC classification: INTERNAL COMBUSTION ENGINES
ASTRO ELECTROPLATING INC (171 4TH AVE in BAY SHORE, NY)
AIR MINOR (AIRS/AFS) Large Quantity Generators, more that 1000 kg of hazardous waste/month (Resource Conservation and Recovery Act (tracking hazardous waste)) TRI REPORTER (Tracking of toxic chemicals releasing facilities) Business SIC and NAICS classification: ELECTROPLATING, PLATING, POLISHING, ANODIZING, AND COLORING Organizations: NEIL WEINSTEIN (CONTACT/OPERATOR)
HEMLOCK ES ( in BAY SHORE, NY)
(National Center for Education Statistics) - STATE ID-580512030003 Organizations: BRENTWOOD UFSD (SCHOOL DISTRICT)
AMERICANA LAUNDROMAT & DRY CLEANER (1572 NORTH 5TH AVENUE in BAYSHORE, NY)
Conditionally Exempt Small Quantity Generators, less than 100 kg/month of hazardous waste (Resource Conservation and Recovery Act (tracking hazardous waste)) - notification HAZARDOUS WASTE BIENNIAL REPORTER (Resource Conservation and Recovery Act (tracking hazardous waste)) Large Quantity Generators, more that 1000 kg of hazardous waste/month (Resource Conservation and Recovery Act (tracking hazardous waste)) - notification Organizations: ROBERT FELICIANO (CONTACT/OWNER)
Alternative names: AMERICANA LAUNDROMAT & CLEANER
AMERICAN PRECISION - CHROME PLATING (27 LOCKWOOD AVE in BAY SHORE, NY)
HOME DEPOT USA INC HD1211 (1881 SUNRISE HWY in BAYSHORE, NY)
HAZARDOUS WASTE BIENNIAL REPORTER (Resource Conservation and Recovery Act (tracking hazardous waste)) Small Quantity Generators, between 100 kg and 1000 kg of hazardous waste/month (Resource Conservation and Recovery Act (tracking hazardous waste)) Alternative names: HOME DEPOT THE 1211
(Resource Conservation and Recovery Act (tracking hazardous waste))
A B C COSMETICS (8 OAKTREE DRIVE in BAY SHORE, NY)
(Resource Conservation and Recovery Act (tracking hazardous waste))
A B R AUTO BODY INCORPORATED (1415 SUNRISE HIGHWAY in BAY SHORE, NY)
(Resource Conservation and Recovery Act (tracking hazardous waste))
COLLISION CONNECTION (224 E MAIN ST in BAY SHORE, NY)
(Resource Conservation and Recovery Act (tracking hazardous waste))
Housing units lacking complete plumbing facilities: 0.7% Housing units lacking complete kitchen facilities: 2.9%
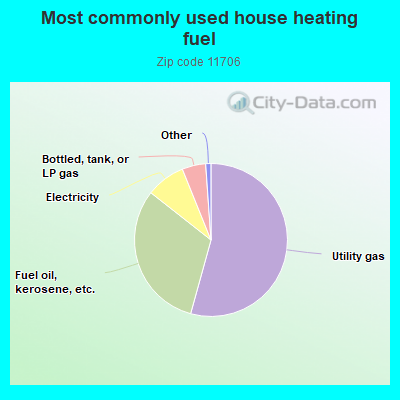
54.3%Utility gas
31.3%Fuel oil, kerosene, etc.
8.3%Electricity
5.0%Bottled, tank, or LP gas
Population in 1990: 5,507. Population change in the 1990s: +54,953 (+997.9%).
Place of birth for U.S.-born residents:
This state: 40,380
Northeast: 1,260
Midwest: 224
South: 1,074
West: 367
64% of the 11706 zip code residents lived in the same house 5 years ago. Out of people who lived in different houses, 70% lived in this county. Out of people who lived in different counties, 50% lived in New York.
91% of the 11706 zip code residents lived in the same house 1 year ago. Out of people who lived in different houses, 71% moved from this county. Out of people who lived in different houses, 19% moved from different county within same state. Out of people who lived in different houses, 5% moved from different state. Out of people who lived in different houses, 3% moved from abroad.
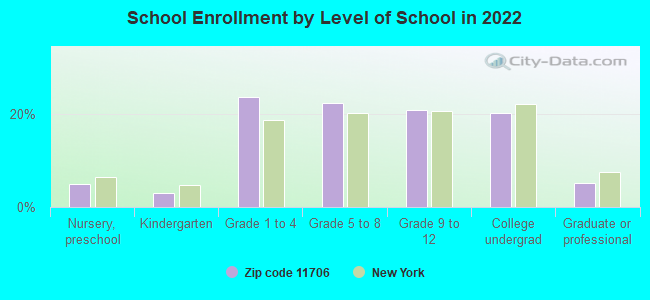
Private vs. public school enrollment:
Students in private schools in grades 1 to 8 (elementary and middle school): 249
Here:
3.4%
New York:
15.6%
Students in private schools in grades 9 to 12 (high school): 171
Here:
5.1%
New York:
15.0%
Students in private undergraduate colleges: 1,157
Here:
36.1%
New York:
39.2%
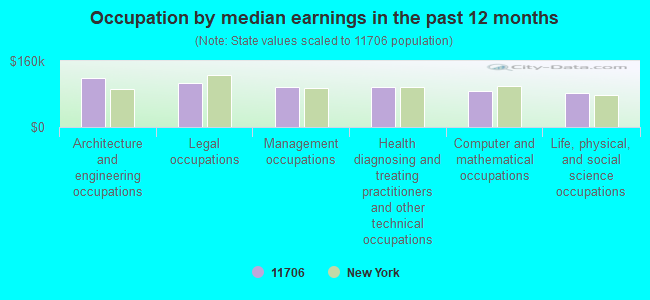
Occupation by median earnings in the past 12 months ($)
117,833Architecture and engineering occupations
107,113Legal occupations
97,268Management occupations
96,783Health diagnosing and treating practitioners and other technical occupations
87,161Computer and mathematical occupations
82,714Life, physical, and social science occupations
Companies with biggest federal contracts located in this zip code:
U F C AEROSPACE CORPORATION, I (25 DREXEL DR in BAY SHORE, NY; small business) : $43,473,091 in 1639 contractsfrom 1999 to 2006
Contracts for Airframe Structural Components, Engineering and Technical Services, Nuts and Washers, Screws, and moreby Air Force, Defense Logistics Agency, Federal Supply Service, Army, and others Signed by year:2000: $5,718,813; 2001: $8,380,992; 2002: $8,470,984; 2003: $733,396; 2004: $4,191,794; 2005: $9,891,723; 2006: $5,416,938.
Biggest contracts:
$4,500,000 with Air Force for Airframe Structural Components. Signed on 2001-09-26. Completion date: 2004-01-16.
$3,008,655, same as above.Signed on 2002-04-10. Completion date: 2003-02-07.
$2,517,548 with Defense Logistics Agency for Airframe Structural Components. Signed on 2000-11-25. Completion date: 2001-08-02.
$2,308,431, same as above.Signed on 2000-07-01. Completion date: 2000-10-31.
R F I CORP (100 PINE AIRE DR in BAY SHORE, NY; small business) : $11,232,504 in 307 contractsfrom 2000 to 2006
Contracts for Radar Equipment, Except Airborne, Filters and Networks, Electrical Control Equipment, Connectors, Electrical, and moreby Navy, Defense Logistics Agency, Army, Air Force, and others Signed by year:2000: $3,556,692; 2001: $1,553,578; 2002: $809,693; 2003: $739,064; 2004: $1,586,024; 2005: $2,059,319; 2006: $928,134.
Biggest contracts:
$2,465,000 with Navy for Radar Equipment, Except Airborne. Signed on 2000-04-13. Completion date: 2000-11-20.
$498,004 with Defense Logistics Agency for Filters and Networks. Signed on 2005-04-29. Completion date: 2005-12-05.
$399,525 with Army for Electrical Control Equipment. Signed on 2001-08-16. Completion date: 2001-11-30.
$331,905 with Navy for Radar Equipment, Except Airborne. Signed on 2001-12-18. Completion date: 2002-09-14.
GIBSON AND CUSHMAN DREDGING CO (38 HOMAN AVENUE in BAY SHORE, NY; small business) : $10,385,454 in 46 contractsfrom 1999 to 2005
Contracts for Maintenance, Repair or Alteration of Real Property -- Dredging, Construction of Structures and Facilities -- Dredging, Invalid code: Y217, Maintenance, Repair or Alteration of Real Property -- Other Non-Building Facilities by U.S. Army Corps of Engineers - civil program financing only, Army, U.S. Coast Guard, United States Coast Guard (disused code: now 7008), and others Signed by year:2000: $4,979,201; 2001: $3,517,261; 2002: $871,416; 2003: $257,000; 2004: $693,140; 2005: $42,436; 2006: $0.
Biggest contracts:
$1,345,101 with U.S. Army Corps of Engineers - civil program financing only for Maintenance, Repair or Alteration of Real Property -- Dredging. Taking place in ME. Signed on 2000-12-04. Completion date: 2001-02-01.
$1,150,000 with U.S. Army Corps of Engineers - civil program financing only for Construction of Structures and Facilities -- Dredging. Taking place in MA. Signed on 2000-12-01. Completion date: 2001-08-06.
$1,000,000, same as above.Signed on 2001-02-05. Completion date: 2001-08-06.
$1,000,000 with U.S. Army Corps of Engineers - civil program financing only for Construction of Structures and Facilities -- Dredging. Signed on 2001-11-30. Completion date: 2001-12-31.
CENTURY METAL PARTS CORP (230 S FEHR WAY in BAY SHORE, NY; small business) : $8,016,276 in 319 contractsfrom 2000 to 2006
Contracts for Flags and Pennants, Airframe Structural Components, Antennas, Waveguides, and Related Equipment, Aircraft Wheel and Brake Systems, and moreby Defense Logistics Agency, Air Force, Bureau of Prisoners/Federal Prison System, Army, and others Signed by year:2000: $503,856; 2001: $598,787; 2002: $576,243; 2003: $540,969; 2004: $2,753,357; 2005: $2,433,298; 2006: $609,766.
Biggest contracts:
$194,220 with Defense Logistics Agency for Flags and Pennants. Signed on 2004-01-20. Completion date: 2005-03-18.
$178,661 with Air Force for Airframe Structural Components. Signed on 2005-07-14. Completion date: 2007-01-10.
$159,800 with Defense Logistics Agency for Flags and Pennants. Signed on 2002-04-23. Completion date: 2003-07-21.
$136,962 with Defense Logistics Agency for Antennas, Waveguides, and Related Equipment. Signed on 2004-02-13. Completion date: 2004-09-10.
PRECISION METALS CORP (221 SKIP LN in BAY SHORE, NY; small business) : $6,111,201 in 288 contractsfrom 2002 to 2006
Contracts for Hardware, Commercial, Airframe Structural Components, Vehicular Furniture and Accessories, Miscellaneous Battery Retaining Fixtures and Liners, and moreby Defense Logistics Agency, Army, Air Force Signed by year:2000: $0; 2001: $0; 2002: $40,950; 2003: $285,597; 2004: $1,214,580; 2005: $3,498,388; 2006: $1,071,686.
Biggest contracts:
$370,720 with Defense Logistics Agency for Hardware, Commercial. Signed on 2005-01-05. Completion date: 2005-02-05.
$363,200, same as above.Signed on 2005-03-29. Completion date: 2005-07-30.
$233,180, same as above.Signed on 2005-10-07. Completion date: 2006-02-04.
$126,250 with Defense Logistics Agency for Airframe Structural Components. Signed on 2004-01-20. Completion date: 2004-11-15.
GLOBAL MARKET DEVELOPMENT, INC (6 WASHINGTON AVE in BAY SHORE, NY; small business) : $2,782,732 in 44 contractsfrom 2000 to 2006
Contracts for Antennas, Waveguides, and Related Equipment, Headsets, Handsets, Microphones and Speakers, Miscellaneous Communication Equipment, Miscellaneous Alarm, Signal and Security Detection Systems, and moreby Bureau of Prisoners/Federal Prison System, Army, Defense Logistics Agency, Navy, and others Signed by year:2000: $248,058; 2001: $391,918; 2002: $314,865; 2003: $702,256; 2004: $449,834; 2005: $213,179; 2006: $462,622.
Biggest contracts:
$253,000 with Bureau of Prisoners/Federal Prison System for Antennas, Waveguides, and Related Equipment. Signed on 2003-02-15. Completion date: 2005-02-15.
$223,175, same as above.Signed on 2006-01-19. Completion date: 2006-01-19.
$175,275 with Army for Headsets, Handsets, Microphones and Speakers. Signed on 2005-04-29. Completion date: 2007-07-31.
$170,775, same as above.Signed on 2003-11-07. Completion date: 2007-07-31.
OMNITEK PARTNERS, LLC (APPLIED TECHNOLOGY CENTER in BAYSHORE, NJ; small business) : $2,208,913 in 16 contractsfrom 2001 to 2006
Contracts for Other Defense -- Basic Research (R&D), Other Defense -- Applied Research and Exploratory Development (R&D), Specifications Development Services by Army Signed by year:2000: $0; 2001: $99,000; 2002: $189,995; 2003: $785,652; 2004: $724,266; 2005: $360,000; 2006: $50,000.
Biggest contracts:
$368,934 with Army for Other Defense -- Basic Research (R&D). Signed on 2003-03-03. Completion date: 2004-02-24.
$366,719, same as above.Signed on 2003-12-04. Completion date: 2005-11-30.
$363,267, same as above.Signed on 2004-12-02. Completion date: 2004-12-03.
$360,999, same as above.Signed on 2004-02-25. Completion date: 2005-02-25.
LASTICKS AEROSPACE INC (35 WASHINGTON AVE STE E in BAY SHORE, NY; small business) : $873,636 in 67 contractsfrom 2001 to 2006
Contracts for Airframe Structural Components, Bearings, Antifriction, Unmounted, Miscellaneous Aircraft Accessories and Components, Helicopter Rotor Blades, Drive Mechanisms and Components, and moreby Army, Defense Logistics Agency, Navy Signed by year:2000: $0; 2001: $39,750; 2002: $0; 2003: $0; 2004: $0; 2005: $736,929; 2006: $96,957.
Biggest contracts:
$90,639 with Army for Airframe Structural Components. Signed on 2005-04-06. Completion date: 2005-03-31.
$72,917 with Defense Logistics Agency for Bearings, Antifriction, Unmounted. Signed on 2005-08-09. Completion date: 2006-03-07.
$63,936, same as above.Signed on 2006-04-03. Completion date: 2007-04-28.
$47,350 with Defense Logistics Agency for Miscellaneous Aircraft Accessories and Components. Signed on 2005-06-07. Completion date: 2006-02-02.
GNY EQUIPMENT, LLC (20 DREXEL DRIVE in BAY SHORE, NY; small business) : $328,211 in 5 contractsfrom 1999 to 2003
Contracts for Liquid and Gas Flow, Liquid Level, and Mechanical Motion Measuring Instruments, Aircraft Maintenance and Repair Shop Specialized Equipment, Power and Hand Pumps by Air Force, Navy, Army Signed by year:2000: $0; 2001: $61,154; 2002: $58,187; 2003: $59,895; 2004: $0; 2005: $0; 2006: $0.
Biggest contracts:
$82,975 with Air Force for Liquid and Gas Flow, Liquid Level, and Mechanical Motion Measuring Instruments. Signed on 1999-12-08. Completion date: 2000-06-30.
$66,000 with Air Force for Aircraft Maintenance and Repair Shop Specialized Equipment. Signed on 1999-12-20. Completion date: 2000-06-30.
$61,154 with Navy for Aircraft Maintenance and Repair Shop Specialized Equipment. Signed on 2001-08-27. Completion date: 2001-12-31.
$59,895 with Army for Power and Hand Pumps. Signed on 2003-09-09. Completion date: 2003-12-01.
LEXAN INDUSTRIES INC (40 DREXEL DRIVE in BAY SHORE, NY; small business) : $287,422 in 33 contractsfrom 2000 to 2006
Contracts for Antennas, Waveguides, and Related Equipment, Maintenance, Repair and Rebuilding of Equipment -- Electrical and Electronic Equipment Components, Electrical and Electronic Properties Measuring and Testing Instruments by Navy, Defense Logistics Agency, Air Force, Army, and others Signed by year:2000: $34,260; 2001: $0; 2002: $32,047; 2003: $0; 2004: $71,580; 2005: $89,985; 2006: $59,550.
Biggest contracts:
$39,897 with Navy for Antennas, Waveguides, and Related Equipment. Signed on 2000-04-13. Completion date: 2000-10-10.
$35,940 with Defense Logistics Agency for Antennas, Waveguides, and Related Equipment. Signed on 2004-10-28. Completion date: 2005-02-15.
$35,108 with Air Force for Antennas, Waveguides, and Related Equipment. Signed on 2000-01-18. Completion date: 2000-05-31.
$32,047 with Navy for Antennas, Waveguides, and Related Equipment. Signed on 2002-04-01. Completion date: 2002-06-30.
Top industries in this zip code by the number of employees in 2005:
Administrative and Support and Waste Management and Remediation Services: Janitorial Services (over 1000 employees: 1 establishment, 250-499 employees: 1 establishment, 20-49 employees: 2 establishments, 5-9 employees: 3 establishments, 1-4 employees: 10 establishments)
Health Care and Social Assistance: General Medical and Surgical Hospitals (over 1000: 1)
Health Care and Social Assistance: Offices of Physicians (except Mental Health Specialists) (100-249: 1, 50-99: 1, 20-49: 9, 10-19: 12, 5-9: 23, 1-4: 34)
People in group quarters in 2010:
107 people in emergency and transitional shelters (with sleeping facilities) for people experiencing homelessness
83 people in nursing facilities/skilled-nursing facilities
70 people in group homes intended for adults
52 people in other noninstitutional facilities
34 people in group homes for juveniles (non-correctional)
31 people in residential treatment centers for adults
8 people in hospitals with patients who have no usual home elsewhere
People in group quarters in 2000:
347 people in college dormitories (includes college quarters off campus)
141 people in homes for the mentally ill
128 people in other noninstitutional group quarters
84 people in nursing homes
23 people in mental (psychiatric) hospitals or wards
18 people in wards in general hospitals for patients who have no usual home elsewhere
17 people in homes or halfway houses for drug/alcohol abuse
14 people in religious group quarters
12 people in other nonhousehold living situations
9 people in hospitals or wards for drug/alcohol abuse
7 people in military barracks, etc.
7 people in homes for the mentally retarded
6 people in other group homes
Home Mortgage Disclosure Act Aggregated Statistics For Year 2009 (Based on 10 full and 20 partial tracts)
A) FHA, FSA/RHS & VA Home Purchase Loans
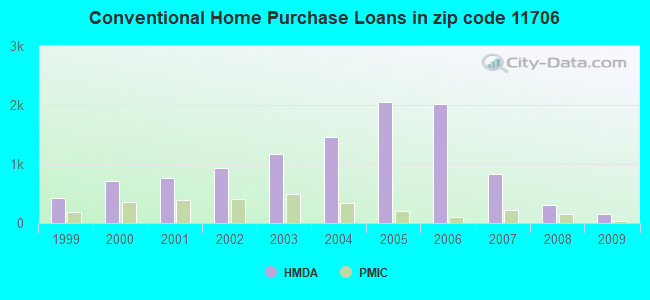
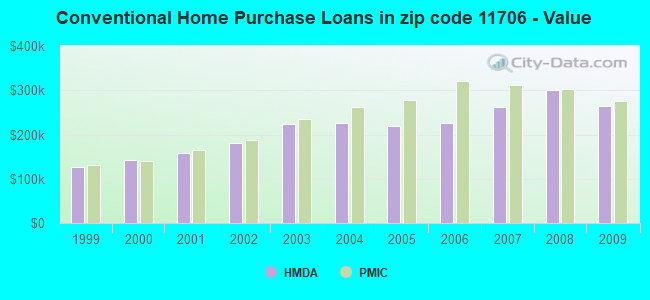
B) Conventional Home Purchase Loans
C) Refinancings
D) Home Improvement Loans
E) Loans on Dwellings For 5+ Families
F) Non-occupant Loans on < 5 Family Dwellings (A B C & D)
G) Loans On Manufactured Home Dwelling (A B C & D)
Number
Average Value
Number
Average Value
Number
Average Value
Number
Average Value
Number
Average Value
Number
Average Value
Number
Average Value
LOANS ORIGINATED
191
$271,316
160
$265,272
612
$236,817
42
$69,611
4
$1,990,495
30
$201,901
0
$0
APPLICATIONS APPROVED, NOT ACCEPTED
9
$279,130
21
$264,976
111
$245,006
28
$88,711
0
$0
4
$237,498
0
$0
APPLICATIONS DENIED
87
$265,735
48
$218,836
441
$285,222
69
$77,351
0
$0
28
$179,622
1
$120,000
APPLICATIONS WITHDRAWN
52
$245,824
26
$274,831
289
$270,022
17
$189,867
0
$0
8
$319,912
0
$0
FILES CLOSED FOR INCOMPLETENESS
19
$230,758
14
$268,341
56
$310,579
7
$306,479
0
$0
3
$228,287
0
$0
Aggregated Statistics For Year 2008 (Based on 10 full and 20 partial tracts)
A) FHA, FSA/RHS & VA Home Purchase Loans
B) Conventional Home Purchase Loans
C) Refinancings
D) Home Improvement Loans
E) Loans on Dwellings For 5+ Families
F) Non-occupant Loans on < 5 Family Dwellings (A B C & D)
G) Loans On Manufactured Home Dwelling (A B C & D)
Number
Average Value
Number
Average Value
Number
Average Value
Number
Average Value
Number
Average Value
Number
Average Value
Number
Average Value
LOANS ORIGINATED
143
$304,976
306
$301,394
548
$254,659
146
$84,374
4
$2,471,305
54
$264,070
0
$0
APPLICATIONS APPROVED, NOT ACCEPTED
23
$277,280
69
$291,299
162
$262,303
51
$74,889
0
$0
13
$186,672
0
$0
APPLICATIONS DENIED
52
$277,936
194
$290,140
789
$283,121
227
$75,597
0
$0
61
$209,295
6
$77,035
APPLICATIONS WITHDRAWN
53
$311,963
64
$273,447
293
$288,648
35
$201,340
0
$0
18
$241,698
2
$93,155
FILES CLOSED FOR INCOMPLETENESS
4
$369,825
40
$268,849
96
$280,387
8
$84,858
0
$0
3
$138,683
0
$0
Aggregated Statistics For Year 2007 (Based on 10 full and 20 partial tracts)
A) FHA, FSA/RHS & VA Home Purchase Loans
B) Conventional Home Purchase Loans
C) Refinancings
D) Home Improvement Loans
E) Loans on Dwellings For 5+ Families
F) Non-occupant Loans on < 5 Family Dwellings (A B C & D)
G) Loans On Manufactured Home Dwelling (A B C & D)
Number
Average Value
Number
Average Value
Number
Average Value
Number
Average Value
Number
Average Value
Number
Average Value
Number
Average Value
LOANS ORIGINATED
65
$326,352
829
$262,118
1,244
$260,382
360
$114,708
5
$1,861,648
135
$268,146
5
$123,568
APPLICATIONS APPROVED, NOT ACCEPTED
3
$310,753
190
$274,589
391
$267,004
104
$85,041
0
$0
32
$272,325
0
$0
APPLICATIONS DENIED
10
$358,837
630
$256,111
1,380
$292,038
400
$125,157
6
$205,988
102
$270,482
4
$168,532
APPLICATIONS WITHDRAWN
20
$300,434
157
$253,982
587
$280,218
71
$192,341
2
$578,760
33
$243,553
0
$0
FILES CLOSED FOR INCOMPLETENESS
3
$333,477
70
$272,066
190
$287,571
21
$133,707
0
$0
11
$214,103
0
$0
Aggregated Statistics For Year 2006 (Based on 10 full and 20 partial tracts)
A) FHA, FSA/RHS & VA Home Purchase Loans
B) Conventional Home Purchase Loans
C) Refinancings
D) Home Improvement Loans
E) Loans on Dwellings For 5+ Families
F) Non-occupant Loans on < 5 Family Dwellings (A B C & D)
G) Loans On Manufactured Home Dwelling (A B C & D)
Number
Average Value
Number
Average Value
Number
Average Value
Number
Average Value
Number
Average Value
Number
Average Value
Number
Average Value
LOANS ORIGINATED
31
$338,822
2,014
$226,853
2,249
$246,310
439
$119,695
6
$676,160
225
$268,493
1
$73,930
APPLICATIONS APPROVED, NOT ACCEPTED
4
$283,458
317
$231,135
417
$236,269
116
$60,486
2
$19,835
40
$232,250
0
$0
APPLICATIONS DENIED
4
$313,752
918
$216,248
1,478
$260,241
388
$121,314
0
$0
115
$244,025
3
$190,457
APPLICATIONS WITHDRAWN
15
$316,099
467
$225,577
948
$265,543
155
$169,353
2
$177,500
75
$271,711
2
$56,890
FILES CLOSED FOR INCOMPLETENESS
0
$0
101
$245,414
344
$280,600
19
$133,525
0
$0
16
$286,747
0
$0
Aggregated Statistics For Year 2005 (Based on 10 full and 20 partial tracts)
A) FHA, FSA/RHS & VA Home Purchase Loans
B) Conventional Home Purchase Loans
C) Refinancings
D) Home Improvement Loans
E) Loans on Dwellings For 5+ Families
F) Non-occupant Loans on < 5 Family Dwellings (A B C & D)
G) Loans On Manufactured Home Dwelling (A B C & D)
Number
Average Value
Number
Average Value
Number
Average Value
Number
Average Value
Number
Average Value
Number
Average Value
Number
Average Value
LOANS ORIGINATED
32
$301,877
2,045
$219,116
2,708
$232,973
437
$131,294
5
$721,966
223
$248,193
3
$11,523
APPLICATIONS APPROVED, NOT ACCEPTED
0
$0
253
$231,559
500
$214,839
97
$99,948
0
$0
41
$230,384
0
$0
APPLICATIONS DENIED
6
$266,858
758
$208,832
1,444
$235,500
433
$112,337
1
$245,000
138
$199,240
3
$42,287
APPLICATIONS WITHDRAWN
9
$246,850
506
$214,379
1,171
$234,306
251
$158,848
0
$0
113
$249,496
6
$126,383
FILES CLOSED FOR INCOMPLETENESS
2
$259,995
92
$218,886
727
$257,684
19
$134,645
0
$0
12
$246,576
1
$50,000
Aggregated Statistics For Year 2004 (Based on 10 full and 20 partial tracts)
A) FHA, FSA/RHS & VA Home Purchase Loans
B) Conventional Home Purchase Loans
C) Refinancings
D) Home Improvement Loans
E) Loans on Dwellings For 5+ Families
F) Non-occupant Loans on < 5 Family Dwellings (A B C & D)
G) Loans On Manufactured Home Dwelling (A B C & D)
Number
Average Value
Number
Average Value
Number
Average Value
Number
Average Value
Number
Average Value
Number
Average Value
Number
Average Value
LOANS ORIGINATED
119
$255,004
1,459
$226,384
2,882
$203,619
524
$98,107
5
$2,179,554
276
$210,760
31
$24,764
APPLICATIONS APPROVED, NOT ACCEPTED
7
$291,990
258
$240,331
601
$212,372
98
$109,109
2
$534,240
62
$197,478
2
$16,860
APPLICATIONS DENIED
25
$251,457
436
$216,623
1,320
$206,186
493
$87,928
0
$0
100
$202,235
9
$35,327
APPLICATIONS WITHDRAWN
31
$269,116
325
$224,705
1,395
$203,922
215
$106,493
0
$0
76
$214,370
3
$96,083
FILES CLOSED FOR INCOMPLETENESS
6
$260,113
99
$227,698
568
$231,876
27
$122,955
0
$0
26
$182,008
0
$0
Aggregated Statistics For Year 2003 (Based on 10 full and 20 partial tracts)
A) FHA, FSA/RHS & VA Home Purchase Loans
B) Conventional Home Purchase Loans
C) Refinancings
D) Home Improvement Loans
E) Loans on Dwellings For 5+ Families
F) Non-occupant Loans on < 5 Family Dwellings (A B C & D)
Number
Average Value
Number
Average Value
Number
Average Value
Number
Average Value
Number
Average Value
Number
Average Value
LOANS ORIGINATED
289
$227,810
1,162
$224,820
4,218
$172,585
213
$37,200
6
$2,240,140
247
$167,738
APPLICATIONS APPROVED, NOT ACCEPTED
13
$217,945
196
$213,391
797
$169,198
74
$44,485
2
$391,635
60
$161,866
APPLICATIONS DENIED
28
$225,786
362
$197,711
1,548
$175,669
294
$31,033
2
$412,250
112
$171,648
APPLICATIONS WITHDRAWN
69
$214,049
233
$216,556
1,534
$175,678
130
$49,517
0
$0
67
$175,144
FILES CLOSED FOR INCOMPLETENESS
25
$216,316
46
$242,270
259
$174,626
10
$26,701
0
$0
6
$175,107
Aggregated Statistics For Year 2002 (Based on 10 full and 20 partial tracts)
A) FHA, FSA/RHS & VA Home Purchase Loans
B) Conventional Home Purchase Loans
C) Refinancings
D) Home Improvement Loans
E) Loans on Dwellings For 5+ Families
F) Non-occupant Loans on < 5 Family Dwellings (A B C & D)
Number
Average Value
Number
Average Value
Number
Average Value
Number
Average Value
Number
Average Value
Number
Average Value
LOANS ORIGINATED
297
$197,825
927
$181,320
2,741
$152,112
301
$35,119
12
$1,460,932
194
$153,050
APPLICATIONS APPROVED, NOT ACCEPTED
21
$179,301
130
$174,990
543
$146,751
123
$31,149
0
$0
26
$174,052
APPLICATIONS DENIED
46
$197,437
176
$152,066
1,239
$141,255
382
$26,985
0
$0
65
$128,444
APPLICATIONS WITHDRAWN
36
$260,608
133
$182,723
1,323
$148,651
218
$42,001
5
$3,984,352
24
$140,002
FILES CLOSED FOR INCOMPLETENESS
12
$183,067
36
$186,821
364
$135,381
9
$38,046
0
$0
23
$126,300
Aggregated Statistics For Year 2001 (Based on 10 full and 20 partial tracts)
A) FHA, FSA/RHS & VA Home Purchase Loans
B) Conventional Home Purchase Loans
C) Refinancings
D) Home Improvement Loans
E) Loans on Dwellings For 5+ Families
F) Non-occupant Loans on < 5 Family Dwellings (A B C & D)
Number
Average Value
Number
Average Value
Number
Average Value
Number
Average Value
Number
Average Value
Number
Average Value
LOANS ORIGINATED
442
$167,029
769
$158,868
1,844
$134,544
277
$38,523
4
$1,544,922
117
$123,415
APPLICATIONS APPROVED, NOT ACCEPTED
21
$156,637
73
$143,259
456
$111,423
106
$36,789
0
$0
21
$107,075
APPLICATIONS DENIED
60
$153,482
212
$142,621
1,249
$114,984
401
$27,874
0
$0
67
$102,910
APPLICATIONS WITHDRAWN
51
$166,097
105
$157,712
894
$123,362
152
$33,601
0
$0
25
$117,429
FILES CLOSED FOR INCOMPLETENESS
16
$180,572
24
$134,377
157
$123,103
26
$36,527
0
$0
2
$48,520
Aggregated Statistics For Year 2000 (Based on 10 full and 20 partial tracts)
A) FHA, FSA/RHS & VA Home Purchase Loans
B) Conventional Home Purchase Loans
C) Refinancings
D) Home Improvement Loans
E) Loans on Dwellings For 5+ Families
F) Non-occupant Loans on < 5 Family Dwellings (A B C & D)
Number
Average Value
Number
Average Value
Number
Average Value
Number
Average Value
Number
Average Value
Number
Average Value
LOANS ORIGINATED
455
$143,490
716
$142,610
731
$94,142
333
$25,370
3
$81,213
108
$101,759
APPLICATIONS APPROVED, NOT ACCEPTED
25
$151,594
113
$137,967
242
$97,025
166
$23,014
0
$0
17
$84,298
APPLICATIONS DENIED
85
$140,116
266
$136,479
1,035
$91,188
426
$28,379
1
$61,300
46
$98,682
APPLICATIONS WITHDRAWN
102
$137,903
118
$130,767
976
$83,427
56
$52,004
0
$0
20
$115,947
FILES CLOSED FOR INCOMPLETENESS
19
$151,604
30
$136,270
166
$121,061
7
$25,404
0
$0
9
$59,339
Aggregated Statistics For Year 1999 (Based on 7 full and 10 partial tracts)
A) FHA, FSA/RHS & VA Home Purchase Loans
B) Conventional Home Purchase Loans
C) Refinancings
D) Home Improvement Loans
E) Loans on Dwellings For 5+ Families
F) Non-occupant Loans on < 5 Family Dwellings (A B C & D)
2003 - 2018 National Fire Incident Reporting System (NFIRS) incidents
Based on the data from the years 2003 - 2018 the average number of fire incidents per year is 140. The highest number of fire incidents - 182 took place in 2006, and the least - 74 in 2008. The data has a growing trend.
When looking into fire subcategories, the most incidents belonged to: Outside Fires (39.2%), and Structure Fires (34.4%).
Fire incident types reported to NFIRS in Zip Code 11706


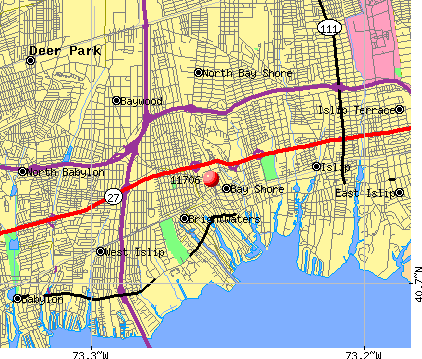 Nearest zip codes: 11718, 11751, 11795, 11717, 11702, 11703.


 Based on the data from the years 2003 - 2018 the average number of fire incidents per year is 140. The highest number of fire incidents - 182 took place in 2006, and the least - 74 in 2008. The data has a growing trend.
 When looking into fire subcategories, the most incidents belonged to: Outside Fires (39.2%), and Structure Fires (34.4%).