Estimated zip code population in 2022: 8,675 Zip code population in 2010: 8,500 Zip code population in 2000: 8,476
Houses and condos: 4,036 Renter-occupied apartments: 1,250
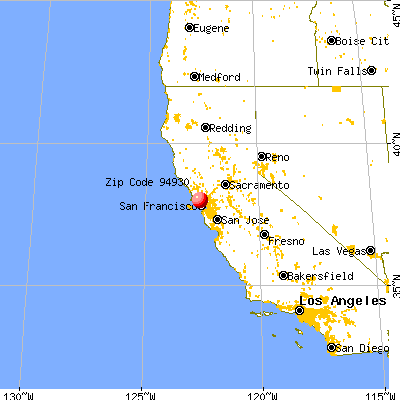
% of renters here:
34%
State:
44%
March 2022 cost of living index in zip code 94930: 129.2 (high, U.S. average is 100)
Land area: 15.9 sq. mi. Water area: 0.4 sq. mi.
Population density: 545 people per square mile
(low).
OSM Map
General Map
Google Map
MSN Map
OSM Map
General Map
Google Map
MSN Map
OSM Map
General Map
Google Map
MSN Map
OSM Map
General Map
Google Map
MSN Map
Please wait while loading the map...
Real estate property taxes paid for housing units in 2022:
This zip code:
0.9% ($10,292)
California:
0.7% ($4,831)
Median real estate property taxes paid for housing units with mortgages in 2022: $10,330 (0.8%) Median real estate property taxes paid for housing units with no mortgage in 2022: $8,614 (0.8%)
Estimated median house/condo value in 2022: $1,146,765
94930:
$1,146,765
California:
$715,900
According to our research of California and other state lists, there were 3 registered sex offenders living in 94930 zip code as of June 11, 2024. The ratio of all residents to sex offenders in zip code 94930 is 2,963 to 1. The ratio of registered sex offenders to all residents in this zip code is much lower than the state average.
Median resident age:
This zip code:
48.1 years
California median age:
37.9 years
Average household size:
This zip code:
2.3 people
California:
2.8 people
Averages for the 2020 tax year for zip code 94930, filed in 2021:
Average Adjusted Gross Income (AGI) in 2020: $139,085 (Individual Income Tax Returns)
Here:
$139,085
State:
$95,910
Salary/wage: $127,284 (reported on 70.7% of returns)
Here:
$127,284
State:
$77,331
(% of AGI for various income ranges: 1153.5% for AGIs below $25k, 3882.9% for AGIs $25k-50k, 6943.2% for AGIs $50k-75k, 10512.8% for AGIs $75k-100k, 21136.8% for AGIs $100k-200k, 129760.0% for AGIs over 200k)
Taxable interest for individuals: $2,734 (reported on 52.4% of returns)
This zip code:
$2,734
California:
$2,294
(% of AGI for various income ranges: 78.0% for AGIs below $25k, 119.0% for AGIs $25k-50k, 135.4% for AGIs $50k-75k, 278.3% for AGIs $75k-100k, 274.4% for AGIs $100k-200k, 1807.9% for AGIs over 200k)
Ordinary dividends: $9,304 (reported on 40.9% of returns)
Here:
$9,304
State:
$10,949
(% of AGI for various income ranges: 158.8% for AGIs below $25k, 242.6% for AGIs $25k-50k, 376.4% for AGIs $50k-75k, 827.2% for AGIs $75k-100k, 992.7% for AGIs $100k-200k, 4364.7% for AGIs over 200k)
Net capital gain/loss in AGI: +$23,459 (reported on 38.3% of returns)
Here:
+$23,459
State:
+$49,306
(% of AGI for various income ranges: 37.1% for AGIs below $25k, 176.5% for AGIs $25k-50k, 362.1% for AGIs $50k-75k, 635.6% for AGIs $75k-100k, 1197.8% for AGIs $100k-200k, 16387.9% for AGIs over 200k)
Profit/loss from business: +$31,561 (reported on 30.3% of returns)
Here:
+$31,561
State:
+$15,671
(% of AGI for various income ranges: 351.2% for AGIs below $25k, 1035.2% for AGIs $25k-50k, 1271.4% for AGIs $50k-75k, 1678.9% for AGIs $75k-100k, 2674.4% for AGIs $100k-200k, 9893.7% for AGIs over 200k)
Taxable individual retirement arrangement distribution: $20,276 (reported on 12.7% of returns)
94930:
$20,276
California:
$23,505
(% of AGI for various income ranges: 92.9% for AGIs below $25k, 285.8% for AGIs $25k-50k, 380.7% for AGIs $50k-75k, 997.8% for AGIs $75k-100k, 1095.6% for AGIs $100k-200k, 1283.2% for AGIs over 200k)
Self-employed (Keogh) retirement plans: $26,140 (reported on 4.6% of returns)
94930:
$26,140
California:
$30,163
(% of AGI for various income ranges: 185.7% for AGIs $50k-75k, 313.2% for AGIs $100k-200k, 1802.1% for AGIs over 200k)
Total itemized deductions: $34,565 (reported on 27.9% of returns)
Here:
$34,565
State:
$39,517
(% of AGI for various income ranges: 375.9% for AGIs below $25k, 631.3% for AGIs $25k-50k, 1116.8% for AGIs $50k-75k, 1613.9% for AGIs $75k-100k, 2898.0% for AGIs $100k-200k, 10545.3% for AGIs over 200k)
Charity contributions: $4,376 (reported on 22.2% of returns)
Here:
$4,376
State:
$12,598
(% of AGI for various income ranges: 16.3% for AGIs below $25k, 37.4% for AGIs $25k-50k, 71.1% for AGIs $50k-75k, 132.8% for AGIs $75k-100k, 233.4% for AGIs $100k-200k, 1372.1% for AGIs over 200k)
Taxes paid: $9,102 (reported on 27.9% of returns)
94930:
$9,102
State:
$8,807
(% of AGI for various income ranges: 76.3% for AGIs below $25k, 191.6% for AGIs $25k-50k, 282.1% for AGIs $50k-75k, 493.3% for AGIs $75k-100k, 917.6% for AGIs $100k-200k, 2415.8% for AGIs over 200k)
Earned income credit: $1,280 (reported on 5.8% of returns)
Here:
$1,280
State:
$2,074
(% of AGI for various income ranges: 39.8% for AGIs below $25k, 37.7% for AGIs $25k-50k)
Percentage of individuals using paid preparers for their 2020 taxes: 92.4%
Here:
92%
State:
92%
(% for various income ranges: 89.3% for AGIs below $25k, 92.1% for AGIs $25k-50k, 88.9% for AGIs $50k-75k, 92.7% for AGIs $75k-100k, 94.8% for AGIs $100k-200k, 96.1% for AGIs over 200k)
Averages for the 2012 tax year for zip code 94930, filed in 2013:
Average Adjusted Gross Income (AGI) in 2012: $104,944 (Individual Income Tax Returns)
Here:
$104,944
State:
$72,726
Salary/wage: $80,455 (reported on 72.7% of returns)
Here:
$80,455
State:
$59,079
(% of AGI for various income ranges: 57.8% for AGIs below $25k, 58.7% for AGIs $25k-50k, 59.9% for AGIs $50k-75k, 62.4% for AGIs $75k-100k, 70.2% for AGIs $100k-200k, 44.8% for AGIs over 200k)
Taxable interest for individuals: $2,290 (reported on 50.2% of returns)
This zip code:
$2,290
California:
$2,146
(% of AGI for various income ranges: 3.1% for AGIs below $25k, 1.9% for AGIs $25k-50k, 1.0% for AGIs $50k-75k, 1.2% for AGIs $75k-100k, 1.1% for AGIs $100k-200k, 0.8% for AGIs over 200k)
Ordinary dividends: $6,096 (reported on 37.3% of returns)
Here:
$6,096
State:
$9,308
(% of AGI for various income ranges: 5.8% for AGIs below $25k, 3.9% for AGIs $25k-50k, 3.2% for AGIs $50k-75k, 3.4% for AGIs $75k-100k, 2.0% for AGIs $100k-200k, 1.4% for AGIs over 200k)
Net capital gain/loss in AGI: +$14,740 (reported on 32.3% of returns)
Here:
+$14,740
State:
+$30,460
(% of AGI for various income ranges: 0.2% for AGIs $25k-50k, 1.4% for AGIs $50k-75k, 2.5% for AGIs $75k-100k, 1.9% for AGIs $100k-200k, 7.9% for AGIs over 200k)
Profit/loss from business: +$30,053 (reported on 33.3% of returns)
Here:
+$30,053
State:
+$17,064
(% of AGI for various income ranges: 24.2% for AGIs below $25k, 21.5% for AGIs $25k-50k, 15.8% for AGIs $50k-75k, 12.4% for AGIs $75k-100k, 9.3% for AGIs $100k-200k, 5.5% for AGIs over 200k)
Taxable individual retirement arrangement distribution: $18,346 (reported on 13.4% of returns)
94930:
$18,346
California:
$19,557
(% of AGI for various income ranges: 6.2% for AGIs below $25k, 3.8% for AGIs $25k-50k, 3.6% for AGIs $50k-75k, 3.2% for AGIs $75k-100k, 3.0% for AGIs $100k-200k, 1.1% for AGIs over 200k)
Self-employment retirement plans: $17,275 (reported on 4.8% of returns)
94930:
$17,275
California:
$24,530
(% of AGI for various income ranges: 1.1% for AGIs $25k-50k, 0.9% for AGIs $50k-75k, 0.8% for AGIs $75k-100k, 0.8% for AGIs $100k-200k, 0.8% for AGIs over 200k)
Total itemized deductions: $34,461 (21% of AGI, reported on 52.4% of returns)
Here:
$34,461
State:
$34,004
Here:
20.5% of AGI
State:
22.7% of AGI
(% of AGI for various income ranges: 31.2% for AGIs below $25k, 18.2% for AGIs $25k-50k, 19.5% for AGIs $50k-75k, 21.5% for AGIs $75k-100k, 21.1% for AGIs $100k-200k, 12.7% for AGIs over 200k)
Charity contributions: $2,478 (reported on 43.5% of returns)
Here:
$2,478
State:
$4,659
(% of AGI for various income ranges: 1.2% for AGIs below $25k, 1.0% for AGIs $25k-50k, 1.3% for AGIs $50k-75k, 1.1% for AGIs $75k-100k, 1.1% for AGIs $100k-200k, 0.9% for AGIs over 200k)
Taxes paid: $15,625 (reported on 52.2% of returns)
94930:
$15,625
State:
$14,448
(% of AGI for various income ranges: 7.7% for AGIs below $25k, 4.9% for AGIs $25k-50k, 6.5% for AGIs $50k-75k, 7.8% for AGIs $75k-100k, 9.3% for AGIs $100k-200k, 7.4% for AGIs over 200k)
Earned income credit: $1,364 (reported on 8.6% of returns)
Here:
$1,364
State:
$2,286
(% of AGI for various income ranges: 2.8% for AGIs below $25k, 0.4% for AGIs $25k-50k)
Percentage of individuals using paid preparers for their 2012 taxes: 57.9%
Here:
58%
State:
64%
(% for various income ranges: 47.5% for AGIs below $25k, 51.9% for AGIs $25k-50k, 64.3% for AGIs $50k-75k, 61.9% for AGIs $75k-100k, 66.3% for AGIs $100k-200k, 70.3% for AGIs over 200k)
Averages for the 2004 tax year for zip code 94930, filed in 2005:
Average Adjusted Gross Income (AGI) in 2004: $64,423 (Individual Income Tax Returns)
Here:
$64,423
State:
$58,600
Salary/wage: $57,612 (reported on 74.5% of returns)
Here:
$57,612
State:
$49,455
(% of AGI for various income ranges: 57.8% for AGIs $10k-25k, 66.4% for AGIs $25k-50k, 66.1% for AGIs $50k-75k, 73.0% for AGIs $75k-100k, 62.1% for AGIs over 100k)
Taxable interest for individuals: $2,108 (reported on 58.8% of returns)
This zip code:
$2,108
California:
$2,365
(% of AGI for various income ranges: 3.9% for AGIs $10k-25k, 2.6% for AGIs $25k-50k, 2.0% for AGIs $50k-75k, 1.2% for AGIs $75k-100k, 1.5% for AGIs over 100k)
Taxable dividends: $3,532 (reported on 42.4% of returns)
Here:
$3,532
State:
$4,746
(% of AGI for various income ranges: 4.4% for AGIs $10k-25k, 3.2% for AGIs $25k-50k, 2.3% for AGIs $50k-75k, 2.0% for AGIs $75k-100k, 1.8% for AGIs over 100k)
Net capital gain/loss: +$12,124 (reported on 36.7% of returns)
Here:
+$12,124
State:
+$23,418
(% of AGI for various income ranges: 1.5% for AGIs $10k-25k, 1.4% for AGIs $25k-50k, 1.2% for AGIs $50k-75k, 2.0% for AGIs $75k-100k, 10.9% for AGIs over 100k)
Profit/loss from business: +$25,817 (reported on 30.9% of returns)
Here:
+$25,817
State:
+$16,826
(% of AGI for various income ranges: 21.2% for AGIs $10k-25k, 15.8% for AGIs $25k-50k, 13.2% for AGIs $50k-75k, 11.7% for AGIs $75k-100k, 11.1% for AGIs over 100k)
IRA payment deduction: $3,258 (reported on 4.9% of returns)
94930:
$3,258
California:
$3,192
(% of AGI for various income ranges: 0.5% for AGIs $10k-25k, 0.5% for AGIs $25k-50k, 0.3% for AGIs $50k-75k, 0.3% for AGIs $75k-100k, 0.1% for AGIs over 100k)
Self-employed pension: $14,594 (reported on 5.4% of returns)
Here:
$14,594
California:
$17,688
(% of AGI for various income ranges: 0.5% for AGIs $10k-25k, 0.9% for AGIs $25k-50k, 0.9% for AGIs $50k-75k, 1.2% for AGIs $75k-100k, 1.4% for AGIs over 100k)
Total itemized deductions: $27,848 (27% of AGI, reported on 51.4% of returns)
Here:
$27,848
State:
$28,113
Here:
26.9% of AGI
State:
25.3% of AGI
(% of AGI for various income ranges: 25.1% for AGIs $10k-25k, 20.3% for AGIs $25k-50k, 25.2% for AGIs $50k-75k, 23.4% for AGIs $75k-100k, 19.9% for AGIs over 100k)
Charity contributions deductions: $2,413 (2% of AGI, reported on 45.7% of returns)
Here:
$2,413
State:
$3,923
Here:
2.2% of AGI
State:
3.3% of AGI
(% of AGI for various income ranges: 1.7% for AGIs $10k-25k, 1.4% for AGIs $25k-50k, 2.0% for AGIs $50k-75k, 1.6% for AGIs $75k-100k, 1.7% for AGIs over 100k)
Total tax: $11,324 (reported on 84.4% of returns)
94930:
$11,324
State:
$10,761
(% of AGI for various income ranges: 7.2% for AGIs $10k-25k, 9.7% for AGIs $25k-50k, 11.2% for AGIs $50k-75k, 11.6% for AGIs $75k-100k, 17.5% for AGIs over 100k)
Earned income credit: $1,086 (reported on 7.3% of returns)
Here:
$1,086
State:
$1,763
Percentage of individuals using paid preparers for their 2004 taxes: 61.7%
Here:
62%
State:
66%
(% for various income ranges: 52.4% for AGIs below $10k, 56.7% for AGIs $10k-25k, 56.6% for AGIs $25k-50k, 65.0% for AGIs $50k-75k, 67.6% for AGIs $75k-100k, 74.2% for AGIs over 100k)
Household received Food Stamps/SNAP in the past 12 months: 293 Household did not receive Food Stamps/SNAP in the past 12 months: 3,380
Women who had a birth in the past 12 months: 200 (127 now married, 73 unmarried) Women who did not have a birth in the past 12 months: 1,739 (661 now married, 1,079 unmarried)
Housing units in zip code 94930 with a mortgage: 1,551 (345 second mortgage, 41 home equity loan, 299 both second mortgage and home equity loan) Houses without a mortgage: 42
Median monthly owner costs for units with a mortgage: $3,800 Median monthly owner costs for units without a mortgage: $1,122
Residents with income below the poverty level in 2022:
This zip code:
9.0%
Whole state:
12.2%
Residents with income below 50% of the poverty level in 2022:
This zip code:
2.3%
Whole state:
6.2%
Median number of rooms in houses and condos:
Here:
5.6
State:
6.0
Median number of rooms in apartments:
Here:
3.8
State:
3.9
Notable locations in this zip code not listed on our city pages
Notable locations in zip code 94930: Camp Lilienthal (A), Tamarancho Boy Scout Camp (B), Rifle Camp (C), Laurel Dell Campground (D), Camp Arequipa (E), Sky Oaks Ranger Station (F), Lagunitas Picnic Grounds (G), Five Corners (H), Marin Town and Country Club (I), Barths Retreat (J), Meadow Country Club (K), Henry E Bothin Youth Center (L), Fairfax Regional Branch Marin County Free Library (M), Saint Ritas Meeting Hall (N), Ross Valley Fire Department Station 21 (O). Display/hide their locations on the map
Churches in zip code 94930 include: Fairfax Community Church (A), Saint Ritas Roman Catholic Church (B), Seventh Day Adventist Church (C). Display/hide their locations on the map
Creeks: Bon Tempe Creek (A), Bothin Creek (B), Carey Camp Creek (C), Cascade Creek (D), Cataract Creek (E), Deer Park Creek (F), Fairfax Creek (G), Van Wyck Creek (H), Swede George Creek (I). Display/hide their locations on the map
Parks in zip code 94930 include: Bolinas Park (1), Doc Edgar Park (2), Cascade Canyon Preserve (3), Loma Alta Preserve (4). Display/hide their locations on the map
1,040 married couples with children.
430 single-parent households (139 men, 291 women).
89.3% of residents of 94930 zip code speak English at home.
5.6% of residents speak Spanish at home (56% very well, 21% well, 22% not well).
1.8% of residents speak other Indo-European language at home (93% very well, 7% not well).
1.3% of residents speak Asian or Pacific Island language at home (67% very well, 33% well).
1.7% of residents speak other language at home (100% very well).
Foreign born population: 919 (10.6%) (69.6% of them are naturalized citizens)
This zip code:
10.6%
Whole state:
26.7%
10%El Salvador
8%Sweden
7%Iraq
7%United Kingdom, excluding England and Scotland
5%Belgium
5%China, excluding Hong Kong and Taiwan
5%Honduras
12%English
10%Irish
7%European
7%Italian
4%German
3%Scottish
3%Eastern European
Year of entry for the foreign-born population
2372010 or later
1512000 to 2009
2731990 to 1999
384Before 1990
Facilities with environmental interests located in this zip code:
MANOR ELEMENTARY (150 OAK MANOR DR. in FAIRFAX, CA)
(National Center for Education Statistics) - STATE ID-6024277 Organizations: ROSS VALLEY ELEMENTARY (SCHOOL DISTRICT)
FAIRFAX QUICK CLEAN (77 BROADWAY in FAIRFAX, CA)
CRITERIA AND HAZARDOUS AIR POLLUTANT INVENTORY (Inventory of air pollution sources) Small Quantity Generators, between 100 kg and 1000 kg of hazardous waste/month (Resource Conservation and Recovery Act (tracking hazardous waste)) - notification Business SIC classification: DRYCLEANING PLANTS, EXCEPT RUG CLEANING Organizations: SINIL PARK (CONTACT/OWNER)
FAIRFAX FRENCH LAUNDRY & CLEAN (101 BOLINAS ROAD in FAIRFAX, CA)
CRITERIA AND HAZARDOUS AIR POLLUTANT INVENTORY (Inventory of air pollution sources) Business SIC classification: DRYCLEANING PLANTS, EXCEPT RUG CLEANING
Housing units lacking complete plumbing facilities: 1.6% Housing units lacking complete kitchen facilities: 1.5%
80.1%Utility gas
17.0%Electricity
1.4%No fuel used
0.7%Wood
0.7%Solar energy
Population in 1990: 8,051. Population change in the 1990s: +425 (+5.3%).
Place of birth for U.S.-born residents:
This state: 4,959
Northeast: 975
Midwest: 721
South: 335
West: 584
61% of the 94930 zip code residents lived in the same house 5 years ago. Out of people who lived in different houses, 58% lived in this county. Out of people who lived in different counties, 50% lived in California.
91% of the 94930 zip code residents lived in the same house 1 year ago. Out of people who lived in different houses, 11% moved from this county. Out of people who lived in different houses, 51% moved from different county within same state. Out of people who lived in different houses, 29% moved from different state. Out of people who lived in different houses, 17% moved from abroad.
Private vs. public school enrollment:
Students in private schools in grades 1 to 8 (elementary and middle school): 266
Here:
39.9%
California:
10.5%
Students in private schools in grades 9 to 12 (high school): 76
Here:
13.0%
California:
8.5%
Students in private undergraduate colleges: 9
Here:
2.7%
California:
15.9%
Occupation by median earnings in the past 12 months ($)
144,970Computer and mathematical occupations
132,125Management occupations
110,490Architecture and engineering occupations
92,464Community and social service occupations
89,857Health technologists and technicians
87,637Legal occupations
Companies with federal contracts located in this zip code:
BAYWOOD ENVIRONMENTAL SERVICES (12 SCHOOL STREET SUITE D in FAIRFAX, CA; small business) : $5,865,116 in 66 contractsfrom 2000 to 2005
Contracts for Recreation Site Maintenance Services (non-construction), Landscaping/Groundskeeping Services, Other Environmental Services, Studies, and Analytical Support, Other Natural Resources and Conservation Services by Army, U.S. Army Corps of Engineers - civil program financing only Signed by year:2000: $223,146; 2001: $43,913; 2002: $1,168,429; 2003: $1,831,680; 2004: $732,908; 2005: $1,865,040; 2006: $0.
Biggest contracts:
$548,834 with Army for Recreation Site Maintenance Services (non-construction). Signed on 2005-04-08. Completion date: 2008-04-07.
$548,834 with U.S. Army Corps of Engineers - civil program financing only for Recreation Site Maintenance Services (non-construction). Signed on 2005-04-08. Completion date: 2008-04-07.
$441,000 with U.S. Army Corps of Engineers - civil program financing only for Landscaping/Groundskeeping Services. Signed on 2002-10-30. Completion date: 2005-09-30.
$325,000, same as above.Signed on 2003-10-14. Completion date: 2005-09-30.
ENGSOFT SOLUTIONS (9 MONO AVE in FAIRFAX, CA; small business)
$34,930 with Air Force for ADP Components. Signed on 2004-09-30. Completion date: 2004-10-15.
Top industries in this zip code by the number of employees in 2005:
2005 - 2018 National Fire Incident Reporting System (NFIRS) incidents
Based on the data from the years 2005 - 2018 the average number of fires per year is 22. The highest number of fires - 37 took place in 2006, and the least - 8 in 2005. The data has a growing trend.
When looking into fire subcategories, the most reports belonged to: Structure Fires (49.0%), and Outside Fires (31.9%).
Fire incident types reported to NFIRS in Zip Code 94930


 Nearest zip codes: 94970, 94957, 94904, 94960, 94941, 94973.


 Based on the data from the years 2005 - 2018 the average number of fires per year is 22. The highest number of fires - 37 took place in 2006, and the least - 8 in 2005. The data has a growing trend.
 When looking into fire subcategories, the most reports belonged to: Structure Fires (49.0%), and Outside Fires (31.9%).