St. Albans, Vermont Submit your own pictures of this city and show them to the world
OSM Map
General Map
Google Map
MSN Map
OSM Map
General Map
Google Map
MSN Map
OSM Map
General Map
Google Map
MSN Map
OSM Map
General Map
Google Map
MSN Map
Please wait while loading the map...
Population in 2022: 6,942 (100% urban, 0% rural). Population change since 2000: -9.3%Males: 3,216 Females: 3,726
March 2022 cost of living index in St. Albans: 102.3 (near average, U.S. average is 100) Percentage of residents living in poverty in 2022: 19.7%for White Non-Hispanic residents , 8.7% for Black residents , 56.5% for Hispanic or Latino residents , 100.0% for American Indian residents , 39.0% for other race residents , 17.1% for two or more races residents )
Profiles of local businesses
Business Search - 14 Million verified businesses
Data:
Median household income ($)
Median household income (% change since 2000)
Household income diversity
Ratio of average income to average house value (%)
Ratio of average income to average rent
Median household income ($) - White
Median household income ($) - Black or African American
Median household income ($) - Asian
Median household income ($) - Hispanic or Latino
Median household income ($) - American Indian and Alaska Native
Median household income ($) - Multirace
Median household income ($) - Other Race
Median household income for houses/condos with a mortgage ($)
Median household income for apartments without a mortgage ($)
Races - White alone (%)
Races - White alone (% change since 2000)
Races - Black alone (%)
Races - Black alone (% change since 2000)
Races - American Indian alone (%)
Races - American Indian alone (% change since 2000)
Races - Asian alone (%)
Races - Asian alone (% change since 2000)
Races - Hispanic (%)
Races - Hispanic (% change since 2000)
Races - Native Hawaiian and Other Pacific Islander alone (%)
Races - Native Hawaiian and Other Pacific Islander alone (% change since 2000)
Races - Two or more races (%)
Races - Two or more races (% change since 2000)
Races - Other race alone (%)
Races - Other race alone (% change since 2000)
Racial diversity
Unemployment (%)
Unemployment (% change since 2000)
Unemployment (%) - White
Unemployment (%) - Black or African American
Unemployment (%) - Asian
Unemployment (%) - Hispanic or Latino
Unemployment (%) - American Indian and Alaska Native
Unemployment (%) - Multirace
Unemployment (%) - Other Race
Population density (people per square mile)
Population - Males (%)
Population - Females (%)
Population - Males (%) - White
Population - Males (%) - Black or African American
Population - Males (%) - Asian
Population - Males (%) - Hispanic or Latino
Population - Males (%) - American Indian and Alaska Native
Population - Males (%) - Multirace
Population - Males (%) - Other Race
Population - Females (%) - White
Population - Females (%) - Black or African American
Population - Females (%) - Asian
Population - Females (%) - Hispanic or Latino
Population - Females (%) - American Indian and Alaska Native
Population - Females (%) - Multirace
Population - Females (%) - Other Race
Coronavirus confirmed cases (May 14, 2024)
Deaths caused by coronavirus (May 14, 2024)
Coronavirus confirmed cases (per 100k population) (May 14, 2024)
Deaths caused by coronavirus (per 100k population) (May 14, 2024)
Daily increase in number of cases (May 14, 2024)
Weekly increase in number of cases (May 14, 2024)
Cases doubled (in days) (May 14, 2024)
Hospitalized patients (Apr 18, 2022)
Negative test results (Apr 18, 2022)
Total test results (Apr 18, 2022)
COVID Vaccine doses distributed (per 100k population) (Sep 19, 2023)
COVID Vaccine doses administered (per 100k population) (Sep 19, 2023)
COVID Vaccine doses distributed (Sep 19, 2023)
COVID Vaccine doses administered (Sep 19, 2023)
Likely homosexual households (%)
Likely homosexual households (% change since 2000)
Likely homosexual households - Lesbian couples (%)
Likely homosexual households - Lesbian couples (% change since 2000)
Likely homosexual households - Gay men (%)
Likely homosexual households - Gay men (% change since 2000)
Cost of living index
Median gross rent ($)
Median contract rent ($)
Median monthly housing costs ($)
Median house or condo value ($)
Median house or condo value ($ change since 2000)
Mean house or condo value by units in structure - 1, detached ($)
Mean house or condo value by units in structure - 1, attached ($)
Mean house or condo value by units in structure - 2 ($)
Mean house or condo value by units in structure by units in structure - 3 or 4 ($)
Mean house or condo value by units in structure - 5 or more ($)
Mean house or condo value by units in structure - Boat, RV, van, etc. ($)
Mean house or condo value by units in structure - Mobile home ($)
Median house or condo value ($) - White
Median house or condo value ($) - Black or African American
Median house or condo value ($) - Asian
Median house or condo value ($) - Hispanic or Latino
Median house or condo value ($) - American Indian and Alaska Native
Median house or condo value ($) - Multirace
Median house or condo value ($) - Other Race
Median resident age
Resident age diversity
Median resident age - Males
Median resident age - Females
Median resident age - White
Median resident age - Black or African American
Median resident age - Asian
Median resident age - Hispanic or Latino
Median resident age - American Indian and Alaska Native
Median resident age - Multirace
Median resident age - Other Race
Median resident age - Males - White
Median resident age - Males - Black or African American
Median resident age - Males - Asian
Median resident age - Males - Hispanic or Latino
Median resident age - Males - American Indian and Alaska Native
Median resident age - Males - Multirace
Median resident age - Males - Other Race
Median resident age - Females - White
Median resident age - Females - Black or African American
Median resident age - Females - Asian
Median resident age - Females - Hispanic or Latino
Median resident age - Females - American Indian and Alaska Native
Median resident age - Females - Multirace
Median resident age - Females - Other Race
Commute - mean travel time to work (minutes)
Travel time to work - Less than 5 minutes (%)
Travel time to work - Less than 5 minutes (% change since 2000)
Travel time to work - 5 to 9 minutes (%)
Travel time to work - 5 to 9 minutes (% change since 2000)
Travel time to work - 10 to 19 minutes (%)
Travel time to work - 10 to 19 minutes (% change since 2000)
Travel time to work - 20 to 29 minutes (%)
Travel time to work - 20 to 29 minutes (% change since 2000)
Travel time to work - 30 to 39 minutes (%)
Travel time to work - 30 to 39 minutes (% change since 2000)
Travel time to work - 40 to 59 minutes (%)
Travel time to work - 40 to 59 minutes (% change since 2000)
Travel time to work - 60 to 89 minutes (%)
Travel time to work - 60 to 89 minutes (% change since 2000)
Travel time to work - 90 or more minutes (%)
Travel time to work - 90 or more minutes (% change since 2000)
Marital status - Never married (%)
Marital status - Now married (%)
Marital status - Separated (%)
Marital status - Widowed (%)
Marital status - Divorced (%)
Median family income ($)
Median family income (% change since 2000)
Median non-family income ($)
Median non-family income (% change since 2000)
Median per capita income ($)
Median per capita income (% change since 2000)
Median family income ($) - White
Median family income ($) - Black or African American
Median family income ($) - Asian
Median family income ($) - Hispanic or Latino
Median family income ($) - American Indian and Alaska Native
Median family income ($) - Multirace
Median family income ($) - Other Race
Median year house/condo built
Median year apartment built
Year house built - Built 2005 or later (%)
Year house built - Built 2000 to 2004 (%)
Year house built - Built 1990 to 1999 (%)
Year house built - Built 1980 to 1989 (%)
Year house built - Built 1970 to 1979 (%)
Year house built - Built 1960 to 1969 (%)
Year house built - Built 1950 to 1959 (%)
Year house built - Built 1940 to 1949 (%)
Year house built - Built 1939 or earlier (%)
Average household size
Household density (households per square mile)
Average household size - White
Average household size - Black or African American
Average household size - Asian
Average household size - Hispanic or Latino
Average household size - American Indian and Alaska Native
Average household size - Multirace
Average household size - Other Race
Occupied housing units (%)
Vacant housing units (%)
Owner occupied housing units (%)
Renter occupied housing units (%)
Vacancy status - For rent (%)
Vacancy status - For sale only (%)
Vacancy status - Rented or sold, not occupied (%)
Vacancy status - For seasonal, recreational, or occasional use (%)
Vacancy status - For migrant workers (%)
Vacancy status - Other vacant (%)
Residents with income below the poverty level (%)
Residents with income below 50% of the poverty level (%)
Children below poverty level (%)
Poor families by family type - Married-couple family (%)
Poor families by family type - Male, no wife present (%)
Poor families by family type - Female, no husband present (%)
Poverty status for native-born residents (%)
Poverty status for foreign-born residents (%)
Poverty among high school graduates not in families (%)
Poverty among people who did not graduate high school not in families (%)
Residents with income below the poverty level (%) - White
Residents with income below the poverty level (%) - Black or African American
Residents with income below the poverty level (%) - Asian
Residents with income below the poverty level (%) - Hispanic or Latino
Residents with income below the poverty level (%) - American Indian and Alaska Native
Residents with income below the poverty level (%) - Multirace
Residents with income below the poverty level (%) - Other Race
Air pollution - Air Quality Index (AQI)
Air pollution - CO
Air pollution - NO2
Air pollution - SO2
Air pollution - Ozone
Air pollution - PM10
Air pollution - PM25
Air pollution - Pb
Crime - Murders per 100,000 population
Crime - Rapes per 100,000 population
Crime - Robberies per 100,000 population
Crime - Assaults per 100,000 population
Crime - Burglaries per 100,000 population
Crime - Thefts per 100,000 population
Crime - Auto thefts per 100,000 population
Crime - Arson per 100,000 population
Crime - City-data.com crime index
Crime - Violent crime index
Crime - Property crime index
Crime - Murders per 100,000 population (5 year average)
Crime - Rapes per 100,000 population (5 year average)
Crime - Robberies per 100,000 population (5 year average)
Crime - Assaults per 100,000 population (5 year average)
Crime - Burglaries per 100,000 population (5 year average)
Crime - Thefts per 100,000 population (5 year average)
Crime - Auto thefts per 100,000 population (5 year average)
Crime - Arson per 100,000 population (5 year average)
Crime - City-data.com crime index (5 year average)
Crime - Violent crime index (5 year average)
Crime - Property crime index (5 year average)
1996 Presidential Elections Results (%) - Democratic Party (Clinton)
1996 Presidential Elections Results (%) - Republican Party (Dole)
1996 Presidential Elections Results (%) - Other
2000 Presidential Elections Results (%) - Democratic Party (Gore)
2000 Presidential Elections Results (%) - Republican Party (Bush)
2000 Presidential Elections Results (%) - Other
2004 Presidential Elections Results (%) - Democratic Party (Kerry)
2004 Presidential Elections Results (%) - Republican Party (Bush)
2004 Presidential Elections Results (%) - Other
2008 Presidential Elections Results (%) - Democratic Party (Obama)
2008 Presidential Elections Results (%) - Republican Party (McCain)
2008 Presidential Elections Results (%) - Other
2012 Presidential Elections Results (%) - Democratic Party (Obama)
2012 Presidential Elections Results (%) - Republican Party (Romney)
2012 Presidential Elections Results (%) - Other
2016 Presidential Elections Results (%) - Democratic Party (Clinton)
2016 Presidential Elections Results (%) - Republican Party (Trump)
2016 Presidential Elections Results (%) - Other
2020 Presidential Elections Results (%) - Democratic Party (Biden)
2020 Presidential Elections Results (%) - Republican Party (Trump)
2020 Presidential Elections Results (%) - Other
Ancestries Reported - Arab (%)
Ancestries Reported - Czech (%)
Ancestries Reported - Danish (%)
Ancestries Reported - Dutch (%)
Ancestries Reported - English (%)
Ancestries Reported - French (%)
Ancestries Reported - French Canadian (%)
Ancestries Reported - German (%)
Ancestries Reported - Greek (%)
Ancestries Reported - Hungarian (%)
Ancestries Reported - Irish (%)
Ancestries Reported - Italian (%)
Ancestries Reported - Lithuanian (%)
Ancestries Reported - Norwegian (%)
Ancestries Reported - Polish (%)
Ancestries Reported - Portuguese (%)
Ancestries Reported - Russian (%)
Ancestries Reported - Scotch-Irish (%)
Ancestries Reported - Scottish (%)
Ancestries Reported - Slovak (%)
Ancestries Reported - Subsaharan African (%)
Ancestries Reported - Swedish (%)
Ancestries Reported - Swiss (%)
Ancestries Reported - Ukrainian (%)
Ancestries Reported - United States (%)
Ancestries Reported - Welsh (%)
Ancestries Reported - West Indian (%)
Ancestries Reported - Other (%)
Educational Attainment - No schooling completed (%)
Educational Attainment - Less than high school (%)
Educational Attainment - High school or equivalent (%)
Educational Attainment - Less than 1 year of college (%)
Educational Attainment - 1 or more years of college (%)
Educational Attainment - Associate degree (%)
Educational Attainment - Bachelor's degree (%)
Educational Attainment - Master's degree (%)
Educational Attainment - Professional school degree (%)
Educational Attainment - Doctorate degree (%)
School Enrollment - Nursery, preschool (%)
School Enrollment - Kindergarten (%)
School Enrollment - Grade 1 to 4 (%)
School Enrollment - Grade 5 to 8 (%)
School Enrollment - Grade 9 to 12 (%)
School Enrollment - College undergrad (%)
School Enrollment - Graduate or professional (%)
School Enrollment - Not enrolled in school (%)
School enrollment - Public schools (%)
School enrollment - Private schools (%)
School enrollment - Not enrolled (%)
Median number of rooms in houses and condos
Median number of rooms in apartments
Housing units lacking complete plumbing facilities (%)
Housing units lacking complete kitchen facilities (%)
Density of houses
Urban houses (%)
Rural houses (%)
Households with people 60 years and over (%)
Households with people 65 years and over (%)
Households with people 75 years and over (%)
Households with one or more nonrelatives (%)
Households with no nonrelatives (%)
Population in households (%)
Family households (%)
Nonfamily households (%)
Population in families (%)
Family households with own children (%)
Median number of bedrooms in owner occupied houses
Mean number of bedrooms in owner occupied houses
Median number of bedrooms in renter occupied houses
Mean number of bedrooms in renter occupied houses
Median number of vehichles in owner occupied houses
Mean number of vehichles in owner occupied houses
Median number of vehichles in renter occupied houses
Mean number of vehichles in renter occupied houses
Mortgage status - with mortgage (%)
Mortgage status - with second mortgage (%)
Mortgage status - with home equity loan (%)
Mortgage status - with both second mortgage and home equity loan (%)
Mortgage status - without a mortgage (%)
Average family size
Average family size - White
Average family size - Black or African American
Average family size - Asian
Average family size - Hispanic or Latino
Average family size - American Indian and Alaska Native
Average family size - Multirace
Average family size - Other Race
Geographical mobility - Same house 1 year ago (%)
Geographical mobility - Moved within same county (%)
Geographical mobility - Moved from different county within same state (%)
Geographical mobility - Moved from different state (%)
Geographical mobility - Moved from abroad (%)
Place of birth - Born in state of residence (%)
Place of birth - Born in other state (%)
Place of birth - Native, outside of US (%)
Place of birth - Foreign born (%)
Housing units in structures - 1, detached (%)
Housing units in structures - 1, attached (%)
Housing units in structures - 2 (%)
Housing units in structures - 3 or 4 (%)
Housing units in structures - 5 to 9 (%)
Housing units in structures - 10 to 19 (%)
Housing units in structures - 20 to 49 (%)
Housing units in structures - 50 or more (%)
Housing units in structures - Mobile home (%)
Housing units in structures - Boat, RV, van, etc. (%)
House/condo owner moved in on average (years ago)
Renter moved in on average (years ago)
Year householder moved into unit - Moved in 1999 to March 2000 (%)
Year householder moved into unit - Moved in 1995 to 1998 (%)
Year householder moved into unit - Moved in 1990 to 1994 (%)
Year householder moved into unit - Moved in 1980 to 1989 (%)
Year householder moved into unit - Moved in 1970 to 1979 (%)
Year householder moved into unit - Moved in 1969 or earlier (%)
Means of transportation to work - Drove car alone (%)
Means of transportation to work - Carpooled (%)
Means of transportation to work - Public transportation (%)
Means of transportation to work - Bus or trolley bus (%)
Means of transportation to work - Streetcar or trolley car (%)
Means of transportation to work - Subway or elevated (%)
Means of transportation to work - Railroad (%)
Means of transportation to work - Ferryboat (%)
Means of transportation to work - Taxicab (%)
Means of transportation to work - Motorcycle (%)
Means of transportation to work - Bicycle (%)
Means of transportation to work - Walked (%)
Means of transportation to work - Other means (%)
Working at home (%)
Industry diversity
Most Common Industries - Agriculture, forestry, fishing and hunting, and mining (%)
Most Common Industries - Agriculture, forestry, fishing and hunting (%)
Most Common Industries - Mining, quarrying, and oil and gas extraction (%)
Most Common Industries - Construction (%)
Most Common Industries - Manufacturing (%)
Most Common Industries - Wholesale trade (%)
Most Common Industries - Retail trade (%)
Most Common Industries - Transportation and warehousing, and utilities (%)
Most Common Industries - Transportation and warehousing (%)
Most Common Industries - Utilities (%)
Most Common Industries - Information (%)
Most Common Industries - Finance and insurance, and real estate and rental and leasing (%)
Most Common Industries - Finance and insurance (%)
Most Common Industries - Real estate and rental and leasing (%)
Most Common Industries - Professional, scientific, and management, and administrative and waste management services (%)
Most Common Industries - Professional, scientific, and technical services (%)
Most Common Industries - Management of companies and enterprises (%)
Most Common Industries - Administrative and support and waste management services (%)
Most Common Industries - Educational services, and health care and social assistance (%)
Most Common Industries - Educational services (%)
Most Common Industries - Health care and social assistance (%)
Most Common Industries - Arts, entertainment, and recreation, and accommodation and food services (%)
Most Common Industries - Arts, entertainment, and recreation (%)
Most Common Industries - Accommodation and food services (%)
Most Common Industries - Other services, except public administration (%)
Most Common Industries - Public administration (%)
Occupation diversity
Most Common Occupations - Management, business, science, and arts occupations (%)
Most Common Occupations - Management, business, and financial occupations (%)
Most Common Occupations - Management occupations (%)
Most Common Occupations - Business and financial operations occupations (%)
Most Common Occupations - Computer, engineering, and science occupations (%)
Most Common Occupations - Computer and mathematical occupations (%)
Most Common Occupations - Architecture and engineering occupations (%)
Most Common Occupations - Life, physical, and social science occupations (%)
Most Common Occupations - Education, legal, community service, arts, and media occupations (%)
Most Common Occupations - Community and social service occupations (%)
Most Common Occupations - Legal occupations (%)
Most Common Occupations - Education, training, and library occupations (%)
Most Common Occupations - Arts, design, entertainment, sports, and media occupations (%)
Most Common Occupations - Healthcare practitioners and technical occupations (%)
Most Common Occupations - Health diagnosing and treating practitioners and other technical occupations (%)
Most Common Occupations - Health technologists and technicians (%)
Most Common Occupations - Service occupations (%)
Most Common Occupations - Healthcare support occupations (%)
Most Common Occupations - Protective service occupations (%)
Most Common Occupations - Fire fighting and prevention, and other protective service workers including supervisors (%)
Most Common Occupations - Law enforcement workers including supervisors (%)
Most Common Occupations - Food preparation and serving related occupations (%)
Most Common Occupations - Building and grounds cleaning and maintenance occupations (%)
Most Common Occupations - Personal care and service occupations (%)
Most Common Occupations - Sales and office occupations (%)
Most Common Occupations - Sales and related occupations (%)
Most Common Occupations - Office and administrative support occupations (%)
Most Common Occupations - Natural resources, construction, and maintenance occupations (%)
Most Common Occupations - Farming, fishing, and forestry occupations (%)
Most Common Occupations - Construction and extraction occupations (%)
Most Common Occupations - Installation, maintenance, and repair occupations (%)
Most Common Occupations - Production, transportation, and material moving occupations (%)
Most Common Occupations - Production occupations (%)
Most Common Occupations - Transportation occupations (%)
Most Common Occupations - Material moving occupations (%)
People in Group quarters - Institutionalized population (%)
People in Group quarters - Correctional institutions (%)
People in Group quarters - Federal prisons and detention centers (%)
People in Group quarters - Halfway houses (%)
People in Group quarters - Local jails and other confinement facilities (including police lockups) (%)
People in Group quarters - Military disciplinary barracks (%)
People in Group quarters - State prisons (%)
People in Group quarters - Other types of correctional institutions (%)
People in Group quarters - Nursing homes (%)
People in Group quarters - Hospitals/wards, hospices, and schools for the handicapped (%)
People in Group quarters - Hospitals/wards and hospices for chronically ill (%)
People in Group quarters - Hospices or homes for chronically ill (%)
People in Group quarters - Military hospitals or wards for chronically ill (%)
People in Group quarters - Other hospitals or wards for chronically ill (%)
People in Group quarters - Hospitals or wards for drug/alcohol abuse (%)
People in Group quarters - Mental (Psychiatric) hospitals or wards (%)
People in Group quarters - Schools, hospitals, or wards for the mentally retarded (%)
People in Group quarters - Schools, hospitals, or wards for the physically handicapped (%)
People in Group quarters - Institutions for the deaf (%)
People in Group quarters - Institutions for the blind (%)
People in Group quarters - Orthopedic wards and institutions for the physically handicapped (%)
People in Group quarters - Wards in general hospitals for patients who have no usual home elsewhere (%)
People in Group quarters - Wards in military hospitals for patients who have no usual home elsewhere (%)
People in Group quarters - Juvenile institutions (%)
People in Group quarters - Long-term care (%)
People in Group quarters - Homes for abused, dependent, and neglected children (%)
People in Group quarters - Residential treatment centers for emotionally disturbed children (%)
People in Group quarters - Training schools for juvenile delinquents (%)
People in Group quarters - Short-term care, detention or diagnostic centers for delinquent children (%)
People in Group quarters - Type of juvenile institution unknown (%)
People in Group quarters - Noninstitutionalized population (%)
People in Group quarters - College dormitories (includes college quarters off campus) (%)
People in Group quarters - Military quarters (%)
People in Group quarters - On base (%)
People in Group quarters - Barracks, unaccompanied personnel housing (UPH), (Enlisted/Officer), ;and similar group living quarters for military personnel (%)
People in Group quarters - Transient quarters for temporary residents (%)
People in Group quarters - Military ships (%)
People in Group quarters - Group homes (%)
People in Group quarters - Homes or halfway houses for drug/alcohol abuse (%)
People in Group quarters - Homes for the mentally ill (%)
People in Group quarters - Homes for the mentally retarded (%)
People in Group quarters - Homes for the physically handicapped (%)
People in Group quarters - Other group homes (%)
People in Group quarters - Religious group quarters (%)
People in Group quarters - Dormitories (%)
People in Group quarters - Agriculture workers' dormitories on farms (%)
People in Group quarters - Job Corps and vocational training facilities (%)
People in Group quarters - Other workers' dormitories (%)
People in Group quarters - Crews of maritime vessels (%)
People in Group quarters - Other nonhousehold living situations (%)
People in Group quarters - Other noninstitutional group quarters (%)
Residents speaking English at home (%)
Residents speaking English at home - Born in the United States (%)
Residents speaking English at home - Native, born elsewhere (%)
Residents speaking English at home - Foreign born (%)
Residents speaking Spanish at home (%)
Residents speaking Spanish at home - Born in the United States (%)
Residents speaking Spanish at home - Native, born elsewhere (%)
Residents speaking Spanish at home - Foreign born (%)
Residents speaking other language at home (%)
Residents speaking other language at home - Born in the United States (%)
Residents speaking other language at home - Native, born elsewhere (%)
Residents speaking other language at home - Foreign born (%)
Class of Workers - Employee of private company (%)
Class of Workers - Self-employed in own incorporated business (%)
Class of Workers - Private not-for-profit wage and salary workers (%)
Class of Workers - Local government workers (%)
Class of Workers - State government workers (%)
Class of Workers - Federal government workers (%)
Class of Workers - Self-employed workers in own not incorporated business and Unpaid family workers (%)
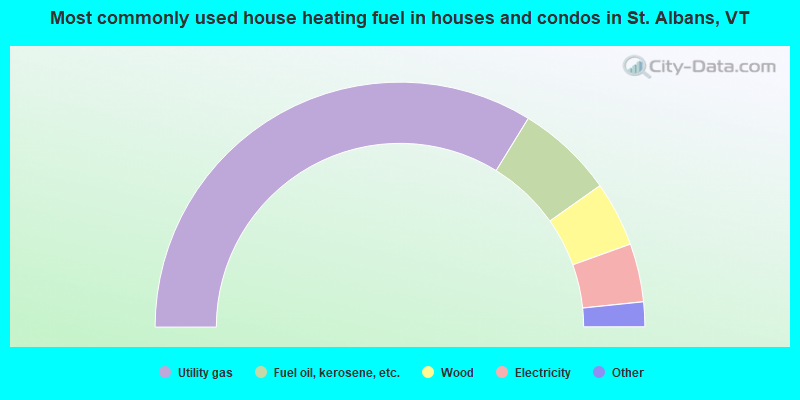
House heating fuel used in houses and condos - Utility gas (%)
House heating fuel used in houses and condos - Bottled, tank, or LP gas (%)
House heating fuel used in houses and condos - Electricity (%)
House heating fuel used in houses and condos - Fuel oil, kerosene, etc. (%)
House heating fuel used in houses and condos - Coal or coke (%)
House heating fuel used in houses and condos - Wood (%)
House heating fuel used in houses and condos - Solar energy (%)
House heating fuel used in houses and condos - Other fuel (%)
House heating fuel used in houses and condos - No fuel used (%)
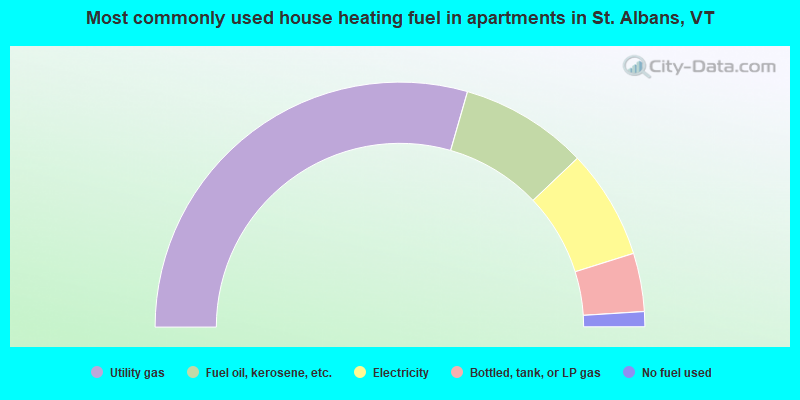
House heating fuel used in apartments - Utility gas (%)
House heating fuel used in apartments - Bottled, tank, or LP gas (%)
House heating fuel used in apartments - Electricity (%)
House heating fuel used in apartments - Fuel oil, kerosene, etc. (%)
House heating fuel used in apartments - Coal or coke (%)
House heating fuel used in apartments - Wood (%)
House heating fuel used in apartments - Solar energy (%)
House heating fuel used in apartments - Other fuel (%)
House heating fuel used in apartments - No fuel used (%)
Armed forces status - In Armed Forces (%)
Armed forces status - Civilian (%)
Armed forces status - Civilian - Veteran (%)
Armed forces status - Civilian - Nonveteran (%)
Fatal accidents locations in years 2005-2021
Fatal accidents locations in 2005
Fatal accidents locations in 2006
Fatal accidents locations in 2007
Fatal accidents locations in 2008
Fatal accidents locations in 2009
Fatal accidents locations in 2010
Fatal accidents locations in 2011
Fatal accidents locations in 2012
Fatal accidents locations in 2013
Fatal accidents locations in 2014
Fatal accidents locations in 2015
Fatal accidents locations in 2016
Fatal accidents locations in 2017
Fatal accidents locations in 2018
Fatal accidents locations in 2019
Fatal accidents locations in 2020
Fatal accidents locations in 2021
Alcohol use - People drinking some alcohol every month (%)
Alcohol use - People not drinking at all (%)
Alcohol use - Average days/month drinking alcohol
Alcohol use - Average drinks/week
Alcohol use - Average days/year people drink much
Audiometry - Average condition of hearing (%)
Audiometry - People that can hear a whisper from across a quiet room (%)
Audiometry - People that can hear normal voice from across a quiet room (%)
Audiometry - Ears ringing, roaring, buzzing (%)
Audiometry - Had a job exposure to loud noise (%)
Audiometry - Had off-work exposure to loud noise (%)
Blood Pressure & Cholesterol - Has high blood pressure (%)
Blood Pressure & Cholesterol - Checking blood pressure at home (%)
Blood Pressure & Cholesterol - Frequently checking blood cholesterol (%)
Blood Pressure & Cholesterol - Has high cholesterol level (%)
Consumer Behavior - Money monthly spent on food at supermarket/grocery store
Consumer Behavior - Money monthly spent on food at other stores
Consumer Behavior - Money monthly spent on eating out
Consumer Behavior - Money monthly spent on carryout/delivered foods
Consumer Behavior - Income spent on food at supermarket/grocery store (%)
Consumer Behavior - Income spent on food at other stores (%)
Consumer Behavior - Income spent on eating out (%)
Consumer Behavior - Income spent on carryout/delivered foods (%)
Current Health Status - General health condition (%)
Current Health Status - Blood donors (%)
Current Health Status - Has blood ever tested for HIV virus (%)
Current Health Status - Left-handed people (%)
Dermatology - People using sunscreen (%)
Diabetes - Diabetics (%)
Diabetes - Had a blood test for high blood sugar (%)
Diabetes - People taking insulin (%)
Diet Behavior & Nutrition - Diet health (%)
Diet Behavior & Nutrition - Milk product consumption (# of products/month)
Diet Behavior & Nutrition - Meals not home prepared (#/week)
Diet Behavior & Nutrition - Meals from fast food or pizza place (#/week)
Diet Behavior & Nutrition - Ready-to-eat foods (#/month)
Diet Behavior & Nutrition - Frozen meals/pizza (#/month)
Drug Use - People that ever used marijuana or hashish (%)
Drug Use - Ever used hard drugs (%)
Drug Use - Ever used any form of cocaine (%)
Drug Use - Ever used heroin (%)
Drug Use - Ever used methamphetamine (%)
Health Insurance - People covered by health insurance (%)
Kidney Conditions-Urology - Avg. # of times urinating at night
Medical Conditions - People with asthma (%)
Medical Conditions - People with anemia (%)
Medical Conditions - People with psoriasis (%)
Medical Conditions - People with overweight (%)
Medical Conditions - Elderly people having difficulties in thinking or remembering (%)
Medical Conditions - People who ever received blood transfusion (%)
Medical Conditions - People having trouble seeing even with glass/contacts (%)
Medical Conditions - People with arthritis (%)
Medical Conditions - People with gout (%)
Medical Conditions - People with congestive heart failure (%)
Medical Conditions - People with coronary heart disease (%)
Medical Conditions - People with angina pectoris (%)
Medical Conditions - People who ever had heart attack (%)
Medical Conditions - People who ever had stroke (%)
Medical Conditions - People with emphysema (%)
Medical Conditions - People with thyroid problem (%)
Medical Conditions - People with chronic bronchitis (%)
Medical Conditions - People with any liver condition (%)
Medical Conditions - People who ever had cancer or malignancy (%)
Mental Health - People who have little interest in doing things (%)
Mental Health - People feeling down, depressed, or hopeless (%)
Mental Health - People who have trouble sleeping or sleeping too much (%)
Mental Health - People feeling tired or having little energy (%)
Mental Health - People with poor appetite or overeating (%)
Mental Health - People feeling bad about themself (%)
Mental Health - People who have trouble concentrating on things (%)
Mental Health - People moving or speaking slowly or too fast (%)
Mental Health - People having thoughts they would be better off dead (%)
Oral Health - Average years since last visit a dentist
Oral Health - People embarrassed because of mouth (%)
Oral Health - People with gum disease (%)
Oral Health - General health of teeth and gums (%)
Oral Health - Average days a week using dental floss/device
Oral Health - Average days a week using mouthwash for dental problem
Oral Health - Average number of teeth
Pesticide Use - Households using pesticides to control insects (%)
Pesticide Use - Households using pesticides to kill weeds (%)
Physical Activity - People doing vigorous-intensity work activities (%)
Physical Activity - People doing moderate-intensity work activities (%)
Physical Activity - People walking or bicycling (%)
Physical Activity - People doing vigorous-intensity recreational activities (%)
Physical Activity - People doing moderate-intensity recreational activities (%)
Physical Activity - Average hours a day doing sedentary activities
Physical Activity - Average hours a day watching TV or videos
Physical Activity - Average hours a day using computer
Physical Functioning - People having limitations keeping them from working (%)
Physical Functioning - People limited in amount of work they can do (%)
Physical Functioning - People that need special equipment to walk (%)
Physical Functioning - People experiencing confusion/memory problems (%)
Physical Functioning - People requiring special healthcare equipment (%)
Prescription Medications - Average number of prescription medicines taking
Preventive Aspirin Use - Adults 40+ taking low-dose aspirin (%)
Reproductive Health - Vaginal deliveries (%)
Reproductive Health - Cesarean deliveries (%)
Reproductive Health - Deliveries resulted in a live birth (%)
Reproductive Health - Pregnancies resulted in a delivery (%)
Reproductive Health - Women breastfeeding newborns (%)
Reproductive Health - Women that had a hysterectomy (%)
Reproductive Health - Women that had both ovaries removed (%)
Reproductive Health - Women that have ever taken birth control pills (%)
Reproductive Health - Women taking birth control pills (%)
Reproductive Health - Women that have ever used Depo-Provera or injectables (%)
Reproductive Health - Women that have ever used female hormones (%)
Sexual Behavior - People 18+ that ever had sex (vaginal, anal, or oral) (%)
Sexual Behavior - Males 18+ that ever had vaginal sex with a woman (%)
Sexual Behavior - Males 18+ that ever performed oral sex on a woman (%)
Sexual Behavior - Males 18+ that ever had anal sex with a woman (%)
Sexual Behavior - Males 18+ that ever had any sex with a man (%)
Sexual Behavior - Females 18+ that ever had vaginal sex with a man (%)
Sexual Behavior - Females 18+ that ever performed oral sex on a man (%)
Sexual Behavior - Females 18+ that ever had anal sex with a man (%)
Sexual Behavior - Females 18+ that ever had any kind of sex with a woman (%)
Sexual Behavior - Average age people first had sex
Sexual Behavior - Average number of female sex partners in lifetime (males 18+)
Sexual Behavior - Average number of female vaginal sex partners in lifetime (males 18+)
Sexual Behavior - Average age people first performed oral sex on a woman (18+)
Sexual Behavior - Average number of woman performed oral sex on in lifetime (18+)
Sexual Behavior - Average number of male sex partners in lifetime (males 18+)
Sexual Behavior - Average number of male anal sex partners in lifetime (males 18+)
Sexual Behavior - Average age people first performed oral sex on a man (18+)
Sexual Behavior - Average number of male oral sex partners in lifetime (18+)
Sexual Behavior - People using protection when performing oral sex (%)
Sexual Behavior - Average number of times people have vaginal or anal sex a year
Sexual Behavior - People having sex without condom (%)
Sexual Behavior - Average number of male sex partners in lifetime (females 18+)
Sexual Behavior - Average number of male vaginal sex partners in lifetime (females 18+)
Sexual Behavior - Average number of female sex partners in lifetime (females 18+)
Sexual Behavior - Circumcised males 18+ (%)
Sleep Disorders - Average hours sleeping at night
Sleep Disorders - People that has trouble sleeping (%)
Smoking-Cigarette Use - People smoking cigarettes (%)
Taste & Smell - People 40+ having problems with smell (%)
Taste & Smell - People 40+ having problems with taste (%)
Taste & Smell - People 40+ that ever had wisdom teeth removed (%)
Taste & Smell - People 40+ that ever had tonsils teeth removed (%)
Taste & Smell - People 40+ that ever had a loss of consciousness because of a head injury (%)
Taste & Smell - People 40+ that ever had a broken nose or other serious injury to face or skull (%)
Taste & Smell - People 40+ that ever had two or more sinus infections (%)
Weight - Average height (inches)
Weight - Average weight (pounds)
Weight - Average BMI
Weight - People that are obese (%)
Weight - People that ever were obese (%)
Weight - People trying to lose weight (%)
Officers per 1,000 residents here:
3.09Vermont average:
1.69
Latest news from St. Albans, VT collected exclusively by city-data.com from local newspapers, TV, and radio stations
Ancestries: American (29.3%), French Canadian (11.6%), Irish (11.4%), French (9.6%), English (8.8%), German (4.5%).
Current Local Time:
Land area: 2.03 square miles.
Population density: 3,419 people per square mile (average).
146 residents are foreign born (1.0% North America , 0.7% Latin America , 0.4% Europe ).
This city:
2.1%Vermont:
4.4%
Median real estate property taxes paid for housing units with mortgages in 2022: $4,131 (1.7%)Median real estate property taxes paid for housing units with no mortgage in 2022: $4,345 (1.6%)
Nearest city with pop. 50,000+: Schenectady, NY
Nearest city with pop. 200,000+: Boston, MA
Nearest city with pop. 1,000,000+: Bronx, NY
Nearest cities:
Latitude: 44.81 N, Longitude: 73.09 W
Daytime population change due to commuting: +2,111 (+30.5%)Workers who live and work in this city: 920 (28.5%)
Area code commonly used in this area: 802
Single-family new house construction building permits:
2022: 2 buildings , average cost: $279,4002021: 1 building , cost: $248,0002020: 9 buildings , average cost: $113,3002019: 1 building , cost: $35,0002018: 5 buildings , average cost: $233,8002017: 3 buildings , average cost: $116,7002016: 7 buildings , average cost: $73,0002015: 3 buildings , average cost: $252,0002012: 2 buildings , average cost: $66,3002011: 2 buildings , average cost: $67,6002010: 1 building , cost: $160,0002009: 2 buildings , average cost: $60,0002008: 1 building , cost: $60,0002001: 1 building , cost: $51,7002000: 3 buildings , average cost: $51,7001999: 2 buildings , average cost: $50,5001998: 2 buildings , average cost: $51,0001997: 1 building , cost: $40,000Unemployment in December 2023:
Most common occupations in St. Albans, VT (%)
Both Males Females
Other production occupations, including supervisors (6.9%)
Preschool, kindergarten, elementary, and middle school teachers (4.2%)
Other office and administrative support workers, including supervisors (4.1%)
Retail sales workers, except cashiers (4.0%)
Building and grounds cleaning and maintenance occupations (4.0%)
Other management occupations, except farmers and farm managers (3.7%)
Information and record clerks, except customer service representatives (3.2%)
Other production occupations, including supervisors (10.0%)
Building and grounds cleaning and maintenance occupations (4.5%)
Material recording, scheduling, dispatching, and distributing workers (4.3%)
Electrical equipment mechanics and other installation, maintenance, and repair workers, including supervisors (4.1%)
Retail sales workers, except cashiers (4.0%)
Metal workers and plastic workers (3.5%)
Other management occupations, except farmers and farm managers (3.4%)
Preschool, kindergarten, elementary, and middle school teachers (7.0%)
Other office and administrative support workers, including supervisors (6.4%)
Secretaries and administrative assistants (6.1%)
Information and record clerks, except customer service representatives (5.5%)
Retail sales workers, except cashiers (4.1%)
Other management occupations, except farmers and farm managers (4.1%)
Registered nurses (3.9%)
Earthquake activity:
St. Albans-area historical earthquake activity is significantly above Vermont state average. It is 76% smaller than the overall U.S. average. On 4/20/2002 at 10:50:47, a magnitude 5.3 (5.3 ML, Depth: 3.0 mi, Class: Moderate, Intensity: VI - VII) earthquake occurred 36.4 miles away from St. Albans center On 4/20/2002 at 10:50:47, a magnitude 5.2 (5.2 MB, 4.2 MS, 5.2 MW, 5.0 MW) earthquake occurred 38.3 miles away from the city center On 10/7/1983 at 10:18:46, a magnitude 5.3 (5.1 MB, 5.3 LG, 5.1 ML) earthquake occurred 85.8 miles away from St. Albans center On 1/19/1982 at 00:14:42, a magnitude 4.7 (4.5 MB, 4.7 MD, 4.5 LG, Class: Light, Intensity: IV - V) earthquake occurred 116.8 miles away from St. Albans center On 10/16/2012 at 23:12:25, a magnitude 4.7 (4.7 ML, Depth: 10.0 mi) earthquake occurred 146.8 miles away from the city center On 4/20/2002 at 11:04:42, a magnitude 3.7 (3.7 ML, Depth: 3.1 mi, Class: Light, Intensity: II - III) earthquake occurred 37.0 miles away from St. Albans center Magnitude types: regional Lg-wave magnitude (LG), body-wave magnitude (MB), duration magnitude (MD), local magnitude (ML), surface-wave magnitude (MS), moment magnitude (MW) Natural disasters: The number of natural disasters in Franklin County (23) is greater than the US average (15).Major Disasters (Presidential) Declared: 19Emergencies Declared: 1Floods: 16, Storms: 15, Winds: 2, Winter Storms: 2, Heavy Rain: 1, Hurricane: 1, Ice Storm: 1, Landslide: 1, Snow: 1, Tropical Storm: 1, Other: 1 (Note: some incidents may be assigned to more than one category). Hospitals and medical centers near St. Albans: REDSTONE VILLA (Nursing Home, about 1 miles away; ST ALBANS, VT)
NORTHWESTERN MEDICAL CENTER INC (about 1 miles away; SAINT ALBANS, VT)
FLETCHER ALLEN HEALTHCARE - ST. ALBANS SATELLITE (Dialysis Facility, about 1 miles away; SAINT ALBANS, VT)
SAINT ALBANS HEALTHCARE AND REHABILITATION CENTER (Nursing Home, about 2 miles away; SAINT ALBANS, VT)
FRANKLIN COUNTY REHAB CENTER LLC (Nursing Home, about 3 miles away; ST ALBANS, VT)
Amtrak station: ST. ALBANS (40 FEDERAL ST.)
.
Services: ticket office, partially wheelchair accessible, enclosed waiting area, public restrooms, public payphones, full-service food facilities, ATM, free short-term parking, free long-term parking, call for car rental service.
Colleges/universities with over 2000 students nearest to St. Albans:
SUNY College at Plattsburgh (about 21 miles; Plattsburgh, NY ; Full-time enrollment: 5,934)
Saint Michael's College (about 23 miles; Colchester, VT ; FT enrollment: 2,336)
Community College of Vermont (about 23 miles; Winooski, VT ; FT enrollment: 3,394)
University of Vermont (about 24 miles; Burlington, VT ; FT enrollment: 11,566)
Champlain College (about 25 miles; Burlington, VT ; FT enrollment: 2,623)
Norwich University (about 51 miles; Northfield, VT ; FT enrollment: 4,221)
Middlebury College (about 56 miles; Middlebury, VT ; FT enrollment: 3,077)
Public high school in St. Albans: BELLOWS FREE ACADEMY UHSD #48 Location: 71 SOUTH MAIN STREET, Grades: 9-12)
Public elementary/middle schools in St. Albans:
See full list of schools located in St. Albans Library in St. Albans: ST. ALBANS FREE Operating income: $286,924; Location: 11 MAIDEN LANE; 34,930 books ; 954 audio materials ; 1,727 video materials ; 1 local licensed databases ; 19 state licensed databases ; 163 print serial subscriptions )
Notable locations in St. Albans: (A) , Saint Albans Free Library (B) , Saint Albans City Hall (C) , Saint Albans Chamber of Commerce (D) , Northwestern Medical Center Information Center (E) , Hathaways Tavern (F) , Franklin County Courthouse (G) , Saint Albans City Fire Department (H) , Amcare Ambulance Service (I) . Display/hide their locations on the map
Shopping Center: (1) . Display/hide its location on the map
Churches in St. Albans include: (A) , First Congregational Church (B) , Holy Angels Church (C) , Saint Lukes Episcopal Church (D) , Saint Marys Parish Church (E) , Saint Pauls United Methodist Church (F) . Display/hide their locations on the map
Cemeteries: (1) , Mount Calvary Cemetery (2) . Display/hide their locations on the map
Parks in St. Albans include: (1) , Barlow Street Playground (2) , Coote Field (3) , Saint Albans Historic District (4) , Taylor Park (5) . Display/hide their locations on the map
Birthplace of: John LeClair - NHL player (Pittsburgh Penguins, born : Jul 5, 1969), Winston Freer - Magician.
Franklin County has a predicted average indoor radon screening level between 2 and 4 pCi/L (pico curies per liter) - Moderate Potential Drinking water stations with addresses in St. Albans and their reported violations in the past:
HIGHGATE SPRINGS POE (Address: 50 SOUTH MAIN STREET Population served: 150, Groundwater under infl of surface water):
Past health violations:
MCL, Average - Between JUL-2013 and SEP-2013, Contaminant: Arsenic. Follow-up actions: St Formal NOV issued (SEP-20-2013), St Public Notif requested (SEP-20-2013), St Tech Assistance Visit (SEP-20-2013)
Past monitoring violations:
Monitoring and Reporting (DBP) - Between JUL-2013 and SEP-2013, Contaminant: Chlorine. Follow-up actions: St Public Notif requested (OCT-30-2013), St Formal NOV issued (OCT-30-2013), St Public Notif received (NOV-14-2013), St Compliance achieved (MAY-09-2014)
Monitoring and Reporting (DBP) - Between JUL-2011 and SEP-2011, Contaminant: TTHM. Follow-up actions: St Formal NOV issued (FEB-21-2012), St Tech Assistance Visit (FEB-21-2012), St Public Notif requested (FEB-21-2012), St Public Notif received (MAR-19-2012)
Monitoring and Reporting (DBP) - Between JUL-2011 and SEP-2011, Contaminant: Total Haloacetic Acids (HAA5). Follow-up actions: St Formal NOV issued (FEB-21-2012), St Tech Assistance Visit (FEB-21-2012), St Public Notif requested (FEB-21-2012), St Public Notif received (MAR-19-2012)
One routine major monitoring violation
Address: 280 South Main Street Serves NY, Population served: 25, Groundwater):
Past monitoring violations:
One routine major monitoring violation
2 minor monitoring violations
Average household size: This city:
2.3 peopleVermont:
2.3 people
Percentage of family households: This city:
55.9%Whole state:
62.5%
Percentage of households with unmarried partners: This city:
11.9%Whole state:
9.2%
Likely homosexual households (counted as self-reported same-sex unmarried-partner households)
Lesbian couples: 0.6% of all households Gay men: 0.3% of all households
People in group quarters in St. Albans in 2010:
44 people in other noninstitutional facilities
27 people in nursing facilities/skilled-nursing facilities
15 people in emergency and transitional shelters (with sleeping facilities) for people experiencing homelessness
People in group quarters in St. Albans in 2000:
36 people in nursing homes
14 people in other noninstitutional group quarters
5 people in religious group quarters
Banks with branches in St. Albans (2011 data):
TD Bank, National Association: St. Albans Plaza Branch at 351 Swanton Rd, Highgate Plaza, branch established on 1969/12/15. Info updated 2010/10/04: Bank assets: $188,912.6 mil, Deposits: $153,149.8 mil, headquarters in Wilmington, DE, positive income , 1314 total offices , Holding Company: Toronto-Dominion Bank, The
For population 15 years and over in St. Albans:
Never married: 36.1%Now married: 43.8%Separated: 2.6%Widowed: 5.8%Divorced: 11.6% For population 25 years and over in St. Albans:
High school or higher: 91.6%Bachelor's degree or higher: 25.0%Graduate or professional degree: 6.1%Unemployed: 3.1%Mean travel time to work (commute): 20.2 minutes
Education Gini index (Inequality in education) Here:
9.5Vermont average:
10.8
Religion statistics for St. Albans, VT (based on Franklin County data)
Religion Adherents Congregations Catholic 16,526 15 Mainline Protestant 3,085 28 Evangelical Protestant 874 8 Other 216 3 Orthodox - - None 27,045 -
Source: Clifford Grammich, Kirk Hadaway, Richard Houseal, Dale E.Jones, Alexei Krindatch, Richie Stanley and Richard H.Taylor. 2012. 2010 U.S.Religion Census: Religious Congregations & Membership Study. Association of Statisticians of American Religious Bodies. Jones, Dale E., et al. 2002. Congregations and Membership in the United States 2000. Nashville, TN: Glenmary Research Center. Graphs represent county-level data
Food Environment Statistics: Number of grocery stores : 17Franklin County :
3.55 / 10,000 pop.Vermont :
3.84 / 10,000 pop.
Number of convenience stores (no gas) : 8This county :
1.67 / 10,000 pop.Vermont :
1.95 / 10,000 pop.
Number of convenience stores (with gas) : 37Here :
7.74 / 10,000 pop.State :
6.40 / 10,000 pop.
Number of full-service restaurants : 35Here :
7.32 / 10,000 pop.Vermont :
11.52 / 10,000 pop.
Adult diabetes rate : This county :
7.3%Vermont :
6.8%
Adult obesity rate : This county :
26.4%Vermont :
22.3%
Low-income preschool obesity rate : This county :
15.2%Vermont :
13.3%
Health and Nutrition: Healthy diet rate : This city:
49.8%Vermont:
52.9%
Average overall health of teeth and gums : This city:
47.7%Vermont:
51.9%
People feeling badly about themselves : St. Albans:
19.4%Vermont:
21.2%
People not drinking alcohol at all : Average hours sleeping at night : St. Albans:
6.8Vermont:
6.9
General health condition : This city:
57.9%State:
59.7%
Average condition of hearing : This city:
79.0%Vermont:
79.6%
More about Health and Nutrition of St. Albans, VT Residents
St. Albans government finances - Expenditure in 2021 (per resident):
Construction - Regular Highways: $11,366,000 ($1637.28)
Sewerage: $4,239,000 ($610.63)Water Utilities: $184,000 ($26.51)Current Operations - Police Protection: $3,519,000 ($506.91)
Sewerage: $2,359,000 ($339.82)Water Utilities: $1,735,000 ($249.93)Central Staff Services: $1,229,000 ($177.04)General - Other: $1,007,000 ($145.06)Regular Highways: $706,000 ($101.70)Parks and Recreation: $657,000 ($94.64)Local Fire Protection: $419,000 ($60.36)Financial Administration: $254,000 ($36.59)Parking Facilities: $199,000 ($28.67)Housing and Community Development: $182,000 ($26.22)Judicial and Legal Services: $95,000 ($13.68)Libraries: $37,000 ($5.33)General - Interest on Debt: $771,000 ($111.06)
Other Capital Outlay - Police Protection: $110,000 ($15.85)
Sewerage: $29,000 ($4.18)Parks and Recreation: $23,000 ($3.31)Local Fire Protection: $16,000 ($2.30)Water Utilities: $10,000 ($1.44)Water Utilities - Interest on Debt: $220,000 ($31.69)
St. Albans government finances - Revenue in 2021 (per resident):
Charges - Sewerage: $3,300,000 ($475.37)
Other: $1,080,000 ($155.57)Parks and Recreation: $759,000 ($109.33)Parking Facilities: $208,000 ($29.96)Local Intergovernmental - Other: $678,000 ($97.67)
Miscellaneous - Rents: $137,000 ($19.73)
General Revenue - Other: $87,000 ($12.53)Interest Earnings: $40,000 ($5.76)Fines and Forfeits: $33,000 ($4.75)Revenue - Water Utilities: $2,413,000 ($347.59)
State Intergovernmental - Other: $998,000 ($143.76)
Highways: $854,000 ($123.02)General Local Government Support: $61,000 ($8.79)Sewerage: $29,000 ($4.18)Housing and Community Development: $16,000 ($2.30)Tax - Property: $5,963,000 ($858.97)
Other License: $39,000 ($5.62)
St. Albans government finances - Debt in 2021 (per resident):
Long Term Debt - Beginning Outstanding - Unspecified Public Purpose: $29,506,000 ($4250.36)
Outstanding Unspecified Public Purpose: $27,976,000 ($4029.96)Retired Unspecified Public Purpose: $1,530,000 ($220.40)
St. Albans government finances - Cash and Securities in 2021 (per resident):
Other Funds - Cash and Securities: $3,934,000 ($566.70)
Businesses in St. Albans, VT
Name Count Name Count
Blockbuster 1 Rite Aid 1 Domino's Pizza 1 Staples 1 GNC 1 Toyota 1 Nike 1
Strongest AM radio stations in St. Albans:
WRSA (1420 AM; 1 kW; ST. ALBANS, VT)
WCHP (760 AM; 35 kW; CHAMPLAIN, NY; Owner: CHAMPLAIN RADIO, INC.)
WVMT (620 AM; 5 kW; BURLINGTON, VT; Owner: SISON BROADCASTING, INC.)
WICY (1490 AM; 50 kW; MALONE, NY; Owner: CARTIER COMMUNICATIONS INC.)
WEAV (960 AM; 5 kW; PLATTSBURGH, NY; Owner: CLEAR CHANNEL BROADCASTING LICENSES, INC.)
WTWK (1070 AM; daytime; 5 kW; PLATTSBURGH, NY; Owner: CHAMPLAIN COMMUNICATIONS CORPORATION)
WVAA (1390 AM; 5 kW; BURLINGTON, VT; Owner: RADIO VERMONT, KDR, LLC)
WDEV (550 AM; 5 kW; WATERBURY, VT; Owner: RADIO VERMONT, INC.)
WGY (810 AM; 50 kW; SCHENECTADY, NY; Owner: CLEAR CHANNEL BROADCASTING LICENSES, INC.)
WNNZ (640 AM; 50 kW; WESTFIELD, MA; Owner: CLEAR CHANNEL BROADCASTING LICENSES, INC.)
WRKO (680 AM; 50 kW; BOSTON, MA; Owner: ENTERCOM BOSTON LICENSE, LLC)
WIRY (1340 AM; 1 kW; PLATTSBURGH, NY; Owner: HOMETOWN RADIO INC)
WCRN (830 AM; 50 kW; WORCESTER, MA; Owner: CARTER BROADCASTING CORPORATION)
Strongest FM radio stations in St. Albans:
WLFE-FM (102.3 FM; ST. ALBANS, VT; Owner: CHAMPLAIN COMMUNICATIONS CORP.)
WEZF (92.9 FM; BURLINGTON, VT; Owner: CAPSTAR TX LIMITED PARTNERSHIP)
WVPS (107.9 FM; BURLINGTON, VT; Owner: VERMONT PUBLIC RADIO)
WLKC (103.3 FM; WATERBURY, VT; Owner: RADIO BROADCASTING SERVICES, INC.)
WCVT (101.7 FM; STOWE, VT; Owner: RADIO VERMONT CLASSICS, L.L.C.)
WCEL (91.9 FM; PLATTSBURGH, NY; Owner: WAMC)
WNCS (104.7 FM; MONTPELIER, VT; Owner: MONTPELIER BROADCASTING, INC.)
WCPV (101.3 FM; ESSEX, NY; Owner: CAPSTAR TX LIMITED PARTNERSHIP)
WDEV-FM (96.1 FM; WARREN, VT; Owner: RADIO VERMONT, INC.)
WBTZ (99.9 FM; PLATTSBURGH, NY; Owner: PLATTSBURGH BROADCASTING CORPORATION)
WXLU (88.3 FM; PERU, NY; Owner: THE ST. LAWRENCE UNIVERSITY)
WYUL (94.7 FM; CHATEAUGAY, NY; Owner: CARTIER COMMUNICATIONS INC.)
WGLY-FM (91.5 FM; BOLTON, VT; Owner: CHRISTIAN MINISTRIES, INC.)
WXZO (96.7 FM; WILLSBORO, NY; Owner: CAPSTAR TX LIMITED PARTNERSHIP)
WIZN (106.7 FM; VERGENNES, VT; Owner: BURLINGTON BROADCASTERS, INC.)
WXXX (95.5 FM; SOUTH BURLINGTON, VT; Owner: SISON BROADCASTING, INC.)
TV broadcast stations around St. Albans:
W52CD (Channel 52; ST. ALBANS, VT; Owner: VERMONT LOW POWER TV, LP)
WPTZ (Channel 5; NORTH POLE, NY; Owner: HEARST-ARGYLE STATIONS, INC.)
WVNY (Channel 22; BURLINGTON, VT; Owner: C-22 FCC LICENSEE SUBSIDIARY, LLC)
Medal of Honor Recipients
Medal of Honor Recipients born in St. Albans: Erastus W. Jewett, William Tilton.
National Bridge Inventory (NBI) Statistics 20 Number of bridges197ft / 60.1m Total length $9,841,000 Total costs175,365 Total average daily traffic18,163 Total average daily truck traffic
New bridges - historical statistics
1 1910-1919 1 1930-1939 15 1960-1969 1 1970-1979 1 1980-1989 1 1990-1999
See full National Bridge Inventory statistics for St. Albans, VT
FCC Registered Cell Phone Towers: 2 (
See the full list of FCC Registered Cell Phone Towers in St. Albans )
FCC Registered Antenna Towers: 19 (
See the full list of FCC Registered Antenna Towers )
FCC Registered Broadcast Land Mobile Towers: 3
Lat: 44.797667 Lon: -73.096167, Call Sign: WQCT444, Assigned Frequencies: 462.187 MHz, 462.287 MHz, 462.312 MHz, 462.337 MHz, 467.362 MHz, Grant Date: 04/16/2015, Expiration Date: 05/19/2025, Certifier: Don Lane, Registrant: Ben & Jerry\'s, 900 Industrial Park Road, St. Albans, VT 05478, Phone: (802) 752-1380, Email:
Lat: 44.802417 Lon: -73.088250, Call Sign: WQKE563, Assigned Frequencies: 451.712 MHz, 456.712 MHz, 452.287 MHz, 457.287 MHz, Grant Date: 04/20/2009, Expiration Date: 04/20/2019, Cancellation Date: 06/22/2019, Certifier: Juan Martinez, Registrant: Cara Enterprises Inc, Salt Lake City, UT 84117-0503, Phone: (801) 278-9728, Fax: (801) 278-7239, Email:
Lat: 44.819778 Lon: -73.091222, Call Sign: WQKK263, Assigned Frequencies: 451.462 MHz, 456.462 MHz, 451.587 MHz, 456.587 MHz, 451.712 MHz, 452.287 MHz, 456.712 MHz, 457.287 MHz, Grant Date: 06/04/2019, Expiration Date: 06/19/2029, Certifier: Derek Madsen, Registrant: Cara Enterprises Inc, Las Vegas, NV 89140-0124, Phone: (702) 838-9728, Fax: (702) 363-4607, Email:
FCC Registered Microwave Towers: 3
FRENCH HILL, Valley Watch Road (Lat: 44.801694 Lon: -73.050417), Type: Tower, Structure height: 36.6 m, Call Sign: WQOQ941, Assigned Frequencies: 10755.0 MHz, Grant Date: 01/03/2012, Expiration Date: 01/03/2022, Cancellation Date: 03/05/2022, Certifier: Phil Chitwood, Registrant: Vermont Transco LLC, 366 Pinnacle Ridge Road, Rutland, VT 05701, Phone: (802) 772-3777, Email:
St. Albans-04, 560 Lord Road (Lat: 44.865222 Lon: -73.153194), Type: Silo, Structure height: 24.4 m, Overall height: 27.4 m, Call Sign: WQUZ550, Assigned Frequencies: 11225.0 MHz, 11425.0 MHz, 11225.0 MHz, 11425.0 MHz, 11225.0 MHz, 11425.0 MHz, 11225.0 MHz, 11425.0 MHz, 11225.0 MHz, 11425.0 MHz... (+14 more), Grant Date: 12/01/2014, Expiration Date: 12/01/2024, Certifier: Fran Stocker, Registrant: Radyn, Inc, Silver Spring, MD 20914, Phone: (301) 493-5171, Fax: (301) 576-4553, Email:
St. Albans, Lat: 44.813444 Lon: -73.083583, Call Sign: WQXP720, Assigned Frequencies: 956.381 MHz, Grant Date: 05/03/2016, Expiration Date: 05/03/2026, Certifier: Allen W Robtoy, Registrant: Sensus, 450 N Gallatin Avenue, Uniontown, PA 15401, Phone: (800) 638-3748, Fax: (800) 888-2403, Email:
FCC Registered Amateur Radio Licenses: 5
Call Sign: N1CFP, Licensee ID: L00834458, Grant Date: 03/23/2004, Expiration Date: 05/24/2014, Cancellation Date: 05/25/2016, Registrant: John M Foster, 8 Stevens Avenue, St. Albans, VT 05478Call Sign: KB1MNI, Licensee ID: L01043448, Grant Date: 06/04/2015, Expiration Date: 07/21/2025, Certifier: Jason P Dunbar, Registrant: Jason P Dunbar, 25 Stowell Street, Apt 27, St. Albans, VT 05478Call Sign: KB1ZBX, Licensee ID: L01754012, Grant Date: 12/18/2012, Expiration Date: 12/18/2022, Cancellation Date: 01/18/2017, Certifier: Scott R Myers, Registrant: Scott R Myers, 34 Kingman St, St. Albans, VT 05478Call Sign: KC1JHZ, Licensee ID: L02172934, Grant Date: 03/26/2018, Expiration Date: 03/26/2028, Cancellation Date: 05/11/2018, Certifier: Evan J Hamilton, Registrant: Evan J Hamilton, 16 Country Ln, St. Albans, VT 05478Call Sign: N1EHU, Previous Call Sign: KC1JHZ, Licensee ID: L02172934, Grant Date: 05/11/2018, Expiration Date: 05/11/2028, Certifier: Evan J Hamilton, Registrant: Evan J Hamilton, 16 Country Ln, St. Albans, VT 05478
Home Mortgage Disclosure Act Aggregated Statistics For Year 2009(Based on 2 full tracts) A) FHA, FSA/RHS & VA B) Conventional C) Refinancings D) Home Improvement Loans E) Loans on Dwellings For 5+ Families F) Non-occupant Loans on G) Loans On Manufactured Number Average Value Number Average Value Number Average Value Number Average Value Number Average Value Number Average Value Number Average Value
LOANS ORIGINATED 26 $161,115 31 $143,613 146 $139,753 21 $69,190 2 $907,500 24 $130,625 1 $85,000 APPLICATIONS APPROVED, NOT ACCEPTED 3 $125,333 3 $135,667 14 $155,571 3 $24,333 0 $0 2 $139,500 1 $8,000 APPLICATIONS DENIED 6 $149,333 11 $125,364 36 $159,778 13 $54,538 0 $0 6 $167,167 2 $55,000 APPLICATIONS WITHDRAWN 1 $148,000 3 $167,667 24 $132,917 1 $4,000 0 $0 1 $114,000 0 $0 FILES CLOSED FOR INCOMPLETENESS 2 $136,000 2 $144,000 6 $211,667 0 $0 0 $0 1 $220,000 0 $0
Aggregated Statistics For Year 2008(Based on 2 full tracts) A) FHA, FSA/RHS & VA B) Conventional C) Refinancings D) Home Improvement Loans E) Loans on Dwellings For 5+ Families F) Non-occupant Loans on G) Loans On Manufactured Number Average Value Number Average Value Number Average Value Number Average Value Number Average Value Number Average Value Number Average Value
LOANS ORIGINATED 24 $173,375 45 $160,622 76 $138,658 21 $45,762 3 $328,667 17 $138,647 0 $0 APPLICATIONS APPROVED, NOT ACCEPTED 0 $0 7 $136,286 20 $127,550 4 $31,250 1 $275,000 5 $110,000 0 $0 APPLICATIONS DENIED 3 $197,000 14 $147,643 34 $145,206 14 $51,000 0 $0 2 $140,000 5 $13,800 APPLICATIONS WITHDRAWN 1 $193,000 9 $130,667 33 $143,879 1 $261,000 0 $0 5 $88,400 2 $122,000 FILES CLOSED FOR INCOMPLETENESS 1 $175,000 0 $0 4 $116,500 0 $0 1 $395,000 1 $148,000 0 $0
Aggregated Statistics For Year 2007(Based on 2 full tracts) A) FHA, FSA/RHS & VA B) Conventional C) Refinancings D) Home Improvement Loans E) Loans on Dwellings For 5+ Families F) Non-occupant Loans on G) Loans On Manufactured Number Average Value Number Average Value Number Average Value Number Average Value Number Average Value Number Average Value Number Average Value
LOANS ORIGINATED 2 $225,500 95 $155,747 123 $129,398 36 $69,472 3 $357,667 30 $146,933 2 $94,500 APPLICATIONS APPROVED, NOT ACCEPTED 2 $277,500 16 $142,438 24 $123,708 2 $51,500 0 $0 2 $177,000 1 $87,000 APPLICATIONS DENIED 0 $0 25 $139,000 41 $162,878 14 $59,286 1 $813,000 8 $103,625 11 $126,727 APPLICATIONS WITHDRAWN 1 $143,000 12 $145,417 37 $145,892 1 $360,000 0 $0 6 $85,167 1 $145,000 FILES CLOSED FOR INCOMPLETENESS 0 $0 1 $146,000 11 $165,636 0 $0 0 $0 0 $0 0 $0
Aggregated Statistics For Year 2006(Based on 2 full tracts) A) FHA, FSA/RHS & VA B) Conventional C) Refinancings D) Home Improvement Loans E) Loans on Dwellings For 5+ Families F) Non-occupant Loans on G) Loans On Manufactured Number Average Value Number Average Value Number Average Value Number Average Value Number Average Value Number Average Value Number Average Value
LOANS ORIGINATED 6 $202,333 136 $128,926 124 $146,863 31 $52,258 6 $369,167 32 $138,625 3 $68,667 APPLICATIONS APPROVED, NOT ACCEPTED 0 $0 16 $98,938 28 $121,893 5 $52,400 0 $0 3 $61,667 1 $24,000 APPLICATIONS DENIED 3 $183,000 30 $128,233 75 $143,267 9 $73,000 1 $150,000 7 $117,143 3 $96,000 APPLICATIONS WITHDRAWN 0 $0 19 $136,158 56 $134,179 0 $0 0 $0 5 $136,000 0 $0 FILES CLOSED FOR INCOMPLETENESS 0 $0 3 $149,000 10 $142,100 1 $168,000 0 $0 2 $173,000 0 $0
Aggregated Statistics For Year 2005(Based on 2 full tracts) A) FHA, FSA/RHS & VA B) Conventional C) Refinancings D) Home Improvement Loans E) Loans on Dwellings For 5+ Families F) Non-occupant Loans on G) Loans On Manufactured Number Average Value Number Average Value Number Average Value Number Average Value Number Average Value Number Average Value Number Average Value
LOANS ORIGINATED 9 $167,667 138 $126,094 160 $131,156 28 $72,214 7 $367,429 39 $126,615 1 $43,000 APPLICATIONS APPROVED, NOT ACCEPTED 1 $139,000 21 $110,524 14 $114,500 5 $54,600 0 $0 5 $116,600 1 $43,000 APPLICATIONS DENIED 1 $139,000 26 $108,577 81 $124,543 14 $68,000 0 $0 9 $149,333 9 $75,000 APPLICATIONS WITHDRAWN 0 $0 19 $117,684 64 $135,109 3 $172,000 0 $0 6 $136,667 4 $34,000 FILES CLOSED FOR INCOMPLETENESS 0 $0 2 $92,500 31 $135,226 1 $35,000 0 $0 4 $146,250 1 $25,000
Aggregated Statistics For Year 2004(Based on 2 full tracts) A) FHA, FSA/RHS & VA B) Conventional C) Refinancings D) Home Improvement Loans E) Loans on Dwellings For 5+ Families F) Non-occupant Loans on G) Loans On Manufactured Number Average Value Number Average Value Number Average Value Number Average Value Number Average Value Number Average Value Number Average Value
LOANS ORIGINATED 4 $130,500 142 $129,169 168 $110,185 30 $58,867 3 $222,667 47 $125,574 5 $81,000 APPLICATIONS APPROVED, NOT ACCEPTED 2 $204,000 3 $202,000 14 $76,429 4 $106,750 0 $0 2 $160,000 0 $0 APPLICATIONS DENIED 1 $167,000 19 $106,421 55 $123,745 16 $31,625 0 $0 4 $103,000 4 $36,250 APPLICATIONS WITHDRAWN 0 $0 12 $144,083 32 $104,219 5 $42,600 1 $80,000 4 $154,000 1 $37,000 FILES CLOSED FOR INCOMPLETENESS 0 $0 3 $140,667 6 $92,500 0 $0 0 $0 1 $149,000 0 $0
Aggregated Statistics For Year 2003(Based on 2 full tracts) A) FHA, FSA/RHS & VA B) Conventional C) Refinancings D) Home Improvement Loans E) Loans on Dwellings For 5+ Families F) Non-occupant Loans on Number Average Value Number Average Value Number Average Value Number Average Value Number Average Value Number Average Value
LOANS ORIGINATED 15 $150,467 107 $127,551 382 $105,518 4 $52,750 3 $163,000 46 $111,457 APPLICATIONS APPROVED, NOT ACCEPTED 0 $0 7 $127,714 31 $95,516 3 $34,333 0 $0 5 $93,200 APPLICATIONS DENIED 0 $0 15 $93,933 62 $104,548 4 $36,500 0 $0 7 $99,286 APPLICATIONS WITHDRAWN 1 $150,000 18 $123,833 50 $113,560 1 $120,000 0 $0 3 $132,000 FILES CLOSED FOR INCOMPLETENESS 0 $0 4 $90,000 8 $94,250 2 $29,000 0 $0 0 $0
Aggregated Statistics For Year 2002(Based on 2 full tracts) A) FHA, FSA/RHS & VA B) Conventional C) Refinancings D) Home Improvement Loans E) Loans on Dwellings For 5+ Families F) Non-occupant Loans on Number Average Value Number Average Value Number Average Value Number Average Value Number Average Value Number Average Value
LOANS ORIGINATED 17 $144,000 92 $109,435 264 $99,193 5 $27,000 3 $110,000 38 $90,842 APPLICATIONS APPROVED, NOT ACCEPTED 1 $130,000 8 $106,875 14 $78,643 0 $0 0 $0 3 $117,333 APPLICATIONS DENIED 1 $79,000 8 $87,375 34 $80,294 6 $31,500 0 $0 2 $83,000 APPLICATIONS WITHDRAWN 2 $135,500 6 $109,667 22 $88,591 1 $30,000 0 $0 2 $41,000 FILES CLOSED FOR INCOMPLETENESS 0 $0 1 $90,000 11 $98,727 0 $0 0 $0 0 $0
Aggregated Statistics For Year 2001(Based on 2 full tracts) A) FHA, FSA/RHS & VA B) Conventional C) Refinancings D) Home Improvement Loans E) Loans on Dwellings For 5+ Families F) Non-occupant Loans on Number Average Value Number Average Value Number Average Value Number Average Value Number Average Value Number Average Value
LOANS ORIGINATED 34 $119,235 100 $108,070 215 $90,795 5 $6,400 4 $174,750 25 $84,480 APPLICATIONS APPROVED, NOT ACCEPTED 0 $0 4 $52,750 18 $67,611 1 $54,000 0 $0 0 $0 APPLICATIONS DENIED 2 $101,000 28 $47,714 48 $75,792 8 $15,875 0 $0 4 $75,750 APPLICATIONS WITHDRAWN 5 $113,400 8 $98,250 26 $87,615 1 $9,000 0 $0 2 $25,000 FILES CLOSED FOR INCOMPLETENESS 0 $0 1 $69,000 7 $62,857 0 $0 0 $0 1 $69,000
Aggregated Statistics For Year 2000(Based on 2 full tracts) A) FHA, FSA/RHS & VA B) Conventional C) Refinancings D) Home Improvement Loans E) Loans on Dwellings For 5+ Families F) Non-occupant Loans on Number Average Value Number Average Value Number Average Value Number Average Value Number Average Value Number Average Value
LOANS ORIGINATED 28 $102,893 88 $97,966 50 $93,460 12 $10,750 2 $124,000 17 $107,529 APPLICATIONS APPROVED, NOT ACCEPTED 3 $73,333 9 $135,000 11 $79,364 6 $12,333 0 $0 3 $75,000 APPLICATIONS DENIED 2 $118,000 26 $62,615 38 $47,447 17 $20,118 0 $0 2 $61,500 APPLICATIONS WITHDRAWN 3 $117,667 11 $89,000 21 $64,333 3 $21,667 0 $0 1 $136,000 FILES CLOSED FOR INCOMPLETENESS 1 $122,000 1 $52,000 5 $47,800 0 $0 0 $0 0 $0
Aggregated Statistics For Year 1999(Based on 2 full tracts) A) FHA, FSA/RHS & VA B) Conventional C) Refinancings D) Home Improvement Loans E) Loans on Dwellings For 5+ Families F) Non-occupant Loans on Number Average Value Number Average Value Number Average Value Number Average Value Number Average Value Number Average Value
LOANS ORIGINATED 17 $93,671 83 $95,745 104 $79,607 20 $16,723 1 $47,640 21 $78,553 APPLICATIONS APPROVED, NOT ACCEPTED 0 $0 11 $66,901 21 $78,777 2 $10,980 0 $0 3 $82,973 APPLICATIONS DENIED 1 $64,790 30 $63,425 52 $67,809 13 $27,601 0 $0 15 $75,551 APPLICATIONS WITHDRAWN 2 $84,325 12 $65,442 24 $63,308 1 $28,580 0 $0 4 $89,242 FILES CLOSED FOR INCOMPLETENESS 0 $0 2 $71,935 8 $79,828 1 $14,500 0 $0 1 $81,940
Detailed HMDA statistics for the following Tracts:
0107.00
, 0108.00
Private Mortgage Insurance Companies Aggregated Statistics For Year 2009(Based on 2 full tracts) A) Conventional B) Refinancings Number Average Value Number Average Value
LOANS ORIGINATED 8 $157,250 7 $149,429 APPLICATIONS APPROVED, NOT ACCEPTED 1 $113,000 1 $155,000 APPLICATIONS DENIED 4 $110,750 1 $318,000 APPLICATIONS WITHDRAWN 1 $142,000 0 $0 FILES CLOSED FOR INCOMPLETENESS 1 $113,000 0 $0
Aggregated Statistics For Year 2008(Based on 2 full tracts) A) Conventional B) Refinancings C) Non-occupant Loans on Number Average Value Number Average Value Number Average Value
LOANS ORIGINATED 16 $147,562 9 $182,111 2 $133,000 APPLICATIONS APPROVED, NOT ACCEPTED 5 $180,800 2 $212,500 0 $0 APPLICATIONS DENIED 1 $105,000 0 $0 0 $0 APPLICATIONS WITHDRAWN 0 $0 0 $0 0 $0 FILES CLOSED FOR INCOMPLETENESS 0 $0 0 $0 0 $0
Aggregated Statistics For Year 2007(Based on 2 full tracts) A) Conventional B) Refinancings C) Non-occupant Loans on Number Average Value Number Average Value Number Average Value
LOANS ORIGINATED 41 $165,463 8 $188,625 1 $97,000 APPLICATIONS APPROVED, NOT ACCEPTED 5 $177,200 0 $0 0 $0 APPLICATIONS DENIED 0 $0 0 $0 0 $0 APPLICATIONS WITHDRAWN 0 $0 1 $121,000 0 $0 FILES CLOSED FOR INCOMPLETENESS 0 $0 0 $0 0 $0
Aggregated Statistics For Year 2006(Based on 2 full tracts) A) Conventional B) Refinancings C) Non-occupant Loans on D) Loans On Manufactured Number Average Value Number Average Value Number Average Value Number Average Value
LOANS ORIGINATED 31 $157,613 6 $189,333 2 $124,000 1 $143,000 APPLICATIONS APPROVED, NOT ACCEPTED 4 $135,000 1 $168,000 1 $138,000 0 $0 APPLICATIONS DENIED 4 $115,750 0 $0 0 $0 0 $0 APPLICATIONS WITHDRAWN 2 $139,000 0 $0 2 $139,000 0 $0 FILES CLOSED FOR INCOMPLETENESS 0 $0 1 $153,000 0 $0 0 $0
Aggregated Statistics For Year 2005(Based on 2 full tracts) A) Conventional B) Refinancings C) Non-occupant Loans on Number Average Value Number Average Value Number Average Value
LOANS ORIGINATED 35 $146,343 11 $171,545 4 $163,250 APPLICATIONS APPROVED, NOT ACCEPTED 8 $111,375 5 $167,600 1 $112,000 APPLICATIONS DENIED 1 $142,000 0 $0 0 $0 APPLICATIONS WITHDRAWN 2 $142,000 0 $0 0 $0 FILES CLOSED FOR INCOMPLETENESS 1 $137,000 1 $180,000 0 $0
Aggregated Statistics For Year 2004(Based on 2 full tracts) A) Conventional B) Refinancings C) Non-occupant Loans on D) Loans On Manufactured Number Average Value Number Average Value Number Average Value Number Average Value
LOANS ORIGINATED 48 $140,667 6 $135,000 9 $132,333 1 $77,000 APPLICATIONS APPROVED, NOT ACCEPTED 5 $137,200 3 $117,667 0 $0 1 $22,000 APPLICATIONS DENIED 0 $0 0 $0 0 $0 0 $0 APPLICATIONS WITHDRAWN 2 $121,500 2 $136,000 0 $0 0 $0 FILES CLOSED FOR INCOMPLETENESS 0 $0 0 $0 0 $0 0 $0
Aggregated Statistics For Year 2003(Based on 2 full tracts) A) Conventional B) Refinancings C) Non-occupant Loans on Number Average Value Number Average Value Number Average Value
LOANS ORIGINATED 51 $137,902 28 $123,786 4 $101,000 APPLICATIONS APPROVED, NOT ACCEPTED 6 $102,167 11 $131,273 2 $86,500 APPLICATIONS DENIED 0 $0 0 $0 0 $0 APPLICATIONS WITHDRAWN 3 $84,333 0 $0 0 $0 FILES CLOSED FOR INCOMPLETENESS 0 $0 0 $0 0 $0
Aggregated Statistics For Year 2002(Based on 2 full tracts) A) Conventional B) Refinancings C) Non-occupant Loans on Number Average Value Number Average Value Number Average Value
LOANS ORIGINATED 41 $121,537 17 $128,059 4 $113,000 APPLICATIONS APPROVED, NOT ACCEPTED 5 $101,000 6 $115,500 0 $0 APPLICATIONS DENIED 1 $62,000 0 $0 0 $0 APPLICATIONS WITHDRAWN 1 $135,000 1 $107,000 0 $0 FILES CLOSED FOR INCOMPLETENESS 0 $0 0 $0 0 $0
Aggregated Statistics For Year 2001(Based on 2 full tracts) A) Conventional B) Refinancings Number Average Value Number Average Value
LOANS ORIGINATED 41 $114,927 23 $114,217 APPLICATIONS APPROVED, NOT ACCEPTED 4 $139,500 9 $93,556 APPLICATIONS DENIED 2 $138,000 0 $0 APPLICATIONS WITHDRAWN 1 $133,000 1 $118,000 FILES CLOSED FOR INCOMPLETENESS 0 $0 0 $0
Aggregated Statistics For Year 2000(Based on 2 full tracts) A) Conventional B) Refinancings Number Average Value Number Average Value
LOANS ORIGINATED 35 $103,714 6 $84,833 APPLICATIONS APPROVED, NOT ACCEPTED 6 $119,167 1 $83,000 APPLICATIONS DENIED 2 $157,000 0 $0 APPLICATIONS WITHDRAWN 1 $84,000 0 $0 FILES CLOSED FOR INCOMPLETENESS 0 $0 0 $0
Aggregated Statistics For Year 1999(Based on 2 full tracts) A) Conventional B) Refinancings C) Non-occupant Loans on Number Average Value Number Average Value Number Average Value
LOANS ORIGINATED 42 $94,223 11 $100,738 2 $70,985 APPLICATIONS APPROVED, NOT ACCEPTED 1 $89,560 4 $85,502 1 $93,750 APPLICATIONS DENIED 1 $82,890 1 $99,550 0 $0 APPLICATIONS WITHDRAWN 0 $0 0 $0 0 $0 FILES CLOSED FOR INCOMPLETENESS 0 $0 0 $0 0 $0
Detailed PMIC statistics for the following Tracts:
0107.00
, 0108.00 St. Albans compared to Vermont state average:
Unemployed percentage significantly below state average. Black race population percentage below state average. Hispanic race population percentage below state average. Median age significantly below state average. Foreign-born population percentage significantly below state average. Renting percentage above state average. House age above state average. Number of college students below state average. St. Albans on our top lists :
#28 on the list of "Top 101 cities with the largest city-data.com crime index increase from 2002 to 2012 (population 5,000+)"
#49 on the list of "Top 101 cities with the largest percentage of unmarried partner households (population 5,000+)"
#95 (05478) on the list of "Top 101 zip codes with the largest percentage of French Canadian first ancestries (pop 5,000+)"
#17 on the list of "Top 101 counties with the highest percentage of residents that keep firearms around their homes"
#63 on the list of "Top 101 counties with the highest percentage of residents that smoked 100+ cigarettes in their lives"
Top Patent Applicants
Kenneth J. Miller, Ii (10)
Mete Erturk (8)
John Knapp (5)
Sinclair A. Adam, Jr. (5)
Matthew D. Diehl (4)
Richard Bruno (3)
Kenneth James Miller, Ii (3)
Thomas Spencer Stanhope (3)
Kenneth J. Miller (3)
Abdeslam Bouti (3)
Total of 58 patent applications in 2008-2024.

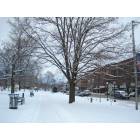

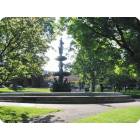
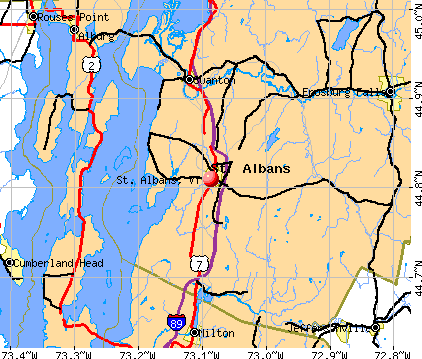


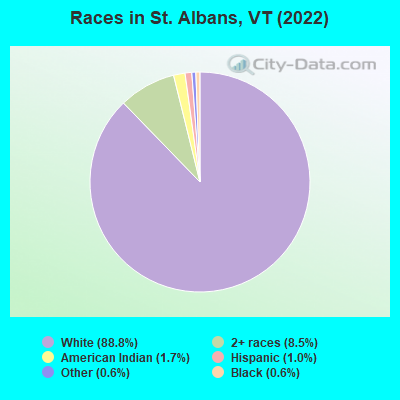
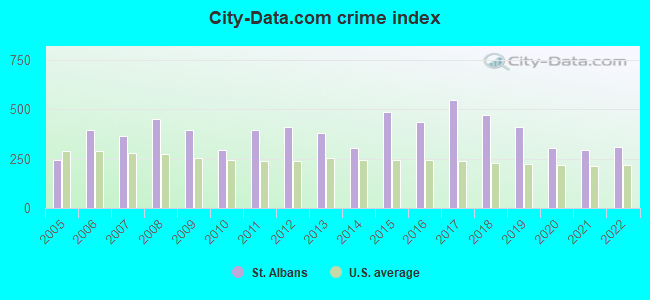
 Recent articles from our blog. Our writers, many of them Ph.D. graduates or candidates, create easy-to-read articles on a wide variety of topics.

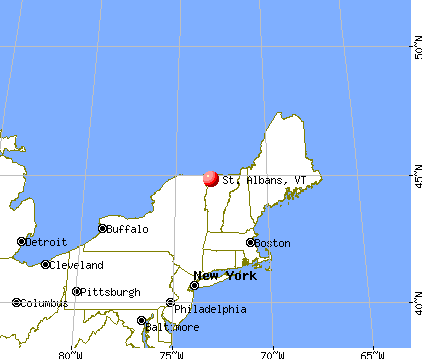
 (145.0 miles
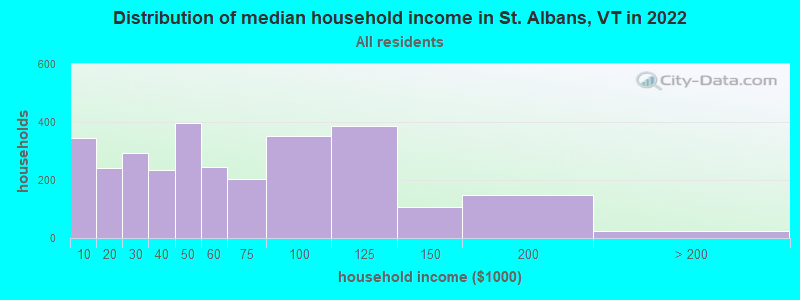
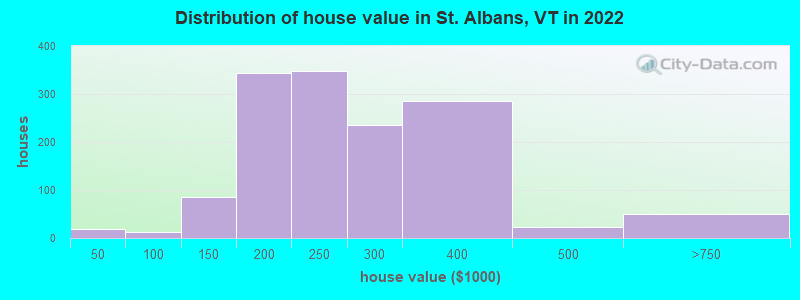
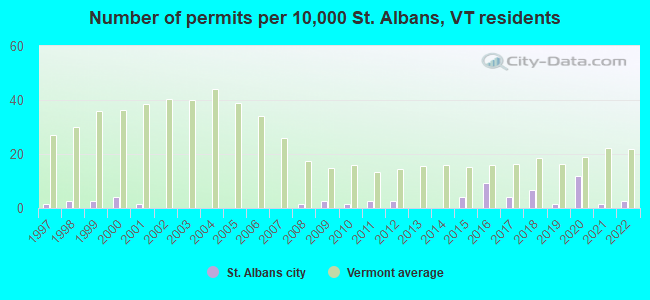
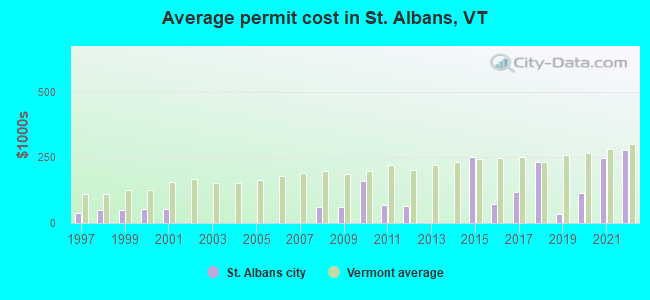
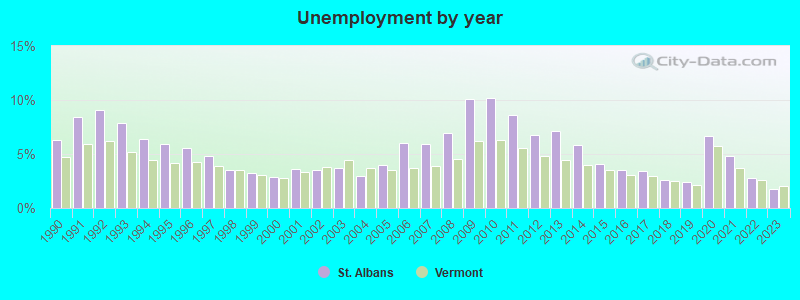
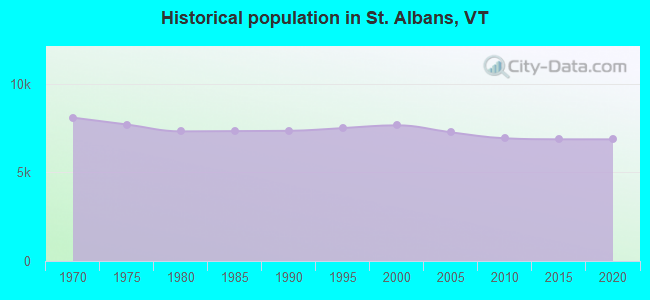
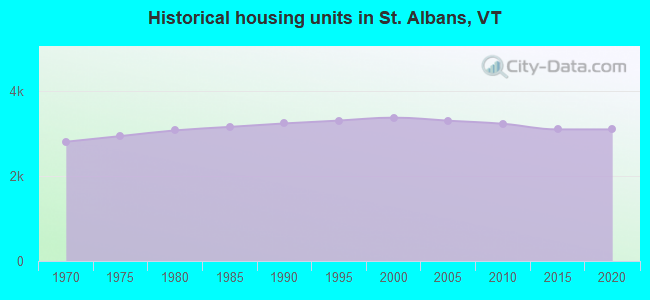
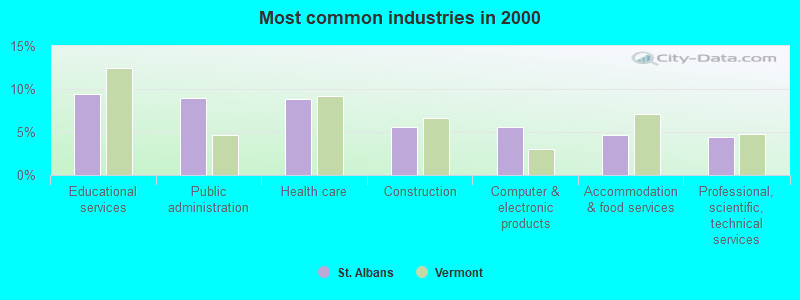
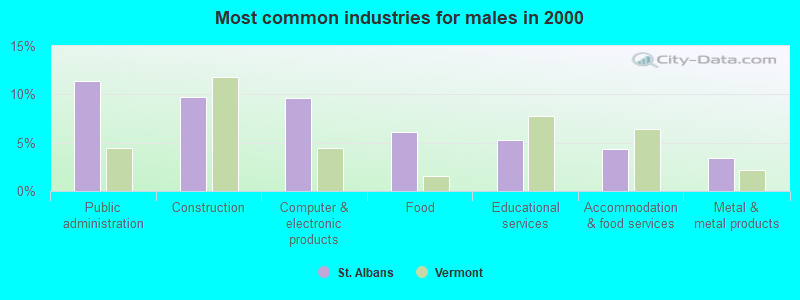
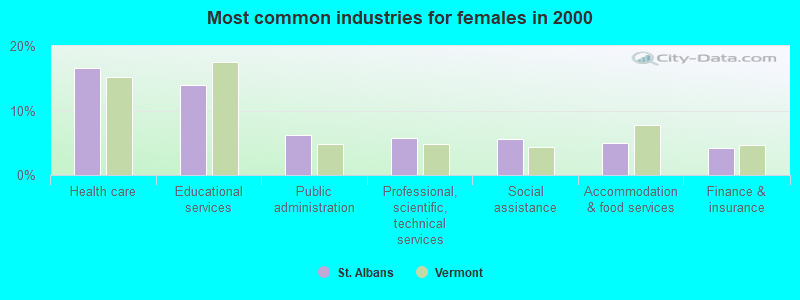
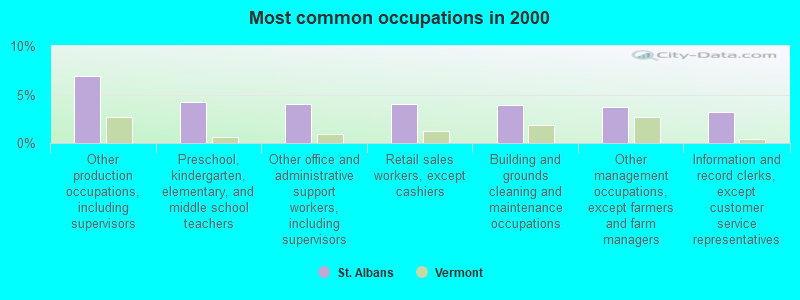
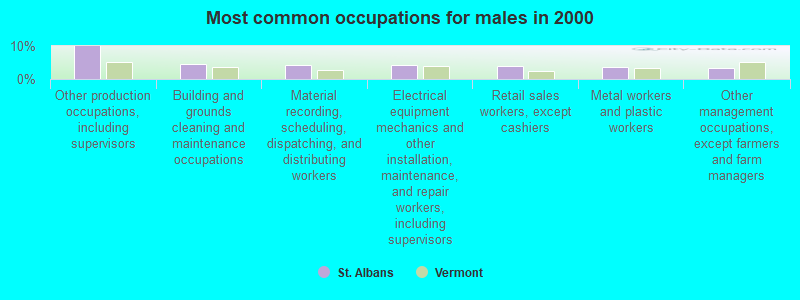
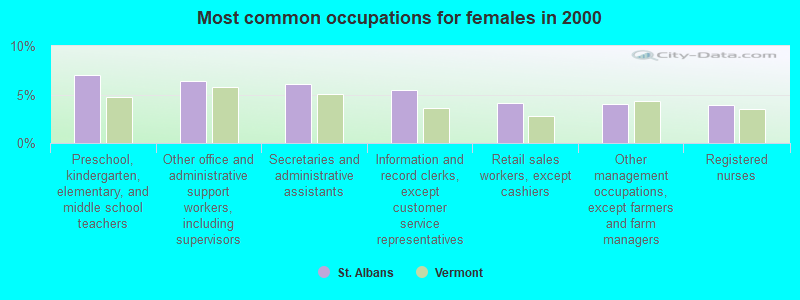
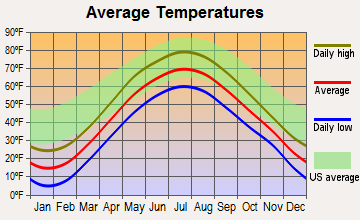
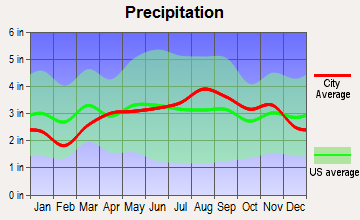
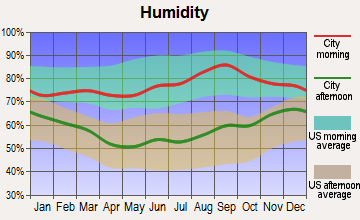
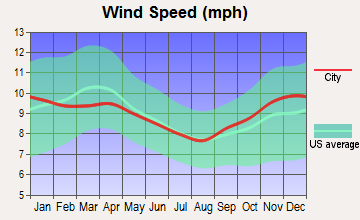
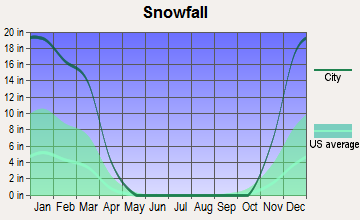
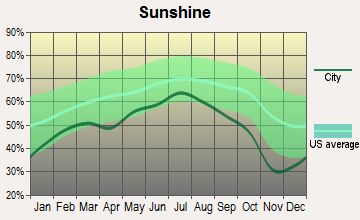
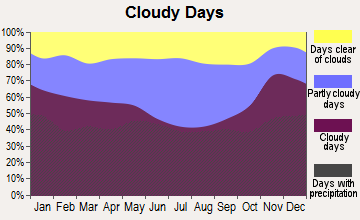


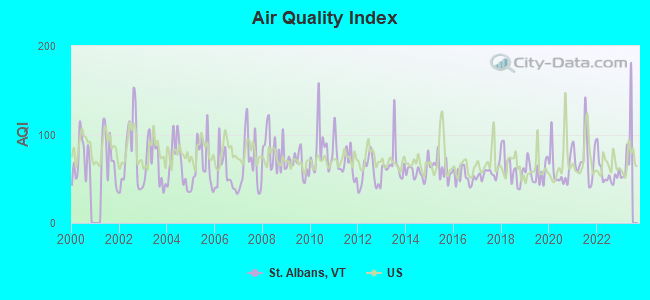
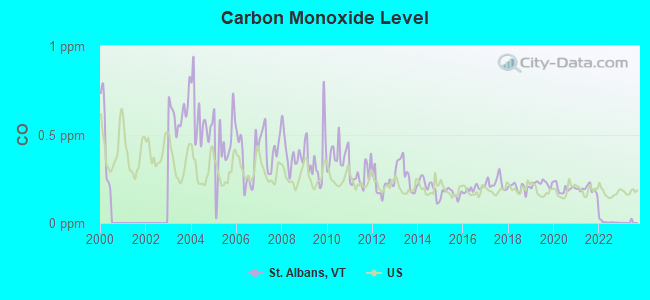
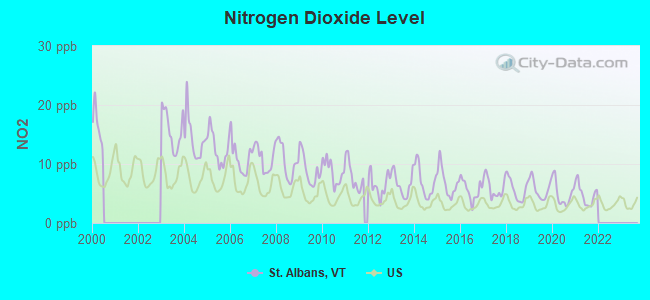
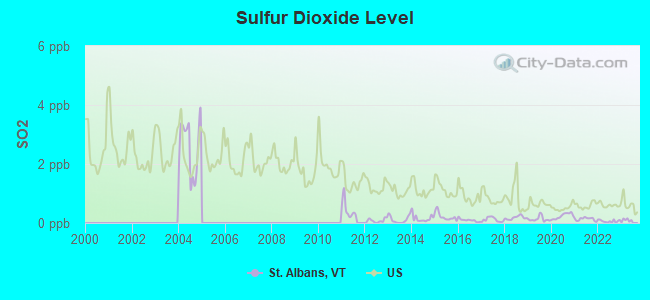

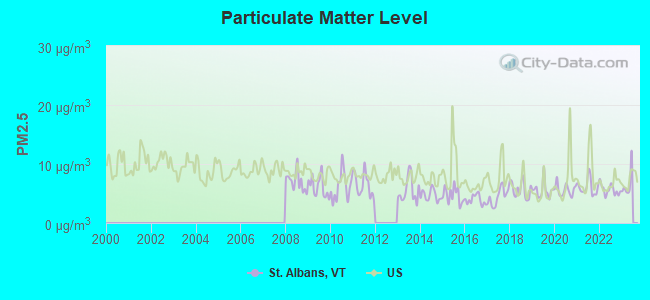
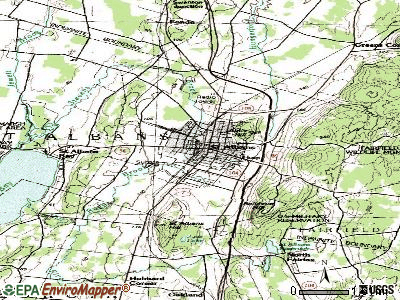
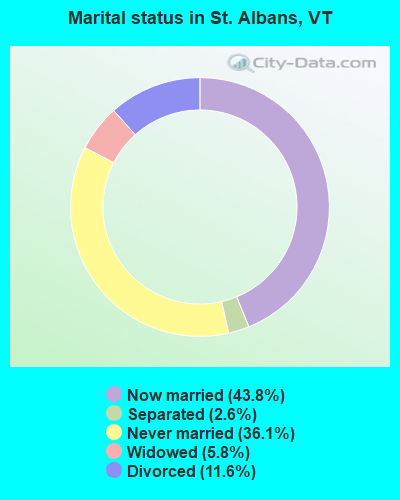
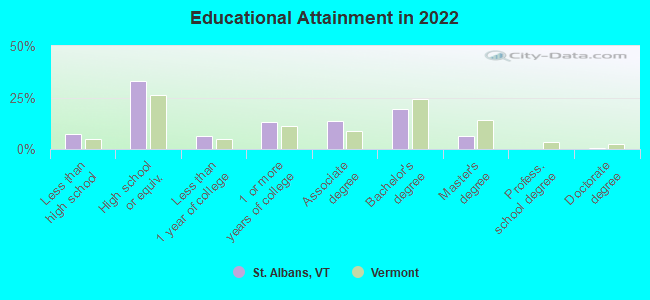
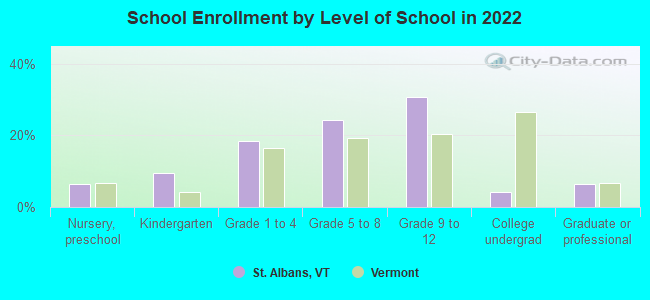
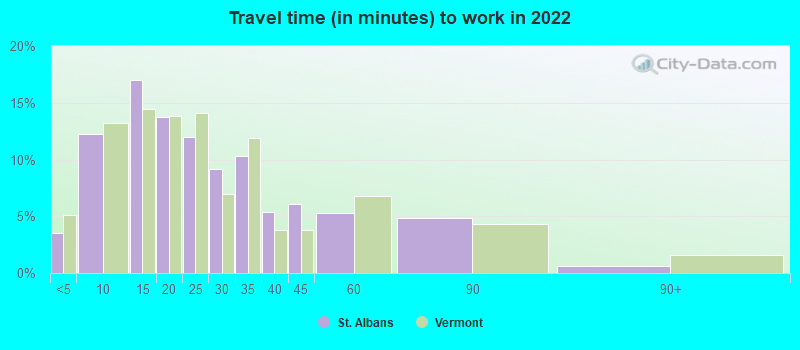
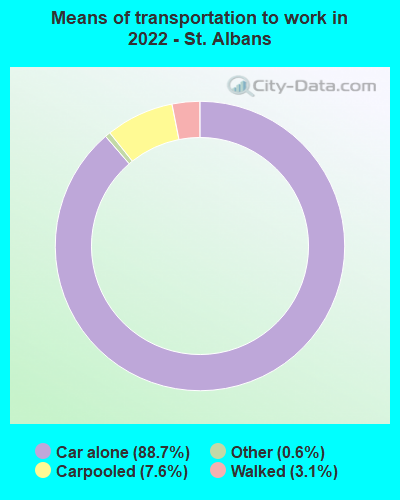
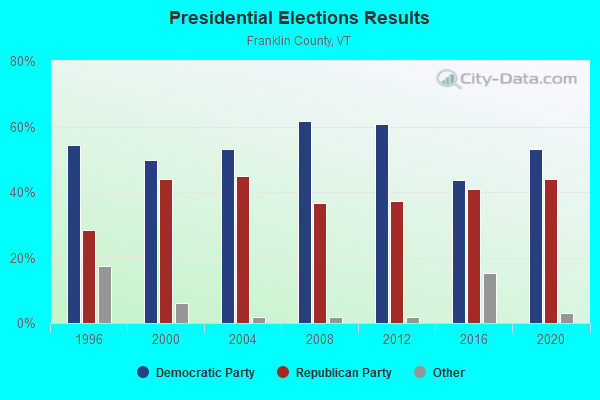
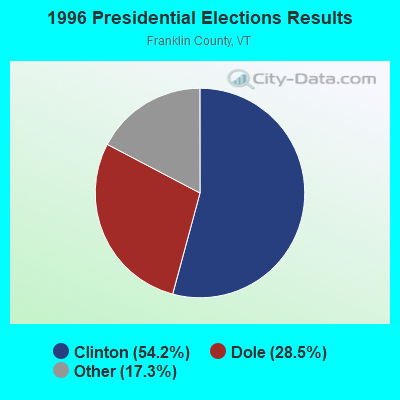
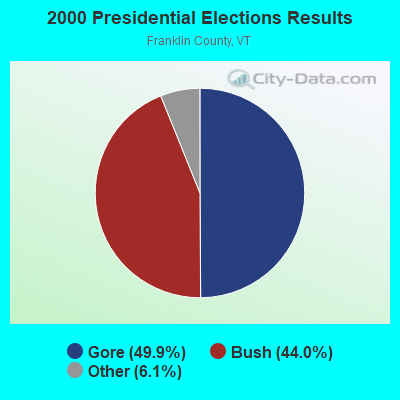
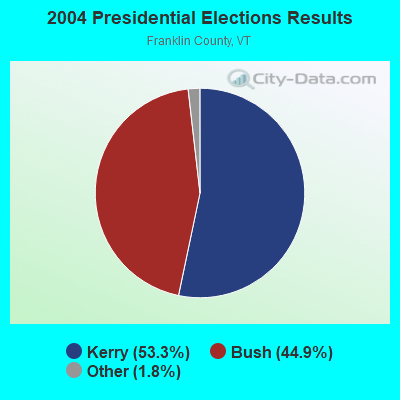
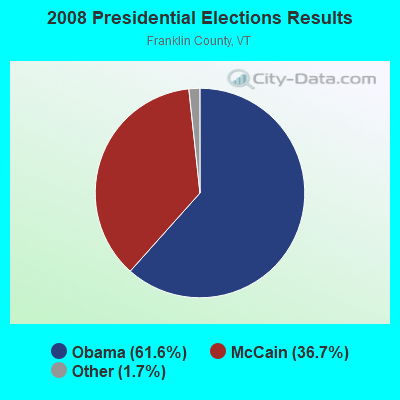
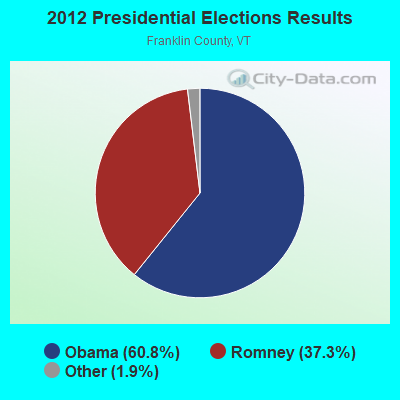
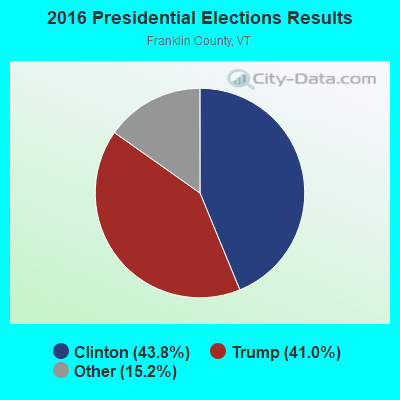
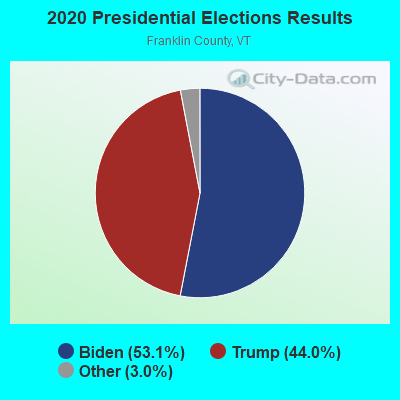
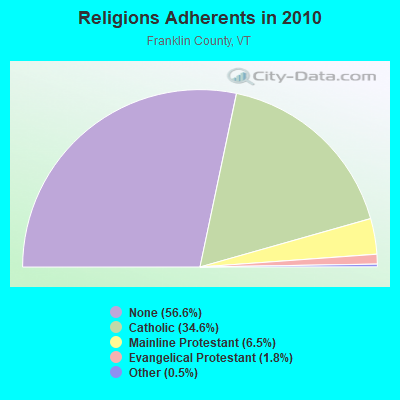
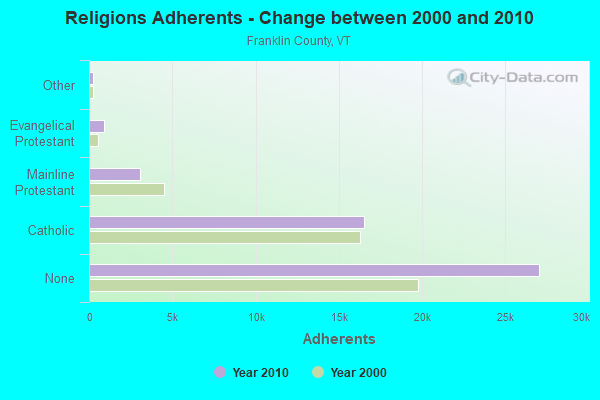
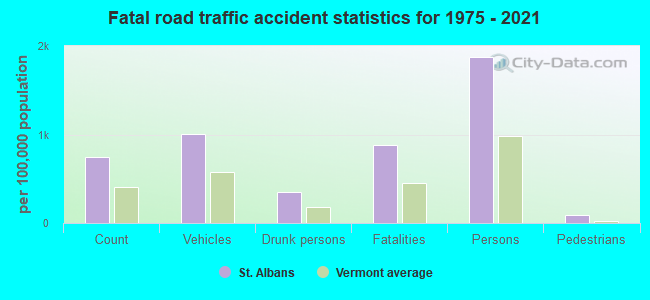
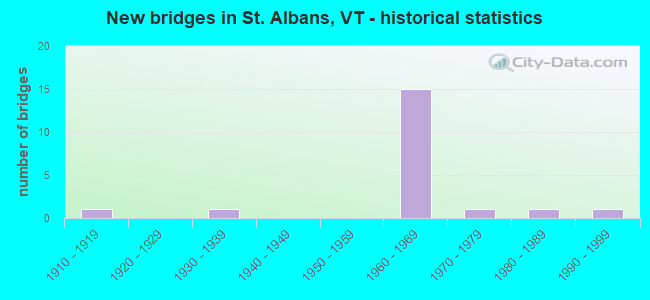
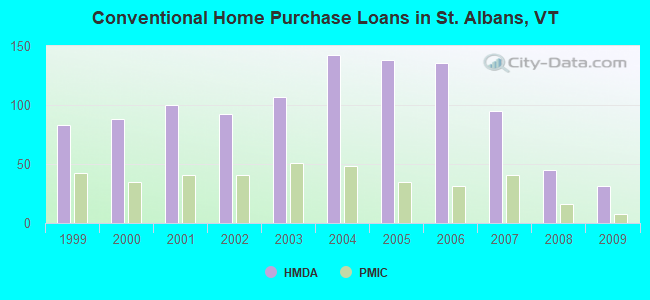
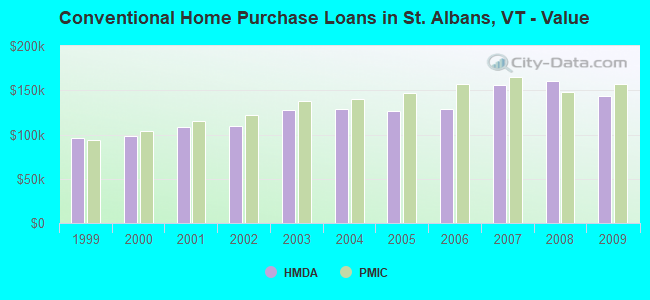
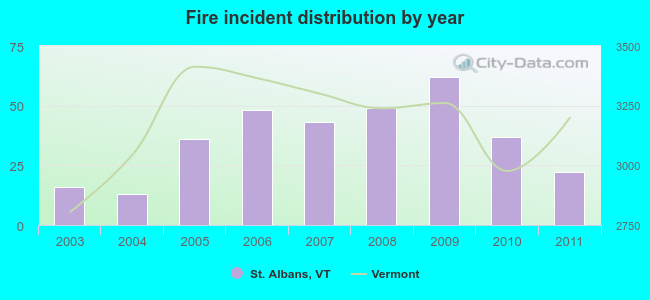 According to the data from the years 2003 - 2011 the average number of fire incidents per year is 36. The highest number of reported fires - 62 took place in 2009, and the least - 13 in 2004. The data has a growing trend.
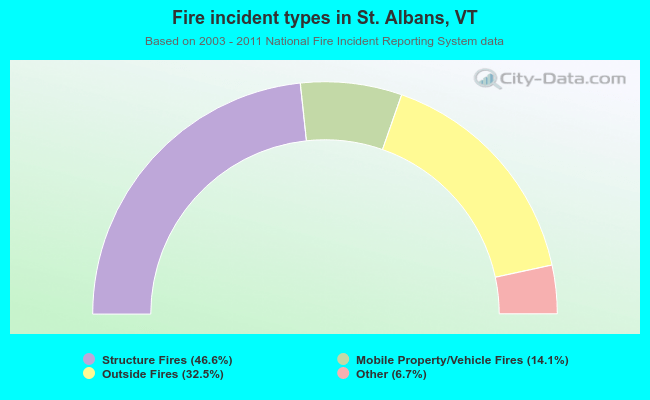 When looking into fire subcategories, the most incidents belonged to: Structure Fires (46.6%), and Outside Fires (32.5%).