Somervell County, Texas (TX)
County owner-occupied free and clear houses and condos in 2010: 1,063
County owner-occupied houses and condos in 2000: 1,821
Renter-occupied apartments: 722 (it was 617 in 2000)
| % of renters here: | 25% |
| State: | 36% |
Land area: 187 sq. mi.
Water area: 4.7 sq. mi.
Population density: 51 people per square mile (average).
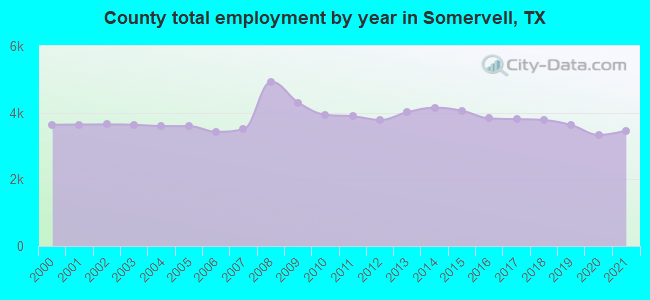
Industries providing employment: Educational, health and social services (19.0%), Transportation and warehousing,and utilities (14.9%), Construction (12.4%), Finance, insurance, real estate, and rental and leasing (10.5%).
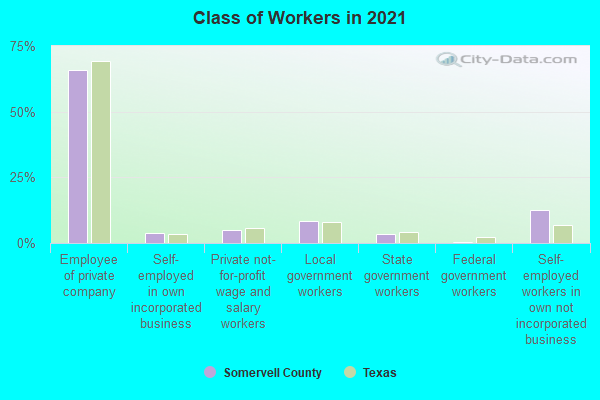
Type of workers:
- Private wage or salary: 75%
- Government: 13%
- Self-employed, not incorporated: 12%
- Unpaid family work: 0%
- OSM Map
- General Map
- Google Map
- MSN Map


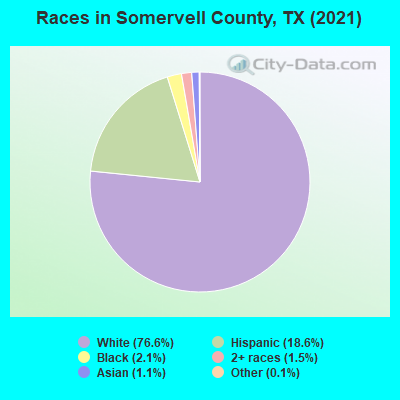
- 7,23976.9%White Non-Hispanic Alone
- 1,74018.5%Hispanic or Latino
- 1872.0%Two or more races
- 1852.0%Black Non-Hispanic Alone
- 540.6%Asian alone
- 80.08%Some other race alone
| Median resident age: | 43.6 years |
| Texas median age: | 35.6 years |
| Males: 4,696 | |
| Females: 4,892 |


| Somervell County: | 2.0 people |
| Texas: | 3 people |
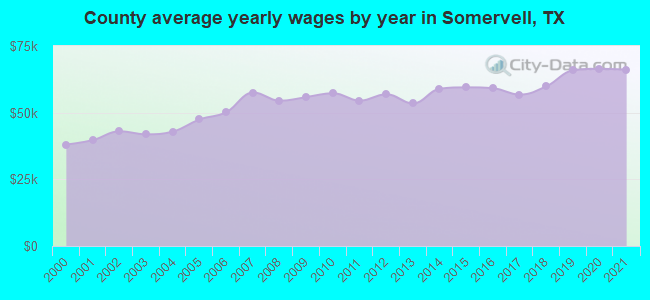
Estimated median household income in 2022: $86,995 ($39,404 in 1999)
| This county: | $86,995 |
| Texas: | $72,284 |
Median contract rent in 2022 for apartments: $697 (lower quartile is $356, upper quartile is $1,447)
| This county: | $697 |
| State: | $1117 |
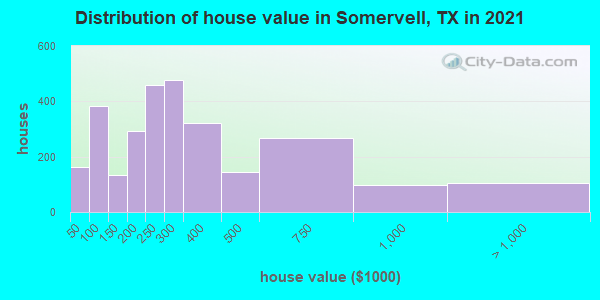
Estimated median house or condo value in 2022: $285,351 (it was $88,100 in 2000)
| Somervell: | $285,351 |
| Texas: | $275,400 |
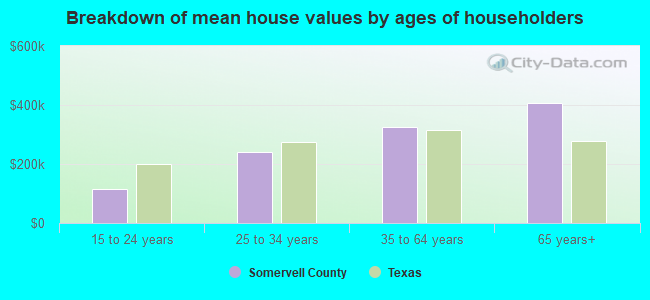
Mean price in 2022:
Median monthly housing costs for homes and condos with a mortgage: $1,769Detached houses: $441,055
Here: $441,055 State: $369,058 Mobile homes: $187,067
Here: $187,067 State: $124,413
Median monthly housing costs for units without a mortgage: $550
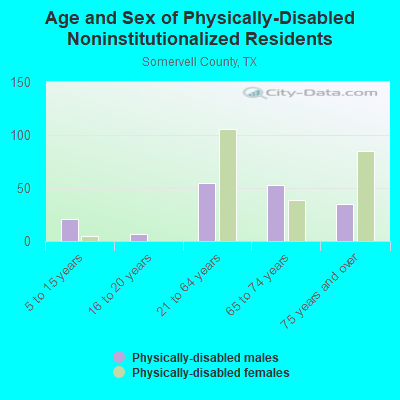
Institutionalized population: 157
Crime in 2021 (reported by the sheriff's office or county police, not the county total):
- Murders: 0
- Rapes: 0
- Robberies: 0
- Assaults: 4
- Burglaries: 26
- Thefts: 40
- Auto thefts: 0
Crime in 2020 (reported by the sheriff's office or county police, not the county total):
- Murders: 0
- Rapes: 10
- Robberies: 1
- Assaults: 4
- Burglaries: 34
- Thefts: 36
- Auto thefts: 0
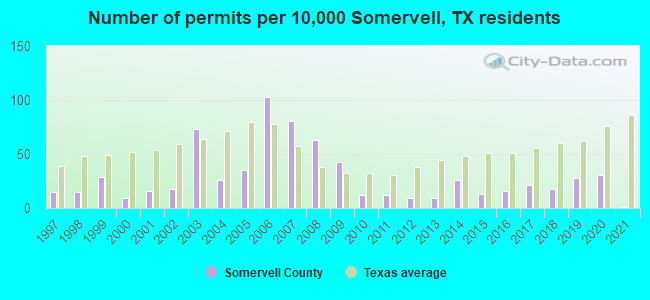
Single-family new house construction building permits:
- 2022: 15 buildings, average cost: $306,000
- 2021: 1 building, cost: $217,500
- 2020: 21 buildings, average cost: $206,300
- 2019: 19 buildings, average cost: $206,300
- 2018: 12 buildings, average cost: $195,000
- 2017: 14 buildings, average cost: $209,300
- 2016: 11 buildings, average cost: $210,200
- 2015: 9 buildings, average cost: $210,400
- 2014: 18 buildings, average cost: $171,200
- 2013: 6 buildings, average cost: $172,500
- 2012: 6 buildings, average cost: $210,000
- 2011: 8 buildings, average cost: $175,600
- 2010: 8 buildings, average cost: $175,600
- 2009: 29 buildings, average cost: $177,500
- 2008: 43 buildings, average cost: $177,500
- 2007: 55 buildings, average cost: $170,500
- 2006: 70 buildings, average cost: $159,000
- 2005: 24 buildings, average cost: $148,500
- 2004: 18 buildings, average cost: $131,000
- 2003: 50 buildings, average cost: $129,800
- 2002: 12 buildings, average cost: $81,800
- 2001: 11 buildings, average cost: $81,800
- 2000: 6 buildings, average cost: $80,000
- 1999: 20 buildings, average cost: $89,800
- 1998: 10 buildings, average cost: $100,200
- 1997: 10 buildings, average cost: $108,200

Median real estate property taxes paid for housing units with mortgages in 2022: $3,038 (1.0%)
Median real estate property taxes paid for housing units with no mortgage in 2022: $2,225 (0.9%)


| Somervell County: | 7.3% |
| Texas: | 14.0% |
Median age of residents in 2022: 43.6 years old
(Males: 43.1 years old, Females: 43.9 years old)
(Median age for: White residents: 45.5 years old, Black residents: 20.7 years old, American Indian residents: 38.1 years old, Hispanic or Latino residents: 38.0 years old, Other race residents: 27.5 years old)
Fair market rent in 2006 for a 1-bedroom apartment in Somervell County is $420 a month.
Fair market rent for a 2-bedroom apartment is $497 a month.
Fair market rent for a 3-bedroom apartment is $635 a month.
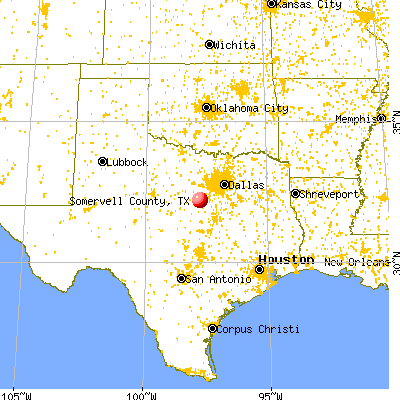
Cities in this county include: Glen Rose.
Neighboring counties: Bleckley County, Georgia  , Ellis County , Lee County, Georgia , McIntosh County, Georgia , Quitman County, Georgia , Sumter County, Georgia , Upson County, Georgia .
| Here: | 2.9% |
| Texas: | 3.5% |

Current college students: 263
People 25 years of age or older with a high school degree or higher: 92.9%
People 25 years of age or older with a bachelor's degree or higher: 28.6%
Number of foreign born residents: 803 (24.7% naturalized citizens)
| Somervell County: | 8.4% |
| Whole state: | 17.2% |
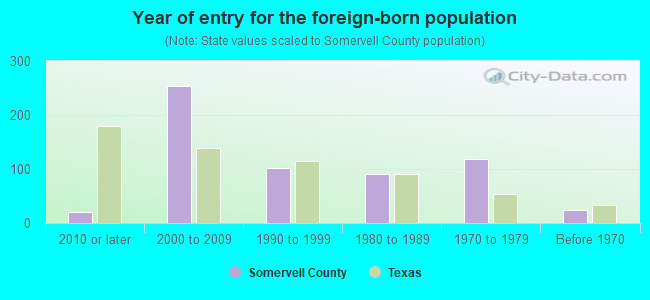
- Year of entry for the foreign-born population
- 2132010 or later
- 2612000 to 2009
- 2531990 to 1999
- 911980 to 1989
- 1191970 to 1979
- 25Before 1970
Mean travel time to work (commute): minutes
Percentage of county residents living and working in this county: 100.1%
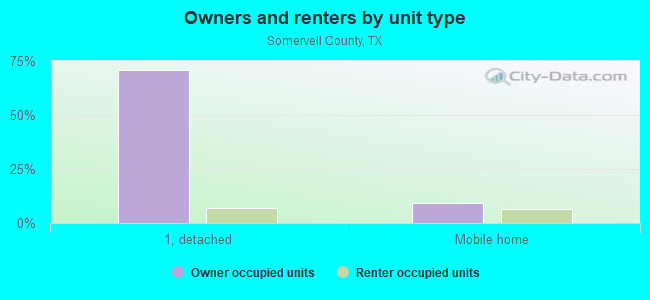
Housing units in structures:
- One, detached: 2,905
- 3 or 4: 31
- 5 to 9: 146
- 10 to 19: 20
- 20 to 49: 4
- 50 or more: 12
- Mobile homes: 914
Housing units in Somervell County with a mortgage: 1,455 (10 second mortgage, 0 home equity loan, 11 both second mortgage and home equity loan)
Houses without a mortgage: 0
| Here: | 100.0% with mortgage |
| State: | 98.4% with mortgage |
Religion statistics for Somervell County
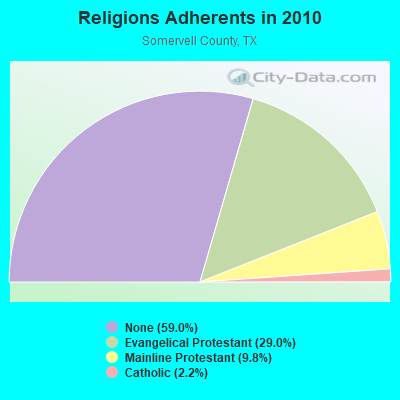
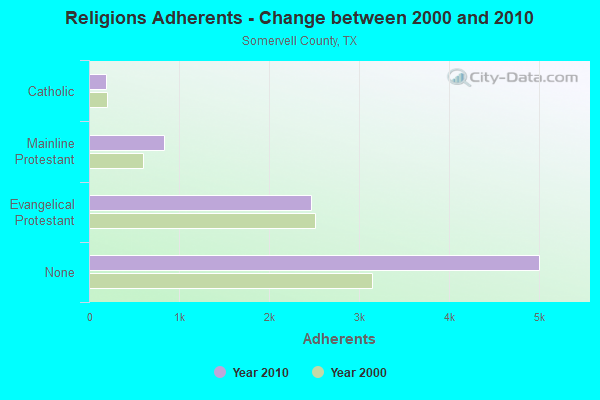
| Religion | Adherents | Congregations |
|---|---|---|
| Evangelical Protestant | 2,463 | 17 |
| Mainline Protestant | 833 | 1 |
| Catholic | 185 | 1 |
| Other | 1 | - |
| None | 5,008 | - |
Source: Clifford Grammich, Kirk Hadaway, Richard Houseal, Dale E.Jones, Alexei Krindatch, Richie Stanley and Richard H.Taylor. 2012. 2010 U.S.Religion Census: Religious Congregations & Membership Study. Association of Statisticians of American Religious Bodies. Jones, Dale E., et al. 2002. Congregations and Membership in the United States 2000. Nashville, TN: Glenmary Research Center.
Food Environment Statistics:
| Somervell County: | 3.88 / 10,000 pop. |
| State: | 1.47 / 10,000 pop. |
| This county: | 1.29 / 10,000 pop. |
| Texas: | 1.11 / 10,000 pop. |
| Somervell County: | 11.63 / 10,000 pop. |
| Texas: | 3.95 / 10,000 pop. |
| This county: | 7.75 / 10,000 pop. |
| State: | 6.13 / 10,000 pop. |
| Somervell County: | 9.5% |
| Texas: | 8.9% |
| Somervell County: | 26.5% |
| State: | 26.6% |
| Here: | 15.4% |
| State: | 15.7% |
Agriculture in Somervell County:
Average size of farms: 249 acresAverage value of agricultural products sold per farm: $5,975
Average value of crops sold per acre for harvested cropland: $77.04
The value of livestock, poultry, and their products as a percentage of the total market value of agricultural products sold: 74.38%
Average total farm production expenses per farm: $9,463
Harvested cropland as a percentage of land in farms: 7.99%
Irrigated harvested cropland as a percentage of land in farms: 0.73%
Average market value of all machinery and equipment per farm: $15,661
The percentage of farms operated by a family or individual: 93.22%
Average age of principal farm operators: 56 years
Average number of cattle and calves per 100 acres of all land in farms: 8.16
Milk cows as a percentage of all cattle and calves: 0.17%
Vegetables: 14 harvested acres
Land in orchards: 664 acres
Earthquake activity:
Somervell County-area historical earthquake activity is significantly above Texas state average. It is 404% greater than the overall U.S. average.On 11/6/2011 at 03:53:10, a magnitude 5.7 (5.7 MW, Depth: 3.2 mi, Class: Moderate, Intensity: VI - VII) earthquake occurred 234.2 miles away from Somervell County center
On 6/16/1978 at 11:46:54, a magnitude 5.3 (4.4 MB, 4.6 UK, 5.3 ML) earthquake occurred 183.7 miles away from the county center
On 9/3/2016 at 12:02:44, a magnitude 5.8 (5.8 MW, Depth: 3.5 mi) earthquake occurred 292.8 miles away from the county center
On 4/14/1995 at 00:32:56, a magnitude 5.7 (5.6 MB, 5.7 MS, 5.7 MW, Depth: 11.1 mi) earthquake occurred 358.7 miles away from the county center
On 5/17/2012 at 08:12:00, a magnitude 4.8 (4.8 MW, Depth: 3.1 mi, Class: Light, Intensity: IV - V) earthquake occurred 199.5 miles away from Somervell County center
On 5/7/2015 at 22:58:05, a magnitude 4.0 (4.0 MW, Depth: 1.6 mi) earthquake occurred 41.4 miles away from the county center
Magnitude types: body-wave magnitude (MB), local magnitude (ML), surface-wave magnitude (MS), moment magnitude (MW)
Most recent natural disasters:
- Texas Covid-19 Pandemic, Incident Period: January 20, 2020, FEMA Id: 4485, Natural disaster type: Other
- Texas Severe Storms and Flooding, Incident Period: May 22, 2016 to June 24, 2016, Major Disaster (Presidential) Declared DR-4272: June 11, 2016, FEMA Id: 4272, Natural disaster type: Storm, Flood
- Texas Severe Storms, Tornadoes, Straight-line Winds, and Flooding, Incident Period: May 04, 2015 to June 23, 2015, Major Disaster (Presidential) Declared DR-4223: May 29, 2015, FEMA Id: 4223, Natural disaster type: Storm, Tornado, Flood, Wind
- Texas Big Trickle Ranch Fire, Incident Period: March 11, 2011 to March 17, 2011, Fire Management Assistance Declared: March 12, 2011, FEMA Id: 2870, Natural disaster type: Fire
- Texas Wildfires, Incident Period: March 14, 2008 to September 01, 2008, Emergency Declared EM-3284: March 14, 2008, FEMA Id: 3284, Natural disaster type: Fire
- Texas Hurricane Rita, Incident Period: September 23, 2005 to October 14, 2005, Major Disaster (Presidential) Declared DR-1606: September 24, 2005, FEMA Id: 1606, Natural disaster type: Hurricane
- Texas Hurricane Rita, Incident Period: September 20, 2005 to October 14, 2005, Emergency Declared EM-3261: September 21, 2005, FEMA Id: 3261, Natural disaster type: Hurricane
- Texas Hurricane Katrina, Incident Period: August 29, 2005 to October 01, 2005, Emergency Declared EM-3216: September 02, 2005, FEMA Id: 3216, Natural disaster type: Hurricane
- Texas Loss of the Space Shuttle Columbia, Incident Period: February 01, 2003, Emergency Declared EM-3171: February 01, 2003, FEMA Id: 3171, Natural disaster type: Other
- Texas Extreme Fire Hazards, Incident Period: August 01, 1999 to December 10, 1999, Emergency Declared EM-3142: September 01, 1999, FEMA Id: 3142, Natural disaster type: Fire
- 4 other natural disasters have been reported since 1953.
The number of natural disasters in Somervell County (14) is near the US average (15).
Major Disasters (Presidential) Declared: 6
Emergencies Declared: 6
Causes of natural disasters: Storms: 5, Fires: 4, Floods: 4, Hurricanes: 3, Tornadoes: 3, Wind: 1, Other: 2 (Note: some incidents may be assigned to more than one category).
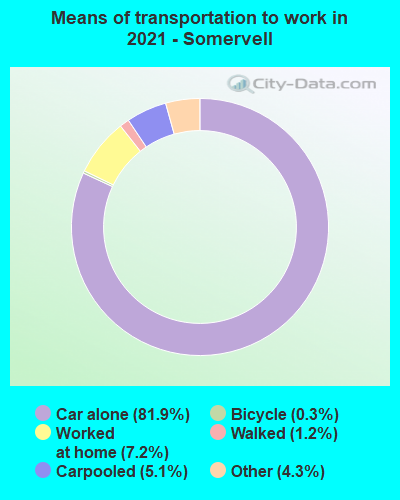
Means of transportation to work:
- Drove a car alone: 4,238 (76.3%)
- Carpooled: 295 (5.3%)
- Taxicab, motorcycle, or other means: 290 (5.2%)
- Walked: 92 (1.7%)
- Worked at home: 601 (10.8%)

- Health care and social assistance (17%)
- Finance and insurance (14%)
- Educational services (11%)
- Transportation and warehousing (7%)
- Accommodation and food services (6%)
- Other services, except public administration (4%)
- Construction (4%)
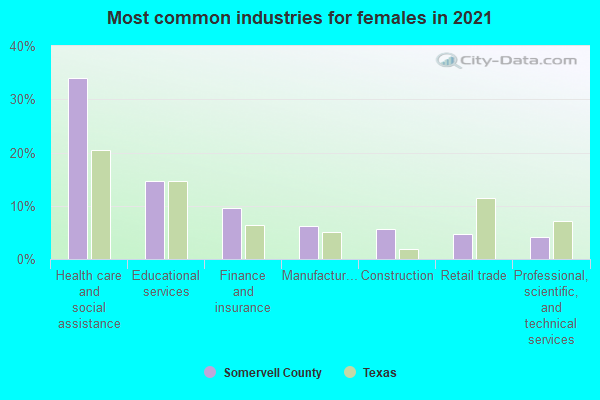
- Health care and social assistance (23%)
- Finance and insurance (19%)
- Educational services (14%)
- Transportation and warehousing (9%)
- Accommodation and food services (7%)
- Other services, except public administration (5%)
- Construction (5%)
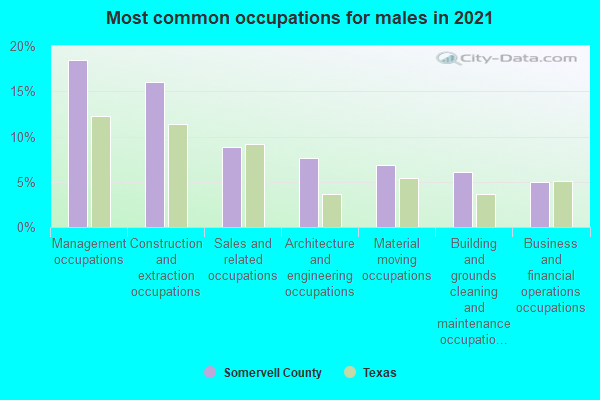
- Construction and extraction occupations (17%)
- Management occupations (14%)
- Architecture and engineering occupations (10%)
- Sales and related occupations (9%)
- Production occupations (6%)
- Transportation occupations (6%)
- Business and financial operations occupations (4%)
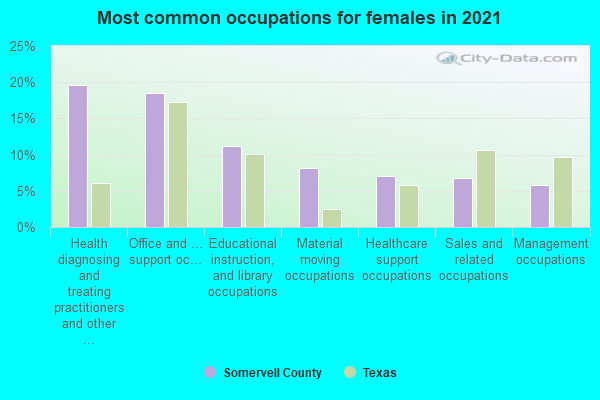
- Office and administrative support occupations (29%)
- Health diagnosing and treating practitioners and other technical occupations (11%)
- Educational instruction, and library occupations (9%)
- Transportation occupations (7%)
- Sales and related occupations (7%)
- Food preparation and serving related occupations (7%)
- Management occupations (6%)
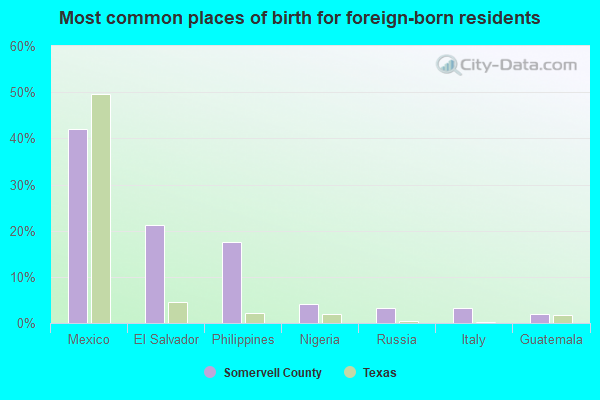
- Mexico (54%)
- El Salvador (13%)
- Serbia (7%)
- Philippines (6%)
- Other Eastern Africa (6%)
- Ukraine (3%)
- Russia (3%)
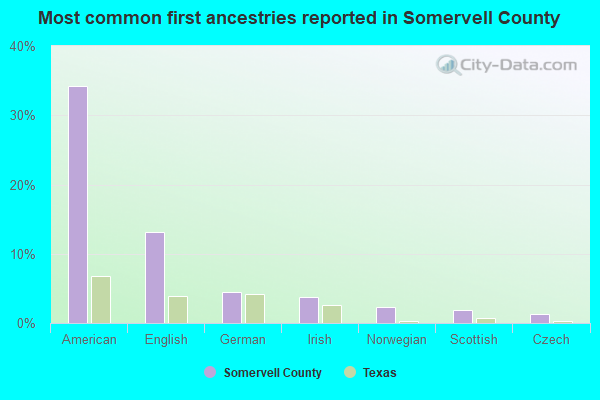
- American (25%)
- English (24%)
- German (5%)
- Irish (3%)
- Scottish (2%)
- European (1%)
- Polish (1%)
People in group quarters in Somervell County, Texas in 2010:
- 152 people in nursing facilities/skilled-nursing facilities
- 130 people in workers' group living quarters and job corps centers
- 5 people in group homes for juveniles (non-correctional)
People in group quarters in Somervell County, Texas in 2000:
- 81 people in orthopedic wards and institutions for the physically handicapped
- 55 people in nursing homes
- 15 people in local jails and other confinement facilities (including police lockups)
- 6 people in homes for the mentally retarded
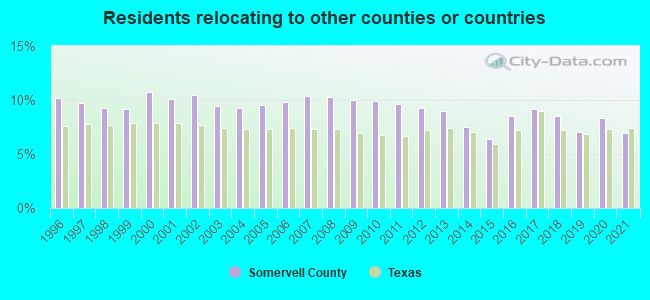
11.36% of this county's 2021 resident taxpayers lived in other counties in 2020 ($91,840 average adjusted gross income)
| Here: | 11.36% |
| Texas average: | 8.12% |
10 or fewer of this county's residents moved from foreign countries.
9.60% relocated from other counties in Texas ($79,814 average AGI)
1.76% relocated from other states ($12,026 average AGI)
Somervell County: 1.76% Texas average: 2.83%

Top counties from which taxpayers relocated into this county between 2020 and 2021:
| from Tarrant County, TX | |
| from Hood County, TX | |
| from Johnson County, TX |
6.96% of this county's 2020 resident taxpayers moved to other counties in 2021 ($54,673 average adjusted gross income)
| Here: | 6.96% |
| Texas average: | 7.40% |
10 or fewer of this county's residents moved to foreign countries.
6.96% relocated to other counties in Texas ($54,673 average AGI)
10 or fewer of this county's residents relocated to other states.
Top counties to which taxpayers relocated from this county between 2020 and 2021:
| to Hood County, TX | |
| to Johnson County, TX | |
| to Tarrant County, TX |
Births per 1000 population from 1990 to 1999: 13.4
Births per 1000 population from 2000 to 2006: 12.8

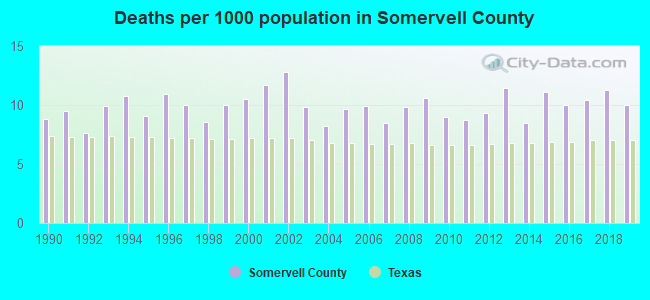
Deaths per 1000 population from 1990 to 1999: 9.5
Deaths per 1000 population from 2000 to 2009: 10.2
Deaths per 1000 population from 2010 to 2020: 10.2
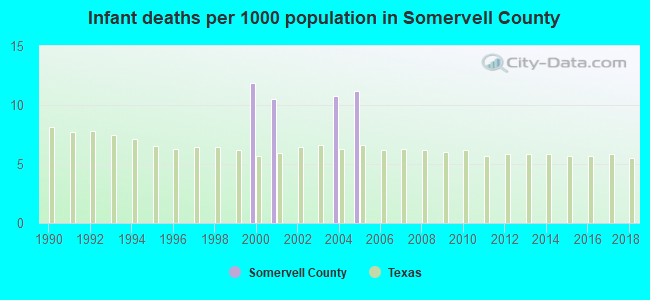
Infant deaths per 1000 live births from 2000 to 2006: 6.3
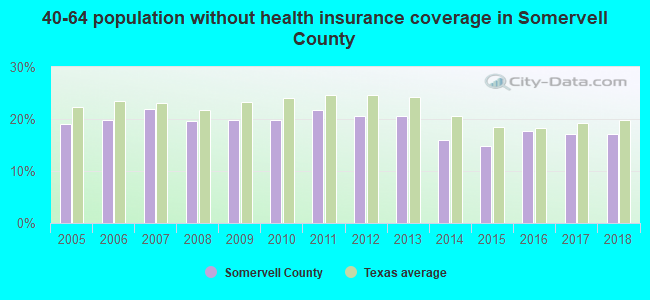
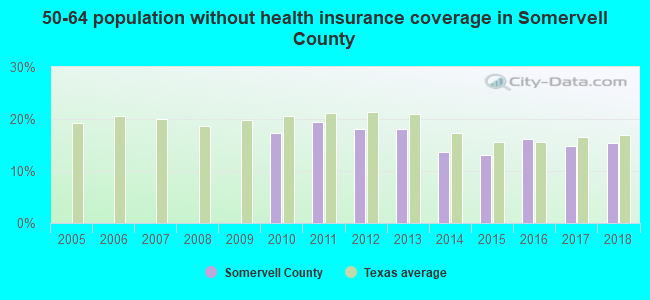
Persons under 19 years old without health insurance coverage in 2018: 12.9%


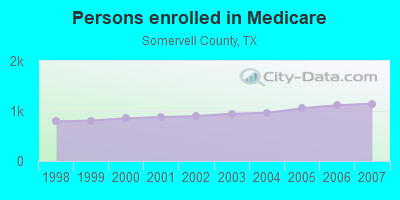
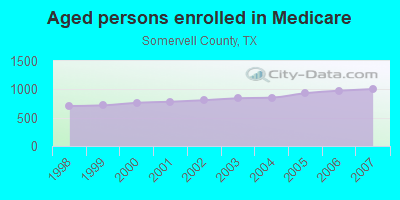
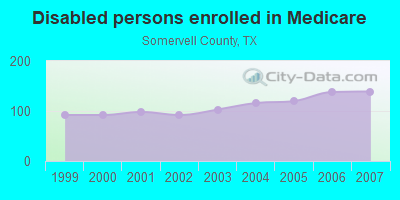
Persons enrolled in hospital insurance and/or supplemental medical insurance (Medicare) in July 1, 2007: 1,144 (1,005 aged, 139 disabled)
Children under 18 without health insurance coverage in 2007: 464 (24%)
Most common underlying causes of death in Somervell County, Texas in 1999 - 2019:
- Alzheimer disease, unspecified (10)
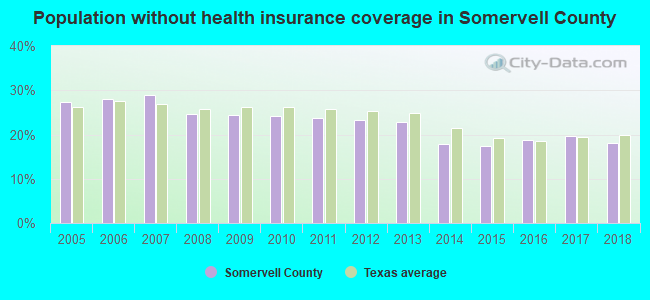
Population without health insurance coverage in 2000: 17%
Children under 18 without health insurance coverage in 2000: 17%
Short term general hospital admissions per 100,000 population in 2004: 10,331
Short term general hospital beds per 100,000 population in 2004: 215
Emergency room visits per 100,000 population in 2004: 86,006
General practice office based MDs per 100,000 population in 2005: 1,148
Medical specialist MDs per 100,000 population in 2005: 858
Total births per 100,000 population, July 2005 - July 2006 : 16
Total deaths per 100,000 population, July 2005 - July 2006: 145
Limited-service eating places per 100,000 population in 2005 : 13
Household type by relationship:
Households: 9,588- Male householders: 2,114 (250 living alone), Female householders: 1,415 (440 living alone)
2,278 spouses (2,278 opposite-sex spouses), 75 unmarried partners, (47 opposite-sex unmarried partners), 2,488 children (2,014 natural, 160 adopted, 316 stepchildren), 277 grandchildren, 20 brothers or sisters, 48 parents, 0 foster children, 241 other relatives, 233 non-relatives
- In group quarters: 392
Size of family households: 1,378 2-persons, 611 3-persons, 385 4-persons, 229 5-persons, 81 6-persons, 88 7-or-more-persons.
Size of nonfamily households: 690 1-person, 67 2-persons.
1,354 married couples with children.
440 single-parent households (311 men, 129 women).
82.3% of residents of Somervell speak English at home.
15.3% of residents speak Spanish at home (61% speak English very well, 29% speak English well, 6% speak English not well, 4% don't speak English at all).
1.9% of residents speak other Indo-European language at home (48% speak English very well, 52% speak English well).
0.6% of residents speak Asian or Pacific Island language at home (100% speak English very well).
0.2% of residents speak other language at home (100% speak English very well).
In fiscal year 2004:
Federal Government expenditure: $28,216,000 ($3,786 per capita)
Department of Defense expenditure: $809,000
Federal direct payments to individuals for retirement and disability: $15,041,000
Federal other direct payments to individuals: $7,361,000
Federal direct payments not to individuals: $41,000
Federal grants: $4,418,000
Federal procurement contracts: $241,000 ($0,000 Department of Defense)
Federal salaries and wages: $1,114,000 ($0,000 Department of Defense)
Federal Government direct loans: $0,000
Federal guaranteed/insured loans: $1,761,000
Federal Government insurance: $7,685,000
Population change from April 1, 2000 to July 1, 2005:
Births: 477| Here: | 63 per 1000 residents |
| State: | 85 per 1000 residents |
Deaths: 398
| Here: | 53 per 1000 residents |
| State: | 35 per 1000 residents |
Net international migration: +59
| Here: | +8 per 1000 residents |
| State: | +29 per 1000 residents |
Net internal migration: +652
| Here: | +86 per 1000 residents |
| State: | +10 per 1000 residents |
Total withdrawal of fresh water for public supply: 0.45 millions of gallons per day (all from ground)
| Here: | 6.0 |
| State: | 6.3 |
| Here: | 4.7 |
| State: | 4.0 |
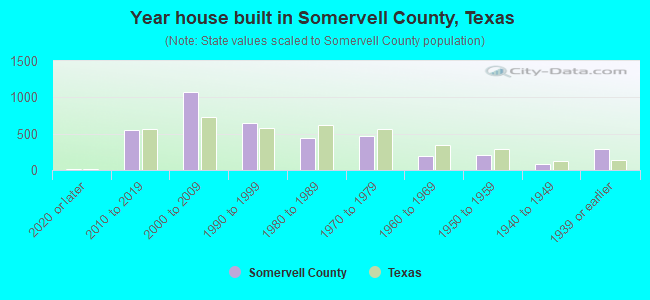
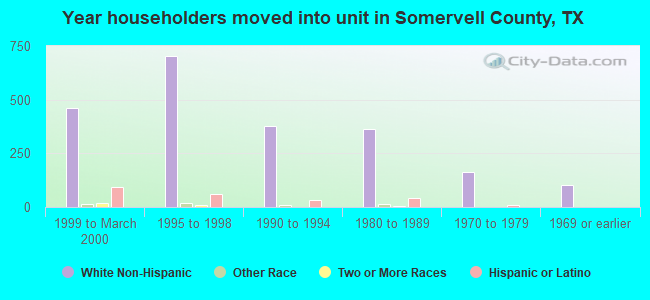
- Year house built in Somervell County, Texas
- 552020 or later
- 5582010 to 2019
- 9772000 to 2009
- 7871990 to 1999
- 4551980 to 1989
- 3691970 to 1979
- 1771960 to 1969
- 2061950 to 1959
- 761940 to 1949
- 2971939 or earlier
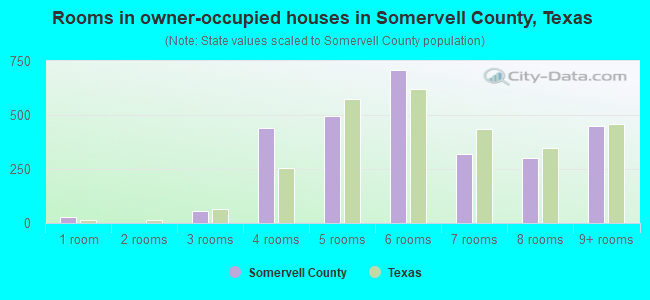
- Rooms in owner-occupied houses in Somervell County, Texas
- 251 room
- 02 rooms
- 383 rooms
- 5134 rooms
- 4945 rooms
- 8486 rooms
- 2877 rooms
- 3868 rooms
- 3239+ rooms
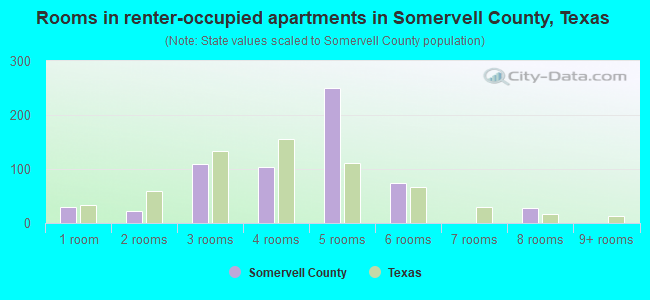
- Rooms in renter-occupied apartments in Somervell County, Texas
- 261 room
- 402 rooms
- 1713 rooms
- 474 rooms
- 1075 rooms
- 1126 rooms
- 867 rooms
- 368 rooms
- 09+ rooms
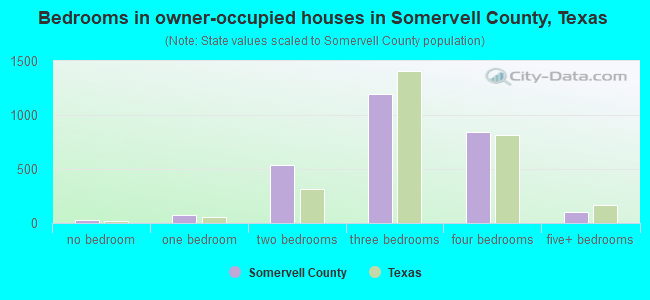
- Bedrooms in owner-occupied houses in Somervell County, Texas
- 28no bedroom
- 781 bedroom
- 4722 bedrooms
- 1,4843 bedrooms
- 8004 bedrooms
- 395+ bedrooms

- Bedrooms in renter-occupied apartments in Somervell County, Texas
- 26no bedroom
- 401 bedroom
- 3032 bedrooms
- 2283 bedrooms
- 264 bedrooms
- 05+ bedrooms
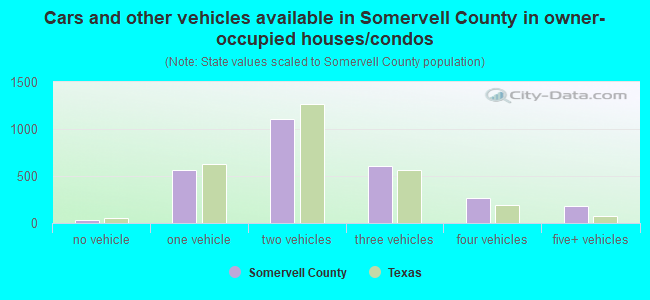
- Cars and other vehicles available in Somervell County in owner-occupied houses/condos
- 62no vehicle
- 4501 vehicle
- 1,2402 vehicles
- 7203 vehicles
- 2564 vehicles
- 1735+ vehicles
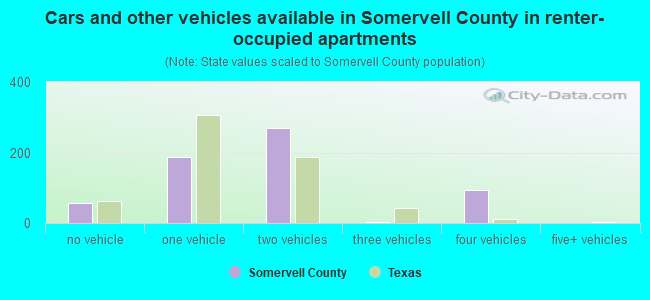
- Cars and other vehicles available in Somervell County in renter-occupied apartments
- 44no vehicle
- 2461 vehicle
- 2472 vehicles
- 33 vehicles
- 874 vehicles
- 05+ vehicles
84.6% of Somervell County residents lived in the same house 1 years ago.
Out of people who lived in different houses, 21% lived in this county.
Out of people who lived in different counties, 96% lived in Texas.
| Somervell County: | 84.6% |
| State average: | 85.7% |
Place of birth for U.S.-born residents:
- This state: 6,319
- Other state: 2,374
- Northeast: 106
- Midwest: 845
- South: 675
- West: 752
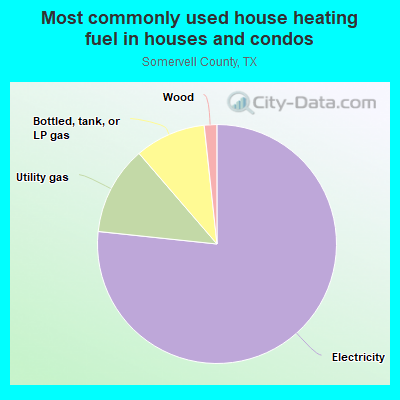
- 78.2%Electricity
- 10.1%Utility gas
- 10.1%Bottled, tank, or LP gas
- 1.6%Wood
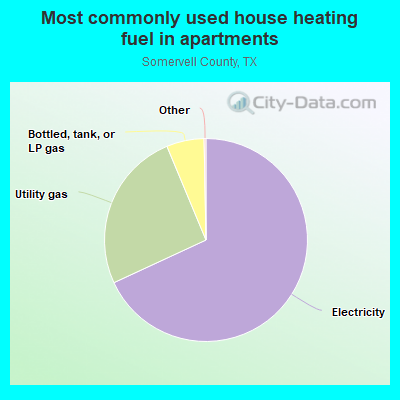
- 81.5%Electricity
- 17.1%Utility gas
- 1.3%Bottled, tank, or LP gas
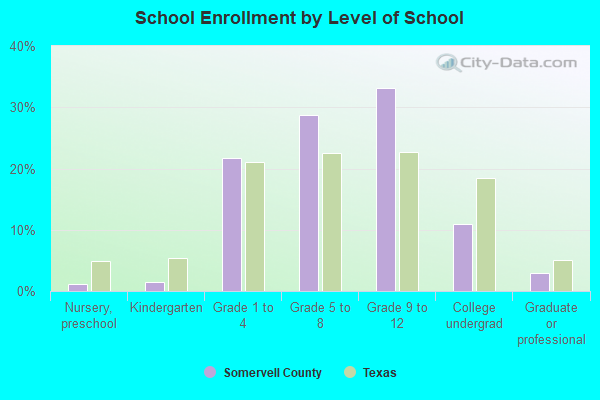
Private vs. public school enrollment:
| Here: | 22.8% |
| Texas: | 8.8% |
| Here: | 31.2% |
| Texas: | 8.0% |
| Here: | 0.0% |
| Texas: | 16.2% |


Somervell County government finances - Expenditure in 2018:
- Charges - Hospital Public: $18,244,000
Parks and Recreation: $2,392,000
Other: $445,000
Regular Highways: $86,000
Solid Waste Management: $2,000
- Current Operations - Hospitals: $19,713,000
Parks and Recreation: $3,098,000
Police Protection: $2,909,000
Regular Highways: $1,956,000
Financial Administration: $1,206,000
Judicial and Legal Services: $1,093,000
Health - Other: $776,000
Local Fire Protection: $707,000
Correctional Institutions: $636,000
General Public Buildings: $565,000
Central Staff Services: $565,000
Public Welfare, Vendor Payments for Medical Care: $432,000
Corrections - Other: $345,000
General - Other: $225,000
Libraries: $220,000
Natural Resources - Other: $130,000
Solid Waste Management: $19,000
- General - Interest on Debt: $651,000
- Local Intergovernmental - Other: $186,000
- Long Term Debt - Beginning Outstanding - Unspecified Public Purpose: $12,559,000
Outstanding Unspecified Public Purpose: $11,976,000
Retired Unspecified Public Purpose: $583,000
- Miscellaneous - Fines and Forfeits: $210,000
General Revenue - Other: $128,000
Donations From Private Sources: $88,000
Interest Earnings: $27,000
Rents: $11,000
- Other Funds - Cash and Securities: $13,786,000
- State Intergovernmental - Other: $376,000
General Local Government Support: $14,000
Highways: $10,000
- Tax - Property: $15,015,000
Motor Vehicle License: $265,000
Other Selective Sales: $40,000
Somervell County government finances - Revenue in 2018:
- Charges - Hospital Public: $18,244,000
Parks and Recreation: $2,392,000
Other: $445,000
Regular Highways: $86,000
Solid Waste Management: $2,000
- Current Operations - Hospitals: $19,713,000
Parks and Recreation: $3,098,000
Police Protection: $2,909,000
Regular Highways: $1,956,000
Financial Administration: $1,206,000
Judicial and Legal Services: $1,093,000
Health - Other: $776,000
Local Fire Protection: $707,000
Correctional Institutions: $636,000
General Public Buildings: $565,000
Central Staff Services: $565,000
Public Welfare, Vendor Payments for Medical Care: $432,000
Corrections - Other: $345,000
General - Other: $225,000
Libraries: $220,000
Natural Resources - Other: $130,000
Solid Waste Management: $19,000
- General - Interest on Debt: $651,000
- Local Intergovernmental - Other: $186,000
- Long Term Debt - Beginning Outstanding - Unspecified Public Purpose: $12,559,000
Outstanding Unspecified Public Purpose: $11,976,000
Retired Unspecified Public Purpose: $583,000
- Miscellaneous - Fines and Forfeits: $210,000
General Revenue - Other: $128,000
Donations From Private Sources: $88,000
Interest Earnings: $27,000
Rents: $11,000
- Other Funds - Cash and Securities: $13,786,000
- State Intergovernmental - Other: $376,000
General Local Government Support: $14,000
Highways: $10,000
- Tax - Property: $15,015,000
Motor Vehicle License: $265,000
Other Selective Sales: $40,000
Somervell County government finances - Debt in 2018:
- Charges - Hospital Public: $18,244,000
Parks and Recreation: $2,392,000
Other: $445,000
Regular Highways: $86,000
Solid Waste Management: $2,000
- Current Operations - Hospitals: $19,713,000
Parks and Recreation: $3,098,000
Police Protection: $2,909,000
Regular Highways: $1,956,000
Financial Administration: $1,206,000
Judicial and Legal Services: $1,093,000
Health - Other: $776,000
Local Fire Protection: $707,000
Correctional Institutions: $636,000
General Public Buildings: $565,000
Central Staff Services: $565,000
Public Welfare, Vendor Payments for Medical Care: $432,000
Corrections - Other: $345,000
General - Other: $225,000
Libraries: $220,000
Natural Resources - Other: $130,000
Solid Waste Management: $19,000
- General - Interest on Debt: $651,000
- Local Intergovernmental - Other: $186,000
- Long Term Debt - Beginning Outstanding - Unspecified Public Purpose: $12,559,000
Outstanding Unspecified Public Purpose: $11,976,000
Retired Unspecified Public Purpose: $583,000
- Miscellaneous - Fines and Forfeits: $210,000
General Revenue - Other: $128,000
Donations From Private Sources: $88,000
Interest Earnings: $27,000
Rents: $11,000
- Other Funds - Cash and Securities: $13,786,000
- State Intergovernmental - Other: $376,000
General Local Government Support: $14,000
Highways: $10,000
- Tax - Property: $15,015,000
Motor Vehicle License: $265,000
Other Selective Sales: $40,000
Somervell County government finances - Cash and Securities in 2018:
- Charges - Hospital Public: $18,244,000
Parks and Recreation: $2,392,000
Other: $445,000
Regular Highways: $86,000
Solid Waste Management: $2,000
- Current Operations - Hospitals: $19,713,000
Parks and Recreation: $3,098,000
Police Protection: $2,909,000
Regular Highways: $1,956,000
Financial Administration: $1,206,000
Judicial and Legal Services: $1,093,000
Health - Other: $776,000
Local Fire Protection: $707,000
Correctional Institutions: $636,000
General Public Buildings: $565,000
Central Staff Services: $565,000
Public Welfare, Vendor Payments for Medical Care: $432,000
Corrections - Other: $345,000
General - Other: $225,000
Libraries: $220,000
Natural Resources - Other: $130,000
Solid Waste Management: $19,000
- General - Interest on Debt: $651,000
- Local Intergovernmental - Other: $186,000
- Long Term Debt - Beginning Outstanding - Unspecified Public Purpose: $12,559,000
Outstanding Unspecified Public Purpose: $11,976,000
Retired Unspecified Public Purpose: $583,000
- Miscellaneous - Fines and Forfeits: $210,000
General Revenue - Other: $128,000
Donations From Private Sources: $88,000
Interest Earnings: $27,000
Rents: $11,000
- Other Funds - Cash and Securities: $13,786,000
- State Intergovernmental - Other: $376,000
General Local Government Support: $14,000
Highways: $10,000
- Tax - Property: $15,015,000
Motor Vehicle License: $265,000
Other Selective Sales: $40,000
Supplemental Security Income (SSI) in 2006:
- Total number of recipients: 112
- Number of aged recipients: 20
- Number of blind and disabled recipients: 92
- Number of recipients under 18: 17
- Number of recipients between 18 and 64: 63
- Number of recipients older than 64: 32
- Number of recipients also receiving OASDI: 45
- Amount of payments (thousands of dollars): 39
| Most common first names in Somervell County, TX among deceased individuals | ||
| Name | Count | Lived (average) |
|---|---|---|
| William | 48 | 76.1 years |
| James | 37 | 70.8 years |
| John | 31 | 74.4 years |
| Mary | 31 | 83.1 years |
| Robert | 16 | 69.5 years |
| Dorothy | 15 | 77.9 years |
| Ruby | 15 | 81.8 years |
| Charles | 14 | 75.0 years |
| George | 14 | 73.8 years |
| Billy | 13 | 66.9 years |
| Most common last names in Somervell County, TX among deceased individuals | ||
| Last name | Count | Lived (average) |
|---|---|---|
| Williams | 16 | 75.0 years |
| Wilson | 15 | 83.5 years |
| West | 14 | 68.7 years |
| Moore | 13 | 80.6 years |
| Osborn | 12 | 79.1 years |
| Stewart | 12 | 74.5 years |
| Smith | 11 | 74.5 years |
| Davis | 11 | 76.6 years |
| Taylor | 10 | 82.6 years |
| Thompson | 9 | 73.9 years |
| Businesses in Somervell County, TX | ||||
| Name | Count | Name | Count | |
|---|---|---|---|---|
| Ace Hardware | 1 | La Quinta | 1 | |
| Best Western | 1 | SONIC Drive-In | 1 | |
| Burger King | 1 | Subway | 1 | |
| FedEx | 1 | U-Haul | 2 | |
| H&R Block | 1 | UPS | 1 | |
| Holiday Inn | 1 | |||