Valencia County, New Mexico (NM)
County owner-occupied free and clear houses and condos in 2010: 7,088
County owner-occupied houses and condos in 2000: 19,032
Renter-occupied apartments: 5,501 (it was 3,649 in 2000)
| % of renters here: | 16% |
| State: | 31% |
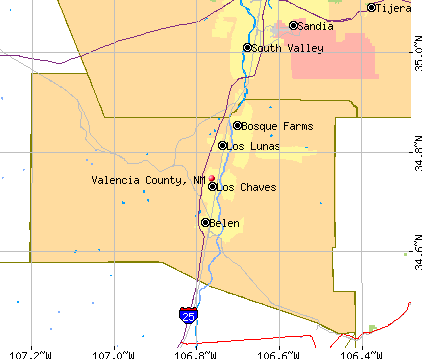
Land area: 1068 sq. mi.
Water area: 0.6 sq. mi.
Population density: 73 people per square mile (average).
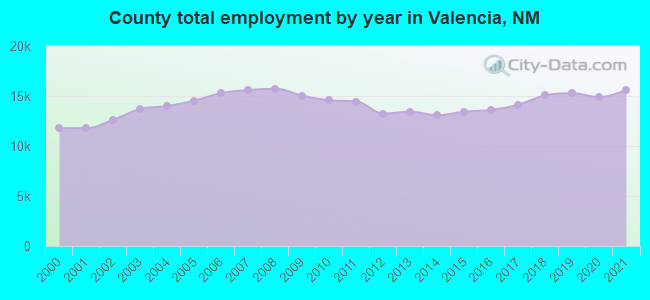
Industries providing employment: Educational, health and social services (25.3%), Retail trade (11.8%), Professional, scientific, management, administrative, and waste management services (11.2%), Public administration (10.1%).
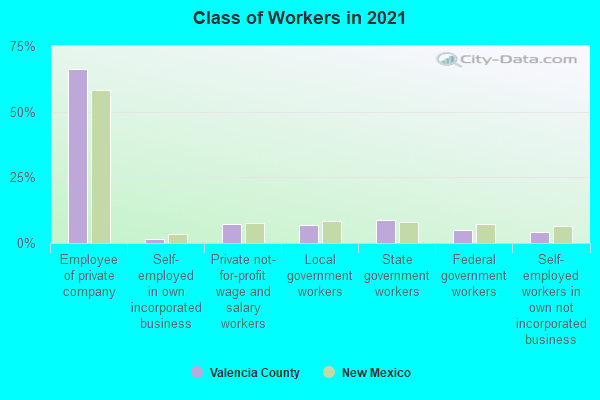
Type of workers:
- Private wage or salary: 66%
- Government: 27%
- Self-employed, not incorporated: 7%
- Unpaid family work: 0%
- OSM Map
- General Map
- Google Map
- MSN Map

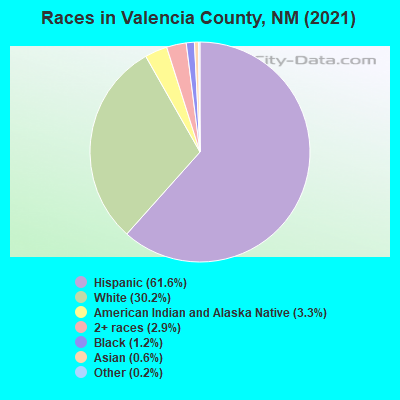
- 47,19161.4%Hispanic or Latino
- 23,33830.4%White Non-Hispanic Alone
- 2,4663.2%American Indian and Alaska Native alone
- 2,1082.7%Two or more races
- 9681.3%Black Non-Hispanic Alone
- 5230.7%Asian alone
- 2310.3%Some other race alone
| Median resident age: | 39.9 years |
| New Mexico median age: | 39.4 years |
| Males: 39,791 | |
| Females: 38,289 |

 | New Mexico Covid-19 discussion (429 replies) |
| How much more will Los Lunas grow? (41 replies) |
| Rio del oro (7 replies) |
| Family looking to move to either Clovis, Portales, or possibly Rio Rancho. (Flooding, MJ, NW Rio Rancho dev gone awry?) (6 replies) |
| Los Lunas NM (29 replies) |
| Warning: Do not move to this state or city (62 replies) |
| Valencia County: | 2.0 people |
| New Mexico: | 3 people |
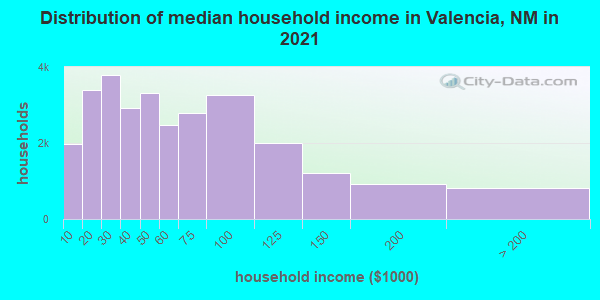
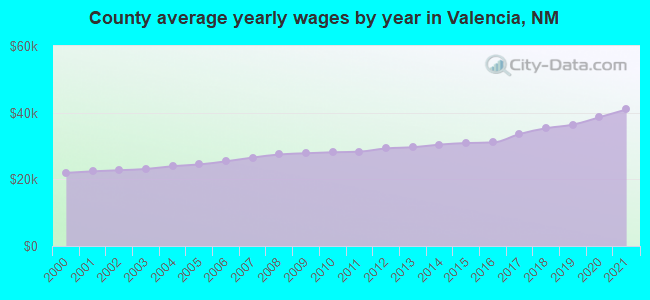
Estimated median household income in 2022: $48,638 ($34,099 in 1999)
| This county: | $48,638 |
| New Mexico: | $59,726 |
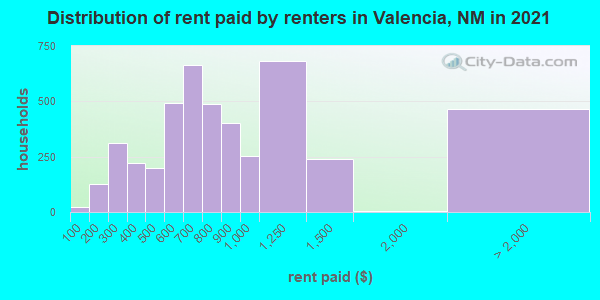
Median contract rent in 2022 for apartments: $690 (lower quartile is $469, upper quartile is $902)
| This county: | $690 |
| State: | $816 |
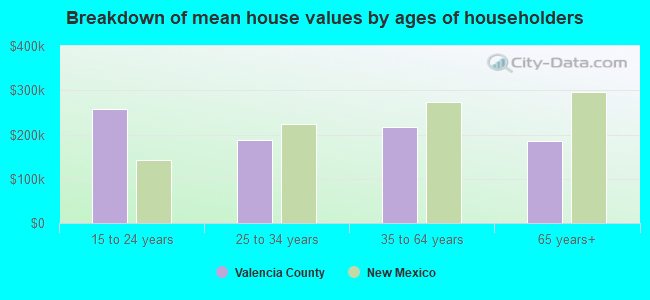
Estimated median house or condo value in 2022: $207,400 (it was $91,700 in 2000)
| Valencia: | $207,400 |
| New Mexico: | $243,100 |
Median monthly housing costs for homes and condos with a mortgage: $1,181
Median monthly housing costs for units without a mortgage: $413
Institutionalized population: 1,478
Crime in 2021 (reported by the sheriff's office or county police, not the county total):
- Murders: 0
- Rapes: 15
- Robberies: 9
- Assaults: 189
- Burglaries: 264
- Thefts: 284
- Auto thefts: 129
Crime in 2020 (reported by the sheriff's office or county police, not the county total):
- Murders: 1
- Rapes: 25
- Robberies: 7
- Assaults: 145
- Burglaries: 228
- Thefts: 255
- Auto thefts: 118
Health of residents in Valencia County based on CDC Behavioral Risk Factor Surveillance System Survey Questionnaires from 2013 to 2021:
General health status score of residents in this county from 1 (poor) to 5 (excellent) is 3.5. This is about average.77.5% of residents exercised in the past month. This is about average.
43.3% of residents smoked 100+ cigarettes in their lives. This is about average.
52.3% of adult residents drank alcohol in the past 30 days. This is less than average.
69.3% of residents visited a dentist within the past year. This is about average.
Average weight of males is 192 pounds. This is about average.
Average weight of females is 158 pounds. This is about average.
Health of residents in Valencia County based on CDC Behavioral Risk Factor Surveillance System Survey Questionnaires from 2003 to 2012:
General health status score of residents in this county from 1 (poor) to 5 (excellent) is 3.3. This is significantly worse than average.71.1% of residents exercised in the past month. This is about average.
53.0% of residents smoked 100+ cigarettes in their lives. This is more than average.
63.7% of adult residents drank alcohol in the past 30 days. This is less than average.
61.8% of residents visited a dentist within the past year. This is less than average.
Average weight of males is 191 pounds. This is about average.
Average weight of females is 159 pounds. This is about average.
42.4% of residents keep firearms around their homes. This is more than average.
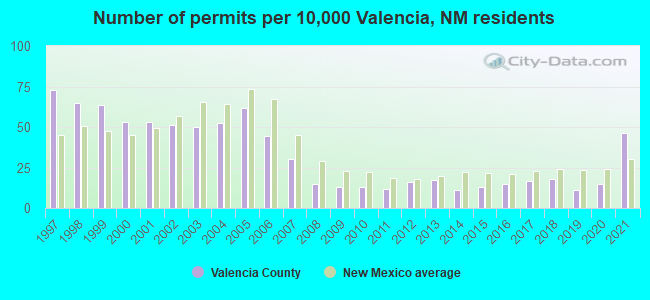
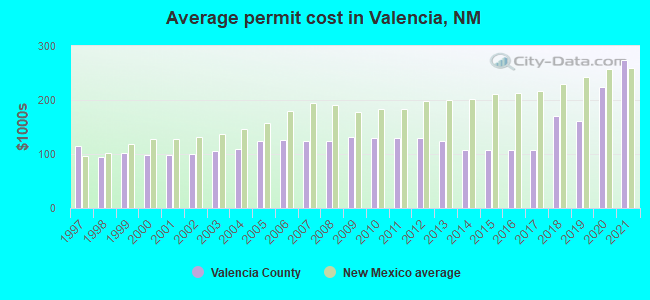
Single-family new house construction building permits:
- 2022: 249 buildings, average cost: $279,600
- 2021: 308 buildings, average cost: $274,300
- 2020: 96 buildings, average cost: $224,100
- 2019: 75 buildings, average cost: $162,300
- 2018: 118 buildings, average cost: $170,600
- 2017: 110 buildings, average cost: $108,400
- 2016: 96 buildings, average cost: $108,400
- 2015: 86 buildings, average cost: $108,400
- 2014: 75 buildings, average cost: $108,400
- 2013: 114 buildings, average cost: $124,900
- 2012: 107 buildings, average cost: $128,600
- 2011: 78 buildings, average cost: $128,500
- 2010: 87 buildings, average cost: $130,200
- 2009: 84 buildings, average cost: $131,400
- 2008: 98 buildings, average cost: $124,200
- 2007: 200 buildings, average cost: $125,100
- 2006: 294 buildings, average cost: $126,000
- 2005: 408 buildings, average cost: $125,300
- 2004: 346 buildings, average cost: $109,500
- 2003: 329 buildings, average cost: $106,400
- 2002: 340 buildings, average cost: $100,100
- 2001: 353 buildings, average cost: $99,400
- 2000: 350 buildings, average cost: $97,800
- 1999: 421 buildings, average cost: $101,600
- 1998: 429 buildings, average cost: $94,600
- 1997: 481 buildings, average cost: $114,800
Median real estate property taxes paid for housing units with mortgages in 2022: $1,324 (0.6%)
Median real estate property taxes paid for housing units with no mortgage in 2022: $1,351 (0.7%)

| Valencia County: | 21.6% |
| New Mexico: | 17.6% |
Median age of residents in 2022: 39.9 years old
(Males: 39.2 years old, Females: 42.0 years old)
(Median age for: White residents: 51.8 years old, Black residents: 43.3 years old, American Indian residents: 36.4 years old, Asian residents: 36.5 years old, Hispanic or Latino residents: 35.0 years old, Other race residents: 39.2 years old)
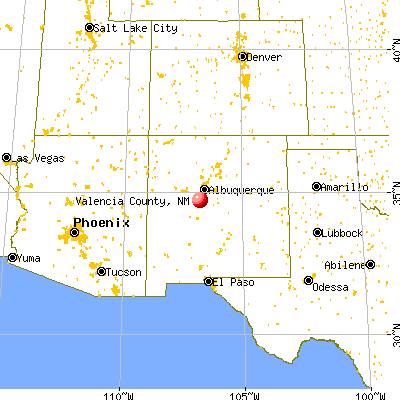
Area name: Albuquerque, NM MSA
Fair market rent in 2006 for a 1-bedroom apartment in Valencia County is $571 a month.
Fair market rent for a 2-bedroom apartment is $721 a month.
Fair market rent for a 3-bedroom apartment is $1050 a month.
Cities in this county include: Los Lunas, Belen, El Cerro-Monterey Park, Los Chaves, El Cerro Mission, Valencia, Meadow Lake, Rio Communities, Bosque Farms, Peralta.
2023 air pollution in Valencia County:
Ozone (1-hour): 0.036 ppm (standard limit: 0.12 ppm). Near U.S. average.
Notable locations in this county outside city limits:
Notable locations in Valencia County: Smart Ranch (A), Smith Ranch (B), Spencer Ranch (C), Williams Ranch (D), Starks Dairy (E), Southern Draw Dairy (F), South Slope Dairy (G), Sas Dairy (H), Ridgecrest Dairy (I), Rajen Dairy (J), Providence Dairy (K), Powerline Dairy (L), North Pointe Dairy (M), Native Pastures (N), Arrowhead Dairy (O), Palla Dairy (P), Route 77 Dairy (Q), Rio Leche Dairy (R), Mid - Frisian Dairy (S), Highland Dairy (T). Display/hide their locations on the map
Churches in Valencia County include: Rosedale Baptist Church (A), Church of the Nazarene (B). Display/hide their locations on the map
Cemeteries: Field Cemetery (1), Pleasant Hill Cemetery (2), Yeakley Cemetery (3), Texico Cemetery (4), North Cemetery (5), Roach Cemetery (6), Mitchel Cemetery (7). Display/hide their locations on the map
Lakes: Dead Horse Lake (A), Little Tule Lake (B), Pleasure Lake (C), Tule Lake (D), Santa Fe Lake (E), Buffalo Lake (F), Brooks Lake (G). Display/hide their locations on the map
Streams, rivers, and creeks: Cañada del Tule (A). Display/hide its location on the map
Neighboring counties: Kershaw County, South Carolina  , Duplin County, North Carolina , Castro County, Texas , Meigs County, Tennessee , Hale County, Texas .
| Here: | 3.9% |
| New Mexico: | 3.6% |
Current college students: 2,835
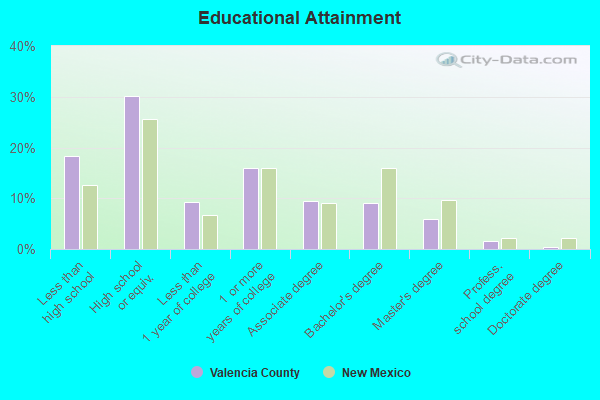
People 25 years of age or older with a high school degree or higher: 83.6%
People 25 years of age or older with a bachelor's degree or higher: 21.3%
Number of foreign born residents: 7,169 (32.7% naturalized citizens)
| Valencia County: | 9.2% |
| Whole state: | 9.3% |
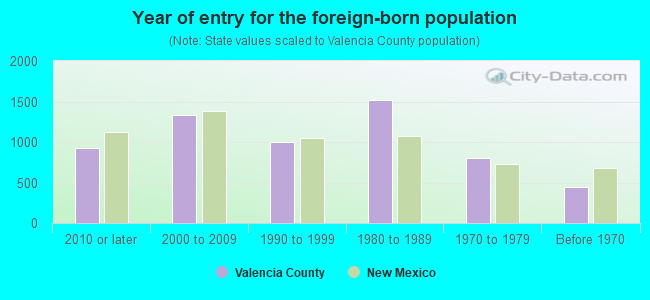
- Year of entry for the foreign-born population
- 1,2852010 or later
- 1,3362000 to 2009
- 1,2681990 to 1999
- 1,5161980 to 1989
- 8061970 to 1979
- 446Before 1970
Mean travel time to work (commute): minutes
Percentage of county residents living and working in this county: 99.9%
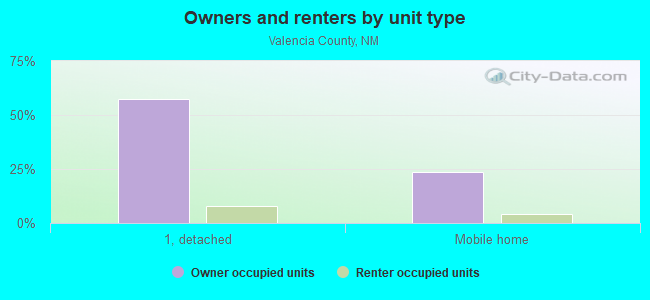
Housing units in structures:
- One, detached: 19,243
- One, attached: 460
- Two: 283
- 3 or 4: 183
- 5 to 9: 65
- 10 to 19: 410
- 20 to 49: 178
- 50 or more: 129
- Mobile homes: 9,360
- Boats, RVs, vans, etc.: 54
Housing units in Valencia County with a mortgage: 14,299 (755 second mortgage, 0 home equity loan, 290 both second mortgage and home equity loan)
Houses without a mortgage: 378
| Here: | 3.6% with mortgage |
| State: | 98.8% with mortgage |
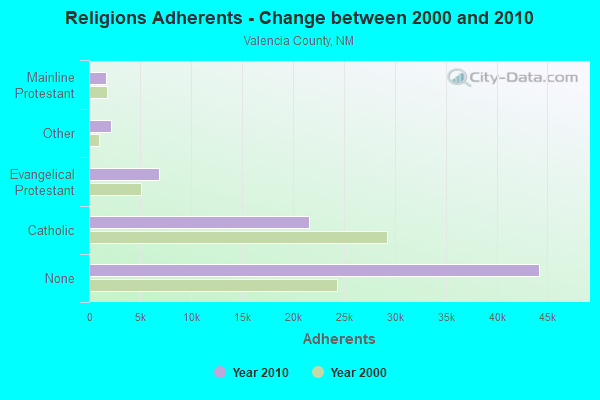
Religion statistics for Valencia County
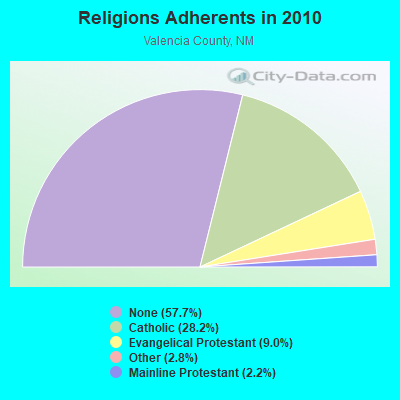
| Religion | Adherents | Congregations |
|---|---|---|
| Catholic | 21,584 | 12 |
| Evangelical Protestant | 6,889 | 45 |
| Other | 2,180 | 11 |
| Mainline Protestant | 1,703 | 8 |
| None | 44,213 | - |
Source: Clifford Grammich, Kirk Hadaway, Richard Houseal, Dale E.Jones, Alexei Krindatch, Richie Stanley and Richard H.Taylor. 2012. 2010 U.S.Religion Census: Religious Congregations & Membership Study. Association of Statisticians of American Religious Bodies. Jones, Dale E., et al. 2002. Congregations and Membership in the United States 2000. Nashville, TN: Glenmary Research Center.
Food Environment Statistics:
| Valencia County: | 1.55 / 10,000 pop. |
| State: | 1.44 / 10,000 pop. |
| Here: | 0.28 / 10,000 pop. |
| New Mexico: | 0.21 / 10,000 pop. |
| This county: | 0.28 / 10,000 pop. |
| New Mexico: | 0.32 / 10,000 pop. |
| Valencia County: | 3.23 / 10,000 pop. |
| New Mexico: | 4.06 / 10,000 pop. |
| This county: | 3.94 / 10,000 pop. |
| State: | 7.12 / 10,000 pop. |
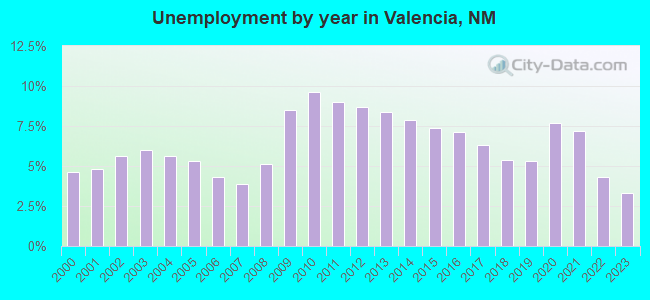
| Valencia County: | 7.4% |
| New Mexico: | 6.4% |
| Valencia County: | 25.8% |
| State: | 22.1% |
Agriculture in Valencia County:
Average size of farms: 514 acresAverage value of agricultural products sold per farm: $24,672
Average value of crops sold per acre for harvested cropland: $392.59
The value of nursery, greenhouse, floriculture, and sod as a percentage of the total market value of agricultural products sold: 2.82%
The value of livestock, poultry, and their products as a percentage of the total market value of agricultural products sold: 79.11%
Average total farm production expenses per farm: $24,012
Harvested cropland as a percentage of land in farms: 2.55%
Irrigated harvested cropland as a percentage of land in farms: 93.36%
Average market value of all machinery and equipment per farm: $28,077
The percentage of farms operated by a family or individual: 95.82%
Average age of principal farm operators: 55 years
Average number of cattle and calves per 100 acres of all land in farms: 6.67
Milk cows as a percentage of all cattle and calves: 16.44%
Vegetables: 16 harvested acres
Land in orchards: 61 acres
Tornado activity:
Valencia County historical area-adjusted tornado activity is significantly below New Mexico state average. It is 5568005.1 times below overall U.S. average.Tornadoes in this county have caused 4 injuries recorded between 1950 and 2004.
On 6/18/1968, a category 2 (max. wind speeds 113-157 mph) tornado injured 3 people and caused between $50,000 and $500,000 in damages.
Earthquake activity:
Valencia County-area historical earthquake activity is significantly above New Mexico state average. It is 702% greater than the overall U.S. average.On 1/29/1990 at 13:16:10, a magnitude 4.8 (4.5 MB, 4.8 LG, Depth: 7.5 mi, Class: Light, Intensity: IV - V) earthquake occurred 20.6 miles away from Valencia County center
On 6/28/1992 at 11:57:34, a magnitude 7.6 (6.2 MB, 7.6 MS, 7.3 MW, Depth: 0.7 mi, Class: Major, Intensity: VIII - XII) earthquake occurred 558.1 miles away from the county center, causing 3 deaths (1 shaking deaths, 2 other deaths) and 400 injuries, causing $100,000,000 total damage and $40,000,000 insured losses
On 10/16/1999 at 09:46:44, a magnitude 7.4 (6.3 MB, 7.4 MS, 7.2 MW, 7.3 ML) earthquake occurred 550.3 miles away from the county center
On 5/19/1940 at 04:36:40, a magnitude 7.2 (7.2 UK) earthquake occurred 522.8 miles away from the county center, causing $33,000,000 total damage
On 8/23/2011 at 05:46:18, a magnitude 5.3 (5.3 MW, Depth: 2.5 mi, Class: Moderate, Intensity: VI - VII) earthquake occurred 197.7 miles away from Valencia County center
On 6/29/2014 at 04:59:35, a magnitude 5.3 (5.3 MW, Depth: 4.0 mi) earthquake occurred 203.7 miles away from the county center
Magnitude types: regional Lg-wave magnitude (LG), body-wave magnitude (MB), local magnitude (ML), surface-wave magnitude (MS), moment magnitude (MW)
Most recent natural disasters:
- New Mexico Covid-19 Pandemic, Incident Period: January 20, 2020, FEMA Id: 4529, Natural disaster type: Other
- New Mexico Belen Fire, Incident Period: February 23, 2007 to March 05, 2007, Fire Management Assistance Declared: February 24, 2007, FEMA Id: 2682, Natural disaster type: Fire
- New Mexico Severe Storms & Flooding, Incident Period: July 26, 2006 to September 18, 2006, Major Disaster (Presidential) Declared DR-1659: August 30, 2006, FEMA Id: 1659, Natural disaster type: Storm, Flood
- New Mexico Hurricane Katrina Evacuation, Incident Period: August 29, 2005 to October 01, 2005, Emergency Declared EM-3229: September 07, 2005, FEMA Id: 3229, Natural disaster type: Hurricane
- New Mexico New Mexico Fire, Incident Period: May 05, 2000 to July 07, 2000, Emergency Declared EM-3154: May 10, 2000, FEMA Id: 3154, Natural disaster type: Fire
- New Mexico Rio Grande Fire Complex, Incident Period: April 18, 2000 to April 30, 2000, Fire Management Assistance Declared: April 20, 2000, FEMA Id: 2295, Natural disaster type: Fire
- New Mexico SEVERE STORMS, SNOW MELT, FLOODING, Incident Period: May 11, 1973, Major Disaster (Presidential) Declared DR-380: May 11, 1973, FEMA Id: 380, Natural disaster type: Storm, Flood, Snow
The number of natural disasters in Valencia County (7) is smaller than the US average (15).
Major Disasters (Presidential) Declared: 2
Emergencies Declared: 2
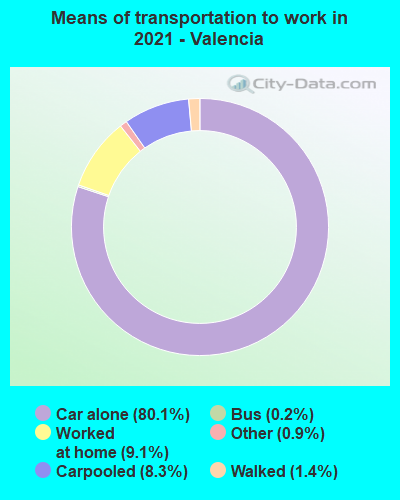
Means of transportation to work:
- Drove a car alone: 15,834 (76.6%)
- Carpooled: 1,365 (6.6%)
- Bus: 36 (0.2%)
- Ferryboat: 4 (0.0%)
- Taxicab, motorcycle, or other means: 303 (1.5%)
- Walked: 230 (1.1%)
- Worked at home: 2,929 (14.2%)

- Health care and social assistance (24%)
- Retail trade (13%)
- Educational services (11%)
- Other services, except public administration (8%)
- Finance and insurance (8%)
- Administrative and support and waste management services (6%)
- Public administration (6%)
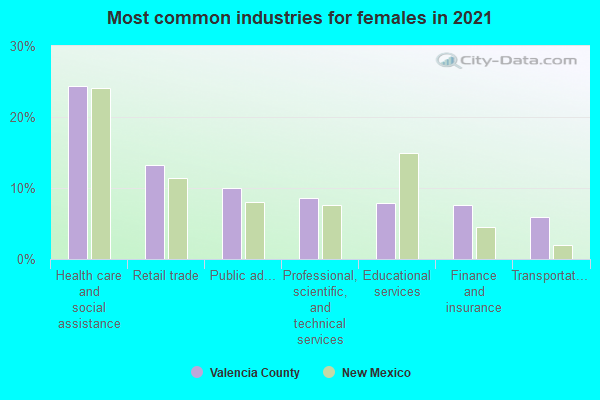
- Health care and social assistance (26%)
- Retail trade (14%)
- Educational services (12%)
- Other services, except public administration (8%)
- Finance and insurance (8%)
- Administrative and support and waste management services (6%)
- Public administration (6%)
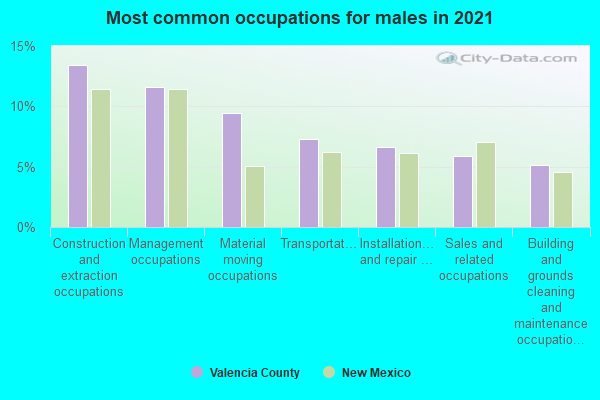
- Construction and extraction occupations (13%)
- Installation, maintenance, and repair occupations (10%)
- Sales and related occupations (10%)
- Management occupations (9%)
- Material moving occupations (8%)
- Transportation occupations (8%)
- Office and administrative support occupations (7%)
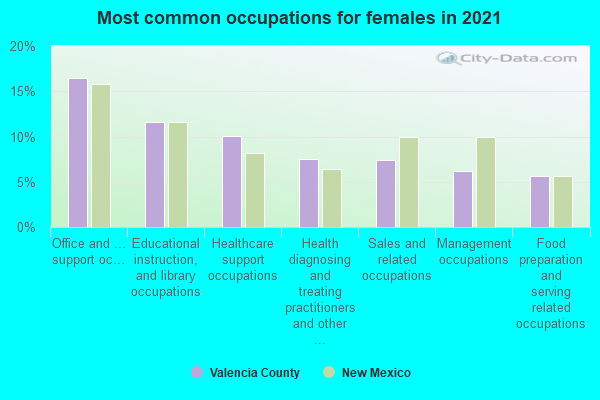
- Healthcare support occupations (16%)
- Office and administrative support occupations (16%)
- Sales and related occupations (13%)
- Educational instruction, and library occupations (8%)
- Food preparation and serving related occupations (6%)
- Business and financial operations occupations (5%)
- Management occupations (5%)
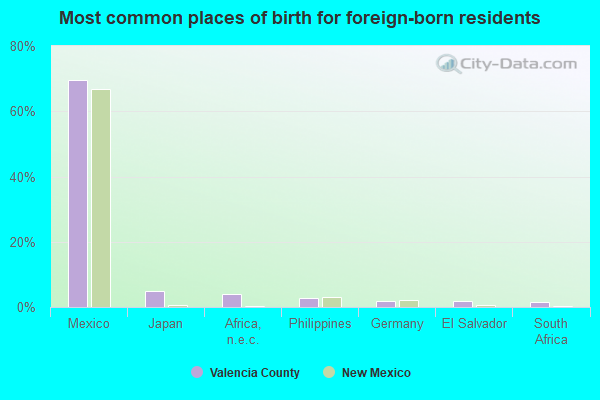
- Mexico (73%)
- Japan (4%)
- Philippines (4%)
- Africa, n.e.c. (2%)
- Germany (2%)
- El Salvador (2%)
- Vietnam (2%)
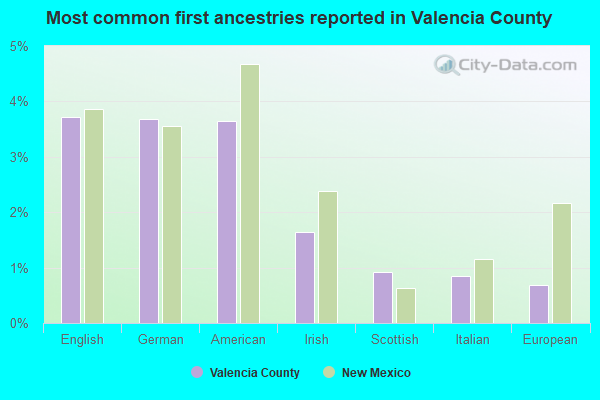
- American (4%)
- English (4%)
- German (3%)
- Irish (2%)
- Italian (1%)
- Scottish (1%)
- European (1%)
People in group quarters in Valencia County, New Mexico in 2010:
- 1,206 people in state prisons
- 143 people in local jails and other municipal confinement facilities
- 98 people in nursing facilities/skilled-nursing facilities
- 31 people in residential treatment centers for juveniles (non-correctional)
- 29 people in other noninstitutional facilities
- 10 people in group homes intended for adults
- 8 people in workers' group living quarters and job corps centers
- 4 people in residential treatment centers for adults
People in group quarters in Valencia County, New Mexico in 2000:
- 1,008 people in state prisons
- 126 people in nursing homes
- 97 people in local jails and other confinement facilities (including police lockups)
- 52 people in other noninstitutional group quarters
- 31 people in homes for the mentally retarded
- 17 people in short-term care, detention or diagnostic centers for delinquent children
- 11 people in residential treatment centers for emotionally disturbed children
- 10 people in mental (psychiatric) hospitals or wards
- 9 people in homes for abused, dependent, and neglected children
- 5 people in religious group quarters
- 4 people in homes for the mentally ill
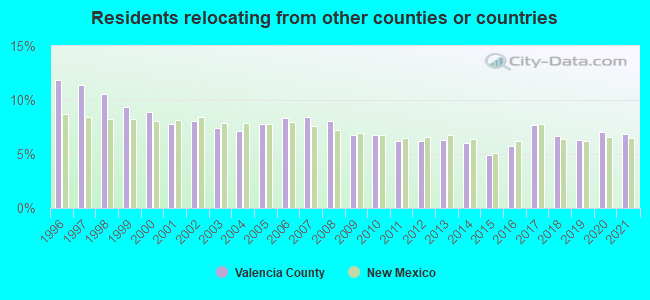
6.88% of this county's 2021 resident taxpayers lived in other counties in 2020 ($45,617 average adjusted gross income)
| Here: | 6.88% |
| New Mexico average: | 6.50% |
10 or fewer of this county's residents moved from foreign countries.
4.76% relocated from other counties in New Mexico ($29,357 average AGI)
2.13% relocated from other states ($16,260 average AGI)
Valencia County: 2.13% New Mexico average: 3.84%
Top counties from which taxpayers relocated into this county between 2020 and 2021:
| from Bernalillo County, NM | |
| from Sandoval County, NM | |
| from Socorro County, NM | |
| from Maricopa County, AZ | |
| from Cibola County, NM | |
| from Dona Ana County, NM | |
| from Santa Fe County, NM |
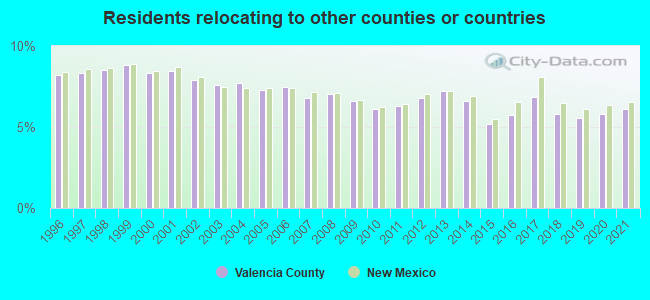
6.09% of this county's 2020 resident taxpayers moved to other counties in 2021 ($42,398 average adjusted gross income)
| Here: | 6.09% |
| New Mexico average: | 6.53% |
10 or fewer of this county's residents moved to foreign countries.
3.93% relocated to other counties in New Mexico ($24,733 average AGI)
2.16% relocated to other states ($17,664 average AGI)
Valencia County: 2.16% New Mexico average: 3.90%
Top counties to which taxpayers relocated from this county between 2020 and 2021:
| to Bernalillo County, NM | |
| to Sandoval County, NM | |
| to Socorro County, NM | |
| to Cibola County, NM | |
| to Santa Fe County, NM | |
| to Maricopa County, AZ | |
| to Dona Ana County, NM |
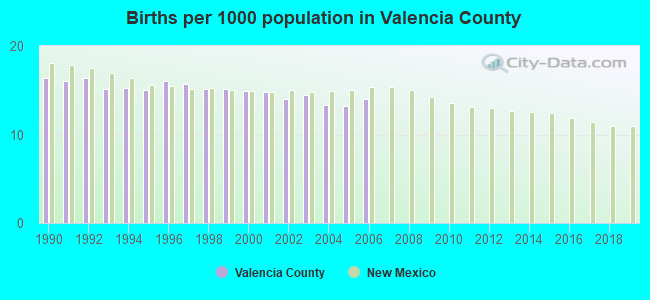
Births per 1000 population from 1990 to 1999: 15.6
Births per 1000 population from 2000 to 2006: 14.1
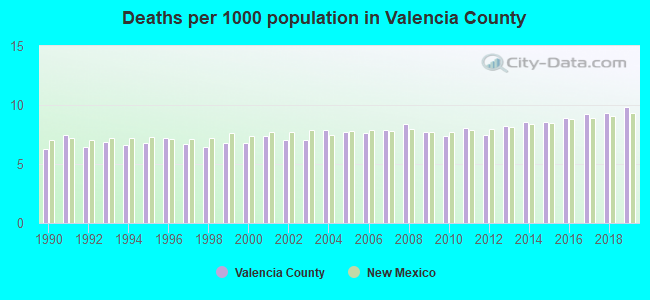
Deaths per 1000 population from 1990 to 1999: 6.8
Deaths per 1000 population from 2000 to 2009: 7.5
Deaths per 1000 population from 2010 to 2020: 8.8
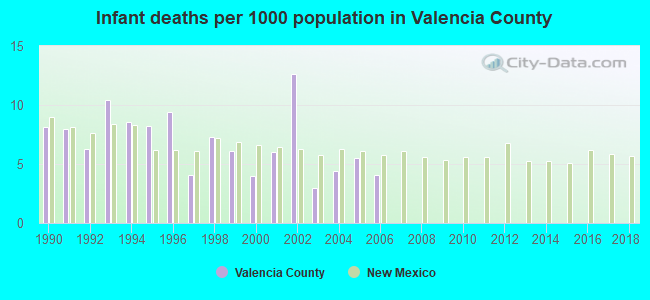
Infant deaths per 1000 live births from 1990 to 1999: 7.7
Infant deaths per 1000 live births from 2000 to 2006: 5.7
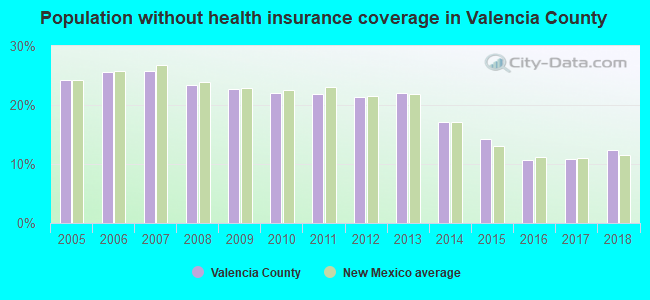
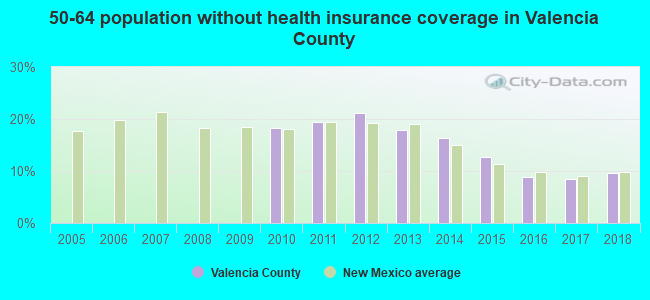
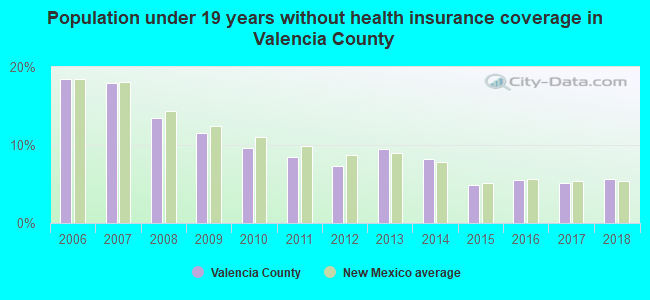
Persons under 19 years old without health insurance coverage in 2018: 5.7%
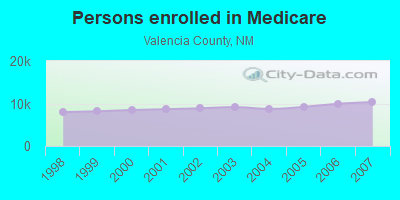
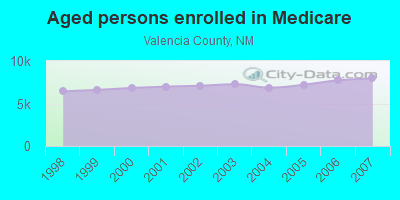
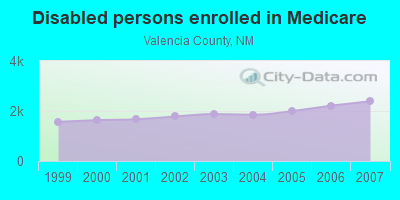
Persons enrolled in hospital insurance and/or supplemental medical insurance (Medicare) in July 1, 2007: 10,335 (7,945 aged, 2,390 disabled)
Children under 18 without health insurance coverage in 2007: 2,949 (16%)
Most common underlying causes of death in Valencia County, New Mexico in 1999 - 2019:
- Chronic obstructive pulmonary disease, unspecified (676)
- Bronchus or lung, unspecified - Malignant neoplasms (654)
- Atherosclerotic heart disease (589)
- Acute myocardial infarction, unspecified (577)
- Atherosclerotic cardiovascular disease, so described (522)
- Unspecified dementia (267)
- Stroke, not specified as haemorrhage or infarction (205)
- Alzheimer disease, unspecified (166)
- Unspecified diabetes mellitus, without complications (141)
- Pneumonia, unspecified (127)
Population without health insurance coverage in 2000: 22%
Children under 18 without health insurance coverage in 2000: 18%
Medical specialist MDs per 100,000 population in 2005: 810
Dentists per 100,000 population in 1998: 1
Total births per 100,000 population, July 2005 - July 2006 : 17
Total deaths per 100,000 population, July 2005 - July 2006: 60
Limited-service eating places per 100,000 population in 2005 : 7
EPA green book nonattainment status in 2004-2006: 1
Homicides per 1,000,000 population from 2000 to 2006: 109.5. This is more than state average.
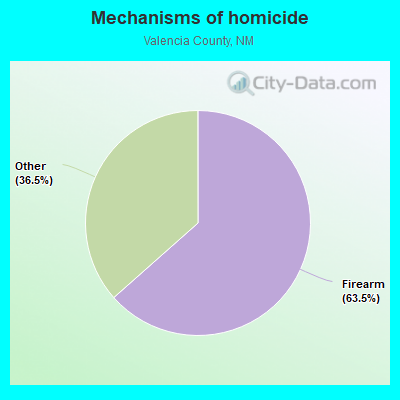
- Firearm - 69.5
- Other - 40.0
Suicides per 1,000,000 population from 2000 to 2006: 168.5. This is less than state average.
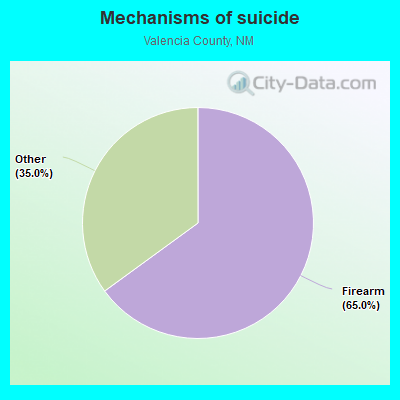
- Firearm - 109.5
- Other - 59.0
Household type by relationship:
Households: 78,080- Male householders: 13,312 (4,454 living alone), Female householders: 15,768 (3,825 living alone)
12,174 spouses (12,009 opposite-sex spouses), 1,884 unmarried partners, (1,884 opposite-sex unmarried partners), 23,896 children (20,751 natural, 691 adopted, 2,454 stepchildren), 2,510 grandchildren, 809 brothers or sisters, 1,407 parents, 0 foster children, 2,242 other relatives, 2,428 non-relatives
- In group quarters: 1,650
Size of family households: 9,619 2-persons, 3,488 3-persons, 3,952 4-persons, 1,942 5-persons, 725 6-persons.
Size of nonfamily households: 8,279 1-person, 894 2-persons, 181 4-persons.
8,251 married couples with children.
6,212 single-parent households (417 men, 5,795 women).
73.0% of residents of Valencia speak English at home.
24.9% of residents speak Spanish at home (72% speak English very well, 18% speak English well, 8% speak English not well, 2% don't speak English at all).
0.4% of residents speak other Indo-European language at home (50% speak English very well, 46% speak English well, 4% speak English not well).
0.5% of residents speak Asian or Pacific Island language at home (86% speak English very well, 5% speak English well, 2% speak English not well, 7% don't speak English at all).
1.8% of residents speak other language at home (81% speak English very well, 18% speak English well, 1% speak English not well).
In fiscal year 2004:
Federal Government expenditure: $323,668,000 ($4,711 per capita)
Department of Defense expenditure: $16,642,000
Federal direct payments to individuals for retirement and disability: $170,948,000
Federal other direct payments to individuals: $62,328,000
Federal direct payments not to individuals: $1,531,000
Federal grants: $77,175,000
Federal procurement contracts: $4,341,000 ($1,775,000 Department of Defense)
Federal salaries and wages: $7,345,000 ($543,000 Department of Defense)
Federal Government direct loans: $2,455,000
Federal guaranteed/insured loans: $51,958,000
Federal Government insurance: $361,080,000
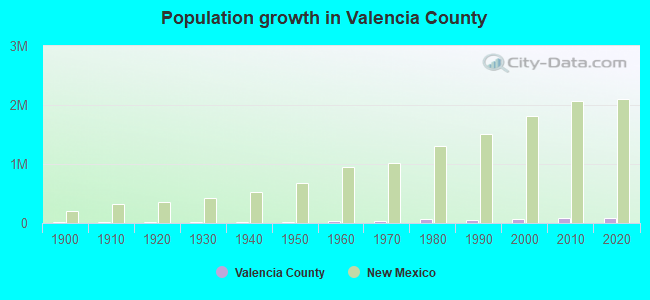
Population change from April 1, 2000 to July 1, 2005:
Births: 5,120| Here: | 74 per 1000 residents |
| State: | 74 per 1000 residents |
Deaths: 2,233
| Here: | 32 per 1000 residents |
| State: | 36 per 1000 residents |
Net international migration: +683
| Here: | +10 per 1000 residents |
| State: | +15 per 1000 residents |
Net internal migration: -193
| Here: | |
| State: |
Total withdrawal of fresh water for public supply: 5.01 millions of gallons per day (all from ground)
| Here: | 5.9 |
| State: | 5.9 |
| Here: | 5.0 |
| State: | 4.2 |
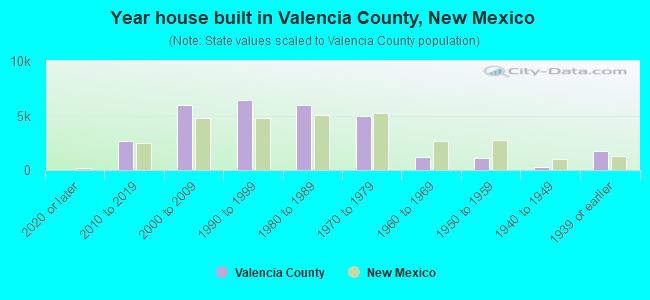
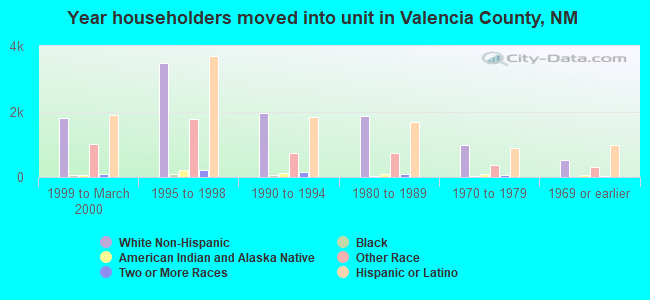
- Year house built in Valencia County, New Mexico
- 4442020 or later
- 1,6792010 to 2019
- 4,5612000 to 2009
- 7,2631990 to 1999
- 6,0451980 to 1989
- 6,0831970 to 1979
- 2,6771960 to 1969
- 4631950 to 1959
- 6341940 to 1949
- 8091939 or earlier
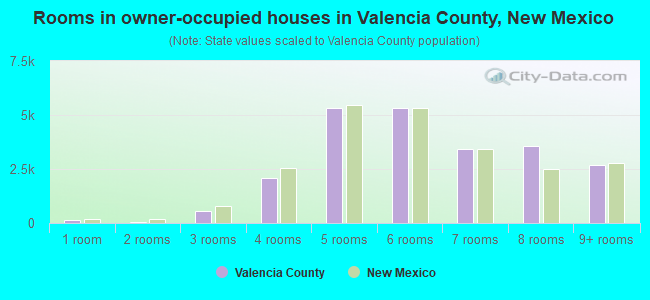
- Rooms in owner-occupied houses in Valencia County, New Mexico
- 2011 room
- 2212 rooms
- 9363 rooms
- 3,7544 rooms
- 5,6285 rooms
- 4,8346 rooms
- 4,3937 rooms
- 2,8348 rooms
- 2,7319+ rooms
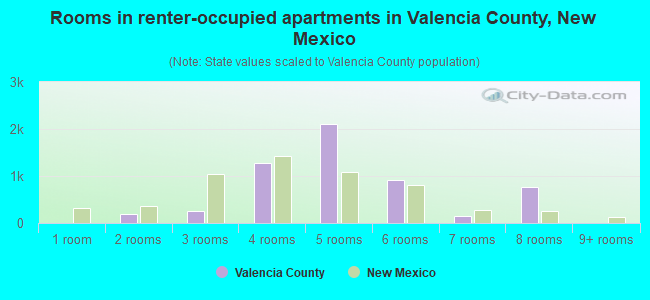
- Rooms in renter-occupied apartments in Valencia County, New Mexico
- 3241 room
- 742 rooms
- 2303 rooms
- 4994 rooms
- 1,3815 rooms
- 4126 rooms
- 1877 rooms
- 3778 rooms
- 649+ rooms
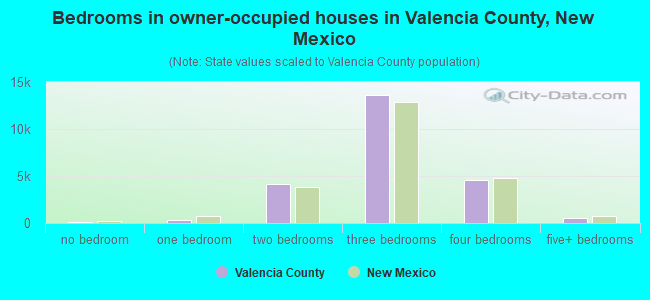
- Bedrooms in owner-occupied houses in Valencia County, New Mexico
- 361no bedroom
- 4751 bedroom
- 4,2972 bedrooms
- 14,6293 bedrooms
- 5,0994 bedrooms
- 6715+ bedrooms

- Bedrooms in renter-occupied apartments in Valencia County, New Mexico
- 324no bedroom
- 1751 bedroom
- 1,2402 bedrooms
- 1,5523 bedrooms
- 994 bedrooms
- 1585+ bedrooms
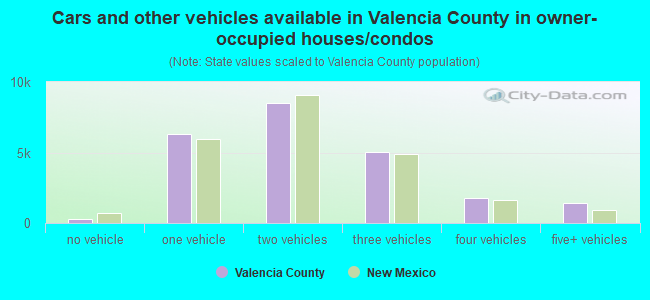
- Cars and other vehicles available in Valencia County in owner-occupied houses/condos
- 828no vehicle
- 7,0291 vehicle
- 7,0422 vehicles
- 5,8673 vehicles
- 2,2344 vehicles
- 2,5325+ vehicles

- Cars and other vehicles available in Valencia County in renter-occupied apartments
- 87no vehicle
- 1,6381 vehicle
- 1,0282 vehicles
- 5713 vehicles
- 2244 vehicles
- 05+ vehicles
91.7% of Valencia County residents lived in the same house 1 years ago.
Out of people who lived in different houses, 28% lived in this county.
Out of people who lived in different counties, 70% lived in New Mexico.
| Valencia County: | 91.7% |
| State average: | 88.2% |
Place of birth for U.S.-born residents:
- This state: 49,479
- Other state: 19,877
- Northeast: 2,176
- Midwest: 4,384
- South: 5,510
- West: 7,807
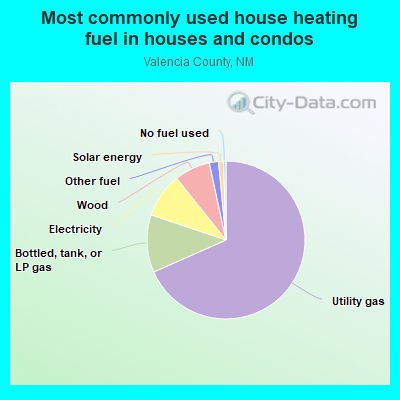
- 66.7%Utility gas
- 13.5%Bottled, tank, or LP gas
- 9.7%Electricity
- 6.9%Wood
- 1.5%Other fuel
- 1.2%Solar energy
- 0.4%No fuel used

- 80.4%Utility gas
- 9.0%Bottled, tank, or LP gas
- 6.0%Electricity
- 4.0%Wood
- 0.5%Other fuel
- 0.2%No fuel used
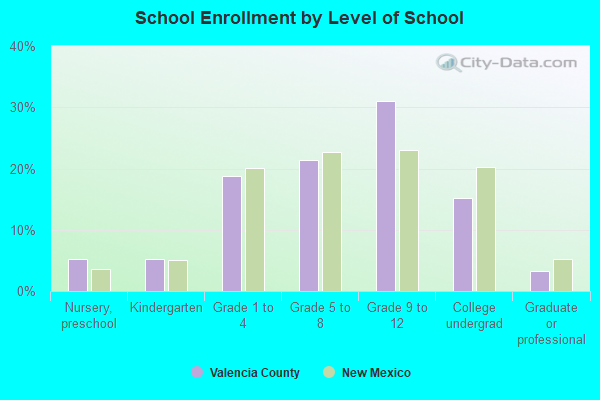
Private vs. public school enrollment:
| Here: | 15.7% |
| New Mexico: | 10.2% |
| Here: | 18.0% |
| New Mexico: | 10.0% |
| Here: | 13.3% |
| New Mexico: | 12.3% |

Valencia County government finances - Expenditure in 2020:
- Bond Funds - Cash and Securities: $5,514,000
Cash and Securities: $4,525,000
- Current Operations - Central Staff Services: $2,411,000
Central Staff Services: $2,328,000
- General - Interest on Debt: $479,000
Interest on Debt: $433,000
- Long Term Debt - Beginning Outstanding - Unspecified Public Purpose: $13,112,000
Outstanding Unspecified Public Purpose: $13,112,000
Beginning Outstanding - Unspecified Public Purpose: $13,112,000
Outstanding Unspecified Public Purpose: $13,112,000
- Other Funds - Cash and Securities: $12,026,000
Cash and Securities: $9,869,000
- Sinking Funds - Cash and Securities: $2,847,000
Cash and Securities: $2,336,000
- State Intergovernmental - General Local Government Support: $341,000
General Local Government Support: $267,000
- Tax - Property: $15,821,000
Property: $13,877,000
General Sales and Gross Receipts: $9,789,000
General Sales and Gross Receipts: $8,586,000
Motor Vehicle License: $549,000
Motor Vehicle License: $482,000
Occupation and Business License - Other: $41,000
Occupation and Business License - Other: $36,000
Alcoholic Beverage License: $1,000
Alcoholic Beverage License: $1,000
- Total Salaries and Wages: $1,952,000
: $1,815,000
Valencia County government finances - Revenue in 2020:
- Bond Funds - Cash and Securities: $5,514,000
Cash and Securities: $4,525,000
- Current Operations - Central Staff Services: $2,411,000
Central Staff Services: $2,328,000
- General - Interest on Debt: $479,000
Interest on Debt: $433,000
- Long Term Debt - Beginning Outstanding - Unspecified Public Purpose: $13,112,000
Outstanding Unspecified Public Purpose: $13,112,000
Beginning Outstanding - Unspecified Public Purpose: $13,112,000
Outstanding Unspecified Public Purpose: $13,112,000
- Other Funds - Cash and Securities: $12,026,000
Cash and Securities: $9,869,000
- Sinking Funds - Cash and Securities: $2,847,000
Cash and Securities: $2,336,000
- State Intergovernmental - General Local Government Support: $341,000
General Local Government Support: $267,000
- Tax - Property: $15,821,000
Property: $13,877,000
General Sales and Gross Receipts: $9,789,000
General Sales and Gross Receipts: $8,586,000
Motor Vehicle License: $549,000
Motor Vehicle License: $482,000
Occupation and Business License - Other: $41,000
Occupation and Business License - Other: $36,000
Alcoholic Beverage License: $1,000
Alcoholic Beverage License: $1,000
- Total Salaries and Wages: $1,952,000
: $1,815,000
Valencia County government finances - Debt in 2020:
- Bond Funds - Cash and Securities: $5,514,000
Cash and Securities: $4,525,000
- Current Operations - Central Staff Services: $2,411,000
Central Staff Services: $2,328,000
- General - Interest on Debt: $479,000
Interest on Debt: $433,000
- Long Term Debt - Beginning Outstanding - Unspecified Public Purpose: $13,112,000
Outstanding Unspecified Public Purpose: $13,112,000
Beginning Outstanding - Unspecified Public Purpose: $13,112,000
Outstanding Unspecified Public Purpose: $13,112,000
- Other Funds - Cash and Securities: $12,026,000
Cash and Securities: $9,869,000
- Sinking Funds - Cash and Securities: $2,847,000
Cash and Securities: $2,336,000
- State Intergovernmental - General Local Government Support: $341,000
General Local Government Support: $267,000
- Tax - Property: $15,821,000
Property: $13,877,000
General Sales and Gross Receipts: $9,789,000
General Sales and Gross Receipts: $8,586,000
Motor Vehicle License: $549,000
Motor Vehicle License: $482,000
Occupation and Business License - Other: $41,000
Occupation and Business License - Other: $36,000
Alcoholic Beverage License: $1,000
Alcoholic Beverage License: $1,000
- Total Salaries and Wages: $1,952,000
: $1,815,000
Valencia County government finances - Cash and Securities in 2020:
- Bond Funds - Cash and Securities: $5,514,000
Cash and Securities: $4,525,000
- Current Operations - Central Staff Services: $2,411,000
Central Staff Services: $2,328,000
- General - Interest on Debt: $479,000
Interest on Debt: $433,000
- Long Term Debt - Beginning Outstanding - Unspecified Public Purpose: $13,112,000
Outstanding Unspecified Public Purpose: $13,112,000
Beginning Outstanding - Unspecified Public Purpose: $13,112,000
Outstanding Unspecified Public Purpose: $13,112,000
- Other Funds - Cash and Securities: $12,026,000
Cash and Securities: $9,869,000
- Sinking Funds - Cash and Securities: $2,847,000
Cash and Securities: $2,336,000
- State Intergovernmental - General Local Government Support: $341,000
General Local Government Support: $267,000
- Tax - Property: $15,821,000
Property: $13,877,000
General Sales and Gross Receipts: $9,789,000
General Sales and Gross Receipts: $8,586,000
Motor Vehicle License: $549,000
Motor Vehicle License: $482,000
Occupation and Business License - Other: $41,000
Occupation and Business License - Other: $36,000
Alcoholic Beverage License: $1,000
Alcoholic Beverage License: $1,000
- Total Salaries and Wages: $1,952,000
: $1,815,000
Supplemental Security Income (SSI) in 2006:
- Total number of recipients: 2,133
- Number of aged recipients: 204
- Number of blind and disabled recipients: 1,929
- Number of recipients under 18: 346
- Number of recipients between 18 and 64: 1,369
- Number of recipients older than 64: 418
- Number of recipients also receiving OASDI: 744
- Amount of payments (thousands of dollars): 974
| Home Mortgage Disclosure Act Aggregated Statistics For Year 2009 (Based on 19 full tracts) | ||||||||||||||
| A) FHA, FSA/RHS & VA Home Purchase Loans | B) Conventional Home Purchase Loans | C) Refinancings | D) Home Improvement Loans | E) Loans on Dwellings For 5+ Families | F) Non-occupant Loans on < 5 Family Dwellings (A B C & D) | G) Loans On Manufactured Home Dwelling (A B C & D) | ||||||||
|---|---|---|---|---|---|---|---|---|---|---|---|---|---|---|
| Number | Average Value | Number | Average Value | Number | Average Value | Number | Average Value | Number | Average Value | Number | Average Value | Number | Average Value | |
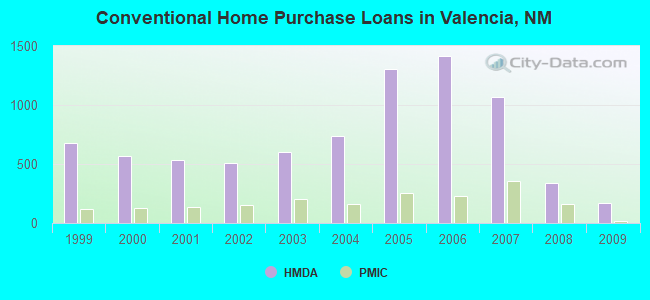
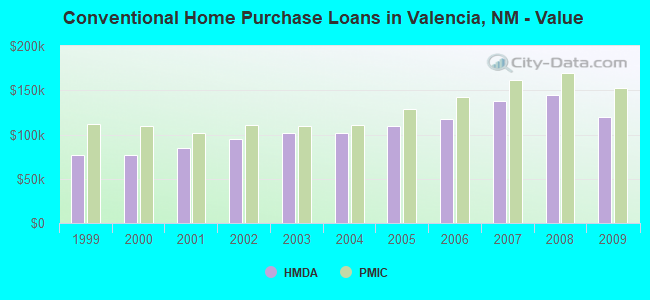
| LOANS ORIGINATED | 355 | $138,400 | 173 | $119,225 | 1,170 | $157,643 | 108 | $51,806 | 0 | $0 | 73 | $112,521 | 87 | $84,862 |
| APPLICATIONS APPROVED, NOT ACCEPTED | 18 | $145,333 | 24 | $117,958 | 168 | $144,696 | 16 | $68,500 | 1 | $650,000 | 13 | $71,769 | 37 | $78,676 |
| APPLICATIONS DENIED | 164 | $138,116 | 75 | $130,707 | 632 | $156,649 | 130 | $38,377 | 0 | $0 | 32 | $115,594 | 135 | $77,830 |
| APPLICATIONS WITHDRAWN | 38 | $148,816 | 33 | $156,242 | 363 | $157,278 | 20 | $76,800 | 0 | $0 | 16 | $134,125 | 33 | $97,667 |
| FILES CLOSED FOR INCOMPLETENESS | 6 | $116,833 | 7 | $94,714 | 96 | $149,792 | 4 | $20,000 | 0 | $0 | 4 | $120,500 | 15 | $85,267 |
| Private Mortgage Insurance Companies Aggregated Statistics For Year 2009 (Based on 14 full tracts) | ||||||||
| A) Conventional Home Purchase Loans | B) Refinancings | C) Non-occupant Loans on < 5 Family Dwellings (A & B) | D) Loans On Manufactured Home Dwelling (A & B) | |||||
|---|---|---|---|---|---|---|---|---|
| Number | Average Value | Number | Average Value | Number | Average Value | Number | Average Value | |
| LOANS ORIGINATED | 17 | $152,706 | 37 | $197,838 | 3 | $165,333 | 0 | $0 |
| APPLICATIONS APPROVED, NOT ACCEPTED | 11 | $215,091 | 22 | $199,773 | 1 | $204,000 | 0 | $0 |
| APPLICATIONS DENIED | 3 | $202,667 | 20 | $213,700 | 2 | $158,000 | 2 | $96,000 |
| APPLICATIONS WITHDRAWN | 1 | $204,000 | 8 | $176,375 | 4 | $123,750 | 0 | $0 |
| FILES CLOSED FOR INCOMPLETENESS | 0 | $0 | 0 | $0 | 0 | $0 | 0 | $0 |
| Most common first names in Valencia County, NM among deceased individuals | ||
| Name | Count | Lived (average) |
|---|---|---|
| Mary | 161 | 75.8 years |
| John | 160 | 72.6 years |
| Robert | 149 | 66.3 years |
| William | 149 | 72.8 years |
| James | 134 | 69.7 years |
| Jose | 116 | 76.0 years |
| Frank | 91 | 74.7 years |
| Charles | 86 | 70.5 years |
| George | 80 | 73.0 years |
| Richard | 78 | 62.5 years |
| Most common last names in Valencia County, NM among deceased individuals | ||
| Last name | Count | Lived (average) |
|---|---|---|
| Sanchez | 236 | 74.0 years |
| Chavez | 215 | 72.8 years |
| Baca | 133 | 72.7 years |
| Garcia | 122 | 71.9 years |
| Romero | 90 | 68.5 years |
| Jaramillo | 87 | 74.2 years |
| Aragon | 80 | 74.7 years |
| Smith | 78 | 72.9 years |
| Montoya | 67 | 70.0 years |
| Trujillo | 66 | 69.1 years |
| Businesses in Valencia County, NM | ||||
| Name | Count | Name | Count | |
|---|---|---|---|---|
| Arby's | 1 | Long John Silver's | 1 | |
| AutoZone | 3 | Lowe's | 1 | |
| Baskin-Robbins | 1 | MasterBrand Cabinets | 4 | |
| Big O Tires | 1 | McDonald's | 4 | |
| Burger King | 1 | Nike | 2 | |
| Carl\s Jr. | 1 | Panda Express | 1 | |
| Chevrolet | 1 | Papa John's Pizza | 1 | |
| Circle K | 3 | Payless | 1 | |
| Cold Stone Creamery | 1 | Pizza Hut | 2 | |
| Cricket Wireless | 5 | Quiznos | 1 | |
| Curves | 1 | SONIC Drive-In | 3 | |
| Days Inn | 1 | Sears | 1 | |
| Dennys | 1 | Staples | 1 | |
| Discount Tire | 1 | Starbucks | 1 | |
| Fashion Bug | 1 | Subway | 2 | |
| FedEx | 6 | Super 8 | 1 | |
| Ford | 1 | T-Mobile | 2 | |
| GameStop | 1 | Taco Bell | 2 | |
| H&R Block | 3 | True Value | 1 | |
| Holiday Inn | 1 | U-Haul | 5 | |
| Home Depot | 1 | UPS | 5 | |
| Jones New York | 1 | Village Inn | 1 | |
| KFC | 1 | Walmart | 2 | |
| Kroger | 1 | Wendy's | 1 | |
| Little Caesars Pizza | 1 | |||
Valencia County on our top lists:
- #4 on the list of "Top 101 counties with highest percentage of residents voting for 3rd party candidates in the 2012 Presidential Election (pop. 50,000+)"
- #13 on the list of "Top 101 counties with highest percentage of residents voting for 3rd party candidates in the 2012 Presidential Election"
- #16 on the list of "Top 101 counties with the lowest percentage of residents that visited a dentist within the past year"
- #23 on the list of "Top 101 counties with the highest percentage of residents that smoked 100+ cigarettes in their lives"
- #29 on the list of "Top 101 counties with the lowest percentage of residents that drank alcohol in the past 30 days"
- #37 on the list of "Top 101 counties with the highest percentage of residents that keep firearms around their homes"
- #38 on the list of "Top 101 counties with the worst general health status score of residents (1-5), 3 years of data"
- #74 on the list of "Top 101 counties with the largest increase in the number of deaths per 1000 residents 2000-2006 to 2007-2013 (pop. 50,000+)"
- #80 on the list of "Top 101 counties with the lowest average weight of females"