Carlsbad: Fire Incidents, California (CA)
Where are fire incidents reported in Carlsbad, CA
Something went wrong! Please refresh the page.
| Fire incidents reported | |
|---|---|
| Sreet name | Count |
| EL CAMINO REAL | 164 |
| PALOMAR AIRPORT RD | 68 |
| JEFFERSON ST | 56 |
| TAMARACK AVE | 56 |
| AVENIDA ENCINAS | 46 |
| CARLSBAD VILLAGE DR | 46 |
| CARLSBAD BL | 40 |
| CARLSBAD BLVD | 34 |
| STATE ST | 30 |
| PASEO DEL NORTE | 28 |
| LA COSTA AVE | 26 |
| CHESTNUT AVE | 24 |
| CHINQUAPIN AVE | 24 |
| MARRON RD | 24 |
| WHITMAN WAY | 24 |
| I-5 FWY | 22 |
| SUNNY CREEK RD | 22 |
| FARADAY AVE | 20 |
| I5 NB | 20 |
| LOKER AVE | 20 |
| ALGA RD | 18 |
| ALICANTE RD | 18 |
| CALLE BARCELONA | 18 |
| CANNON RD | 18 |
| COSTA DEL MAR RD | 18 |
| GRAND AVE | 18 |
| HAYMAR DR | 18 |
| HOSP WAY | 18 |
| LAGUNA DR | 18 |
| OCEAN ST | 18 |
| Other | 368 |
2005 - 2018 National Fire Incident Reporting System (NFIRS) incidents
- Incident types reported to NFIRS in Carlsbad, CA
- 22,11162.6%Rescue & EMS
- 6,61218.7%Good Intent Call
- 2,6717.6%Service Call
- 1,6724.7%False Alarm
- 1,3423.8%Fire
- 8762.5%Hazardous Condition
- Fire incident types reported to NFIRS in Carlsbad, CA
- 69251.6%Structure Fires
- 35126.2%Outside Fires
- 22016.4%Mobile Property/Vehicle Fires
- 795.9%Other
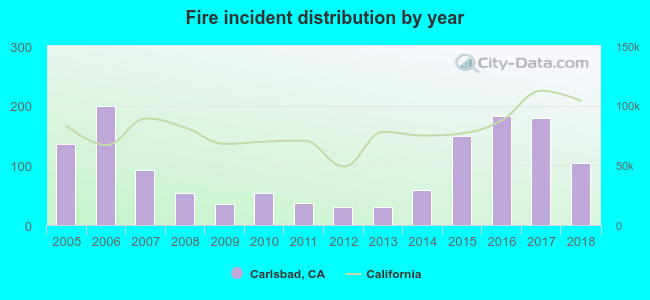 Based on the data from the years 2005 - 2018 the average number of fires per year is 96. The highest number of reported fire incidents - 200 took place in 2006, and the least - 30 in 2013. The data has a declining trend.
The average number of yearly fire incidents per 10k residents in Carlsbad, CA compared to nearest cities:
(Note: Based on data for the last 3 years, including only cities with population 5,000 and above)
| Carlsbad: | 13.8 |
| Encinitas: | 12.4 |
| Vista: | 24.5 |
| Oceanside: | 18.4 |
| San Marcos: | 15.0 |
| Solana Beach: | 36.7 |
| Escondido: | 17.9 |
| Fallbrook: | 36.7 |
| Valley Center: | 73.3 |
 The median response time based on all reported fire incidents is 6 minutes. This is close to the state median value.
The median response time in Carlsbad, CA compared to nearest cities:
(Note: Based on data for all years, including only cities with at least 500 fire incidents)
| Carlsbad: | 6 minutes |
| Encinitas: | 5 minutes |
| Vista: | 6 minutes |
| Oceanside: | 6 minutes |
| San Marcos: | 6 minutes |
| Rancho Santa Fe: | 6 minutes |
| Escondido: | 6 minutes |
| Fallbrook: | 10 minutes |
| San Diego: | 6 minutes |
 32.3% incidents where reported in the morning and 67.7% in the evening. The most fires (15.5%) took place on Wednesday, and the least (12.7%) on Thursday.
 Based on the 1,342 fire incident reports from years 2005 - 2018 most fires (10.4%) took place during January, and the least (5.7%) in December.
 Out of all 35,322 cases reported during the years 2005 - 2018, the most belonged to the categories: Rescue & EMS (62.6%), Good Intent Call (18.7%), and Service Call (7.6%).
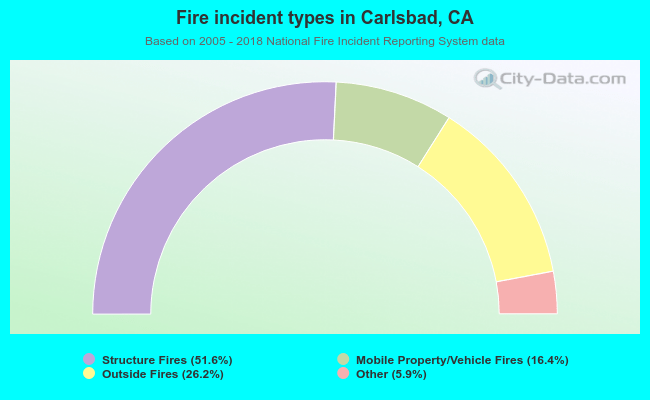 When looking into fire subcategories, the most incidents belonged to: Structure Fires (51.6%), and Outside Fires (26.2%).