Escondido: Fire Incidents, California (CA)
Where are fire incidents reported in Escondido, CA
Something went wrong! Please refresh the page.
| Fire incidents reported | |
|---|---|
| Sreet name | Count |
| VALLEY PKY | 296 |
| BROADWAY | 240 |
| EL NORTE PKY | 174 |
| MISSION AVE | 174 |
| WASHINGTON AVE | 162 |
| ESCONDIDO BLVD | 142 |
| GRAND AVE | 142 |
| BEAR VALLEY PKY | 120 |
| JUNIPER ST | 100 |
| FIG ST | 84 |
| LINCOLN AVE | 82 |
| CENTRE CITY PKY | 68 |
| HALE AVE | 68 |
| MORNING VIEW DR | 62 |
| QUINCE ST | 60 |
| VALLEY PY | 60 |
| 9TH AVE | 58 |
| MIDWAY DR | 58 |
| NB I15 | 58 |
| CITRUS AVE | 54 |
| SB I15 | 52 |
| ASH ST | 50 |
| LA HONDA DR | 50 |
| SAN PASQUAL VALLEY RD | 48 |
| VIA RANCHO PKY | 48 |
| VALLEY | 40 |
| WASHINGTON AV | 40 |
| TULIP ST | 36 |
| 11TH AVE | 34 |
| BEAR VALLEY PY | 34 |
| Other | 1,012 |
2005 - 2018 National Fire Incident Reporting System (NFIRS) incidents
- Incident types reported to NFIRS in Escondido, CA
- 47,15374.8%Rescue & EMS
- 5,0808.1%Good Intent Call
- 3,7065.9%Fire
- 3,6835.8%Service Call
- 2,0693.3%False Alarm
- 1,3042.1%Hazardous Condition
- Fire incident types reported to NFIRS in Escondido, CA
- 1,47639.8%Structure Fires
- 1,12830.4%Outside Fires
- 83422.5%Mobile Property/Vehicle Fires
- 2687.2%Other
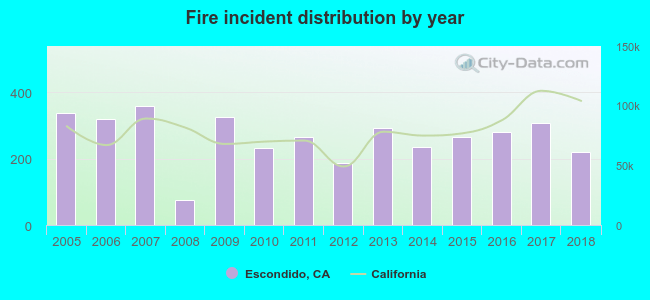 Based on the data from the years 2005 - 2018 the average number of fires per year is 264. The highest number of fire incidents - 359 took place in 2007, and the least - 75 in 2008. The data has a decreasing trend.
The average number of yearly fire incidents per 10k residents in Escondido, CA compared to nearest cities:
(Note: Based on data for the last 3 years, including only cities with population 5,000 and above)
| Escondido: | 17.9 |
| San Marcos: | 15.0 |
| Valley Center: | 73.3 |
| Vista: | 24.5 |
| Poway: | 16.2 |
| Encinitas: | 12.4 |
| Carlsbad: | 13.8 |
| Ramona: | 24.5 |
| Solana Beach: | 36.7 |
 The median response time based on all reported fire incidents is 6 minutes. This is close to the California median value.
The median response time in Escondido, CA compared to nearest cities:
(Note: Based on data for all years, including only cities with at least 500 fire incidents)
| Escondido: | 6 minutes |
| San Marcos: | 6 minutes |
| Rancho Santa Fe: | 6 minutes |
| Vista: | 6 minutes |
| Encinitas: | 5 minutes |
| Carlsbad: | 6 minutes |
| Ramona: | 5 minutes |
| Oceanside: | 6 minutes |
| Fallbrook: | 10 minutes |
 According to the reports from the years 2005 - 2018 the average number of fire-related yearly deaths is 1. The highest number of deaths - 3 took place in 2011, and the lowest - 0 in 2005. The data has a constant trend.
The average number of deaths per 1,000 fires is 2. This indicator was the highest - 11 in 2011, and the lowest 0 in 2005. The trend for deaths per 1,000 incidents is constant. Compared to the California value the number of deaths per 1,000 incidents is higher.
According to the reports from the years 2005 - 2018 the average number of fire-related yearly deaths is 1. The highest number of deaths - 3 took place in 2011, and the lowest - 0 in 2005. The data has a constant trend.
The average number of deaths per 1,000 fires is 2. This indicator was the highest - 11 in 2011, and the lowest 0 in 2005. The trend for deaths per 1,000 incidents is constant. Compared to the California value the number of deaths per 1,000 incidents is higher.Deaths per 1,000 incidents in Escondido, CA compared to nearest cities:
(Note: Based on data for all years, including only cities with at least 2,500 fire incidents)
| Escondido: | 2.2 |
| Vista: | 1.6 |
| Oceanside: | 1.0 |
| San Diego: | 0.8 |
| Chula Vista: | 3.6 |
 Based on the data from the years 2005 - 2018 the average number of fire-related yearly casualties is 7. The highest number of reported casualties - 17 took place in 2006, and the lowest - 1 in 2012. The data has a dropping trend.
The average number of injuries per 1,000 fires is 27. This indicator was the highest - 53 in 2008, and the lowest 4 in 2016. The trend for injuries per 1,000 fire incidents is dropping. Compared to the state value the number of injuries per 1,000 incidents is much higher.
Based on the data from the years 2005 - 2018 the average number of fire-related yearly casualties is 7. The highest number of reported casualties - 17 took place in 2006, and the lowest - 1 in 2012. The data has a dropping trend.
The average number of injuries per 1,000 fires is 27. This indicator was the highest - 53 in 2008, and the lowest 4 in 2016. The trend for injuries per 1,000 fire incidents is dropping. Compared to the state value the number of injuries per 1,000 incidents is much higher.Casualties per 1,000 incidents in Escondido, CA compared to nearest cities:
(Note: Based on data for all years, including only cities with at least 500 fire incidents)
| Escondido: | 25.9 |
| San Marcos: | 26.8 |
| Rancho Santa Fe: | 1.7 |
| Vista: | 14.4 |
| Encinitas: | 5.0 |
| Carlsbad: | 0.7 |
| Ramona: | 4.4 |
| Oceanside: | 3.5 |
| Fallbrook: | 7.3 |
 33.1% incidents where reported in the morning and 66.9% in the evening. The most fires (15.5%) took place on Sunday, and the least (13.2%) on Tuesday.
 Based on the 3,706 reports from years 2005 - 2018 most fires (10.4%) took place during May, and the least (6.5%) in February.
 Out of all 63,033 cases reported during the years 2005 - 2018, the most belonged to the categories: Rescue & EMS (74.8%), Good Intent Call (8.1%), and Fire (5.9%).
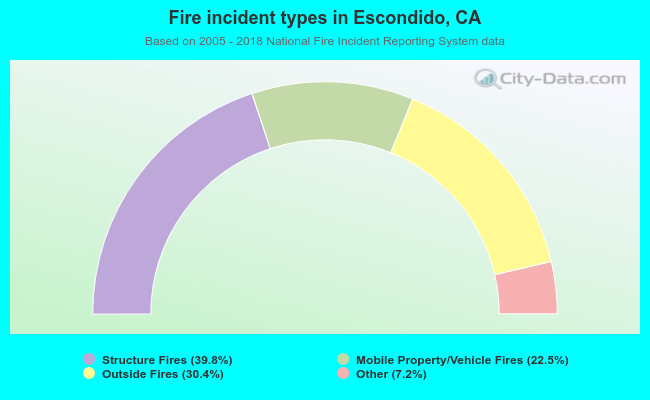 When looking into fire subcategories, the most reports belonged to: Structure Fires (39.8%), and Outside Fires (30.4%).