Oceanside: Fire Incidents, California (CA)
Where are fire incidents reported in Oceanside, CA
Something went wrong! Please refresh the page.
| Fire incidents reported | |
|---|---|
| Sreet name | Count |
| MISSION AVE | 230 |
| COLLEGE BL | 196 |
| OCEANSIDE BL | 182 |
| COLLEGE BLVD | 112 |
| EL CAMINO REAL | 112 |
| VISTA WAY | 92 |
| PACIFIC ST | 88 |
| OCEANSIDE BLVD | 80 |
| MESA DR | 68 |
| SR76 EB | 66 |
| TREMONT ST | 64 |
| DOUGLAS DR | 62 |
| SR-76 EB | 62 |
| RIVER RD | 60 |
| COAST HIGHWAY | 58 |
| THE STRAND | 50 |
| MELROSE DR | 46 |
| CLEVELAND ST | 42 |
| HARBOR DR | 42 |
| VISTA CAMPANA | 42 |
| SR76 WB | 40 |
| BUSH ST | 38 |
| CANYON DR | 36 |
| CATALINA CR | 36 |
| SR-76 WB | 36 |
| LAKE BL | 34 |
| BENET RD | 32 |
| COAST HY | 32 |
| PLAZA DR | 32 |
| SR78 EB | 32 |
| Other | 759 |
2006 - 2018 National Fire Incident Reporting System (NFIRS) incidents
- Incident types reported to NFIRS in Oceanside, CA
- 45,22865.3%Rescue & EMS
- 11,56716.7%Good Intent Call
- 6,3079.1%Service Call
- 2,8614.1%Fire
- 1,9172.8%False Alarm
- 1,2611.8%Hazardous Condition
- 1280.2%Special Incident
- Fire incident types reported to NFIRS in Oceanside, CA
- 1,21242.4%Outside Fires
- 99734.8%Structure Fires
- 43815.3%Mobile Property/Vehicle Fires
- 2147.5%Other
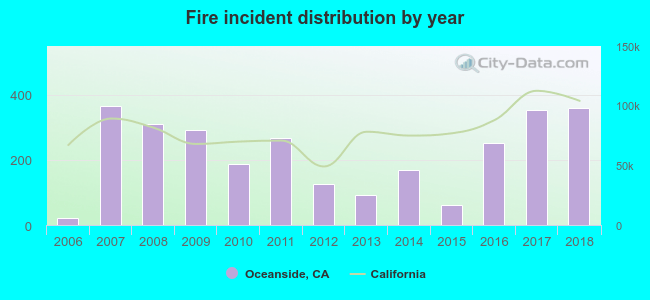 According to the data from the years 2006 - 2018 the average number of fire incidents per year is 219. The highest number of reported fires - 366 took place in 2007, and the least - 22 in 2006. The data has a growing trend.
The average number of yearly fire incidents per 10k residents in Oceanside, CA compared to nearest cities:
(Note: Based on data for the last 3 years, including only cities with population 5,000 and above)
| Oceanside: | 18.4 |
| Vista: | 24.5 |
| Carlsbad: | 13.8 |
| San Marcos: | 15.0 |
| Encinitas: | 12.4 |
| Fallbrook: | 36.7 |
| Escondido: | 17.9 |
| Solana Beach: | 36.7 |
| Valley Center: | 73.3 |
 The median response time based on all reported fire incidents is 6 minutes. This is comparable to the California median value.
The median response time in Oceanside, CA compared to nearest cities:
(Note: Based on data for all years, including only cities with at least 500 fire incidents)
| Oceanside: | 6 minutes |
| Vista: | 6 minutes |
| Carlsbad: | 6 minutes |
| San Marcos: | 6 minutes |
| Encinitas: | 5 minutes |
| Fallbrook: | 10 minutes |
| Rancho Santa Fe: | 6 minutes |
| Escondido: | 6 minutes |
| San Clemente: | 6 minutes |
 According to the reports from the years 2006 - 2018 the average number of fire-related fatalities per year is 0. The highest number of reported deaths - 1 took place in 2007, and the lowest - 0 in 2006. The data has a growing trend.
The average number of deaths per 1,000 fire incidents is 1. This indicator was the highest - 8 in 2012, and the lowest 0 in 2006. The trend for deaths per 1,000 fires is increasing. Compared to the state value the number of fatalities per 1,000 fires is lower.
According to the reports from the years 2006 - 2018 the average number of fire-related fatalities per year is 0. The highest number of reported deaths - 1 took place in 2007, and the lowest - 0 in 2006. The data has a growing trend.
The average number of deaths per 1,000 fire incidents is 1. This indicator was the highest - 8 in 2012, and the lowest 0 in 2006. The trend for deaths per 1,000 fires is increasing. Compared to the state value the number of fatalities per 1,000 fires is lower.
 Based on the data from the years 2006 - 2018 the average number of fire-related yearly casualties is 1. The highest number of casualties - 4 took place in 2009, and the lowest - 0 in 2006. The data has a constant trend.
The average number of casualties per 1,000 fires is 3. This indicator was the highest - 14 in 2009, and the lowest 0 in 2006. The trend for injuries per 1,000 incidents is constant. Compared to the state value the number of casualties per 1,000 fires is lower.
Based on the data from the years 2006 - 2018 the average number of fire-related yearly casualties is 1. The highest number of casualties - 4 took place in 2009, and the lowest - 0 in 2006. The data has a constant trend.
The average number of casualties per 1,000 fires is 3. This indicator was the highest - 14 in 2009, and the lowest 0 in 2006. The trend for injuries per 1,000 incidents is constant. Compared to the state value the number of casualties per 1,000 fires is lower.Casualties per 1,000 incidents in Oceanside, CA compared to nearest cities:
(Note: Based on data for all years, including only cities with at least 500 fire incidents)
| Oceanside: | 3.5 |
| Vista: | 14.4 |
| Carlsbad: | 0.7 |
| San Marcos: | 26.8 |
| Encinitas: | 5.0 |
| Fallbrook: | 7.3 |
| Rancho Santa Fe: | 1.7 |
| Escondido: | 25.9 |
| San Clemente: | 22.0 |
 31.8% incidents where reported in the morning and 68.2% in the evening. The most fires (15.6%) took place on Saturday, and the least (12.9%) on Wednesday.
 Based on the 2,861 fire incidents from years 2006 - 2018 most fires (9.4%) took place during January, and the least (6.6%) in September.
 Out of all 69,288 cases reported during the years 2006 - 2018, the most belonged to the categories: Rescue & EMS (65.3%), Good Intent Call (16.7%), and Service Call (9.1%).
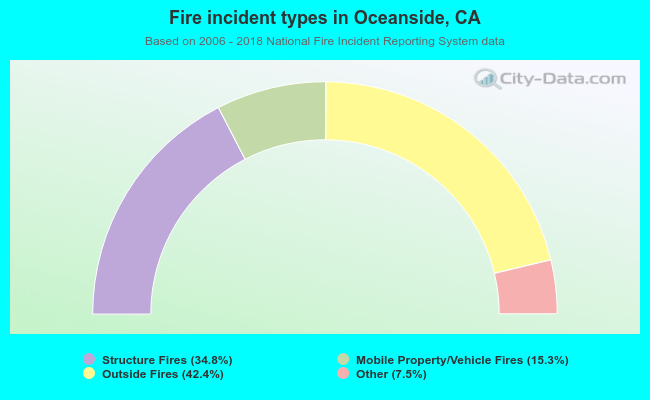 When looking into fire subcategories, the most reports belonged to: Outside Fires (42.4%), and Structure Fires (34.8%).