Emeryville, CA (California) Houses and Residents
| Emeryville: | $683,469 |
| California: | $715,900 |
Total population: 11,227 (Urban population: 6,882, Rural population: 0)
Houses: 8,174 (7,360 occupied: 2,223 owner occupied, 5,143 renter occupied)
| % of renters here: | 70% |
| State: | 44% |
Housing density: 6,706 houses/condos per square mile
Median price asked for vacant for-sale houses and condos in 2022: $4,137,165.
Median contract rent in 2022: over $2,000 (lower quartile is over $2,000, upper quartile is over $2,000)
Median rent asked for vacant for-rent units in 2022: $3,838
Median gross rent in Emeryville, CA in 2022: over $2,000
Housing units in Emeryville with a mortgage: 1,463 (99 second mortgage, 13 home equity loan, 70 both second mortgage and home equity loan)
Houses without a mortgage: 0
Median household income for houses/condos with a mortgage: $195,785
Median household income for apartments without a mortgage: $85,313
Median monthly housing costs: $2,649
Compare current foreclosures in Emeryville, CA:
| Photo | Address | Area | Beds / Baths | Price | Details |
|---|---|---|---|---|---|

|
#1
Christie Ave
Emeryville, CA 94608
|
634 sq. feet
|
1 baths 1 beds |
$350,000
|
show details |

|
#2
Los Angeles St
Emeryville, CA 94608
|
803 sq. feet
|
1 baths 2 beds |
show details | |

|
#3
Overland Ave
Emeryville, CA 94608
|
- sq. feet
|
- baths - beds |
$52,950
|
show details |

|
#4
Adeline St
Emeryville, CA 94608
|
986 sq. feet
|
1 baths 3 beds |
show details | |

|
#5
San Pablo Ave
Emeryville, CA 94608
|
1,387 sq. feet
|
2 baths 3 beds |
show details | |

|
#6
Christie Ave Apt 1811
Emeryville, CA 94608
|
634 sq. feet
|
1 baths 1 beds |
show details | |

|
#7
61st St
Emeryville, CA 94608
|
880 sq. feet
|
1 baths 3 beds |
show details | |

|
#8
Christie Ave Apt 2116
Emeryville, CA 94608
|
1,369 sq. feet
|
2 baths 2 beds |
show details | |

|
#9
Apgar St
Emeryville, CA 94608
|
1,238 sq. feet
|
1 baths 3 beds |
show details | |

|
#10
Filbert St
Emeryville, CA 94608
|
1,358 sq. feet
|
2 baths 2 beds |
show details |
| Photo | Address | Area | Beds / Baths | Price | Details |
|---|---|---|---|---|---|

|
#11
Market St
Emeryville, CA 94608
|
2,242 sq. feet
|
2 baths 4 beds |
show details | |

|
#12
Union St
Emeryville, CA 94608
|
1,052 sq. feet
|
1 baths 3 beds |
show details | |

|
#13
Adeline St
Emeryville, CA 94608
|
1,483 sq. feet
|
1 baths 3 beds |
show details | |

|
#14
40th St Apt 2204
Emeryville, CA 94608
|
1,146 sq. feet
|
2 baths 2 beds |
show details | |

|
#15
Filbert St
Emeryville, CA 94608
|
1,358 sq. feet
|
2 baths 2 beds |
show details | |

|
#16
Chestnut St
Emeryville, CA 94608
|
1,306 sq. feet
|
1 baths 3 beds |
show details | |

|
#17
57th St
Emeryville, CA 94608
|
936 sq. feet
|
1 baths 3 beds |
show details | |

|
#18
62nd St
Emeryville, CA 94608
|
1,157 sq. feet
|
1 baths 2 beds |
show details | |

|
#19
Helen Ct
Emeryville, CA 94608
|
3,840 sq. feet
|
4 baths 8 beds |
show details | |

|
#20
31st St # B
Emeryville, CA 94608
|
1,948 sq. feet
|
4 baths 6 beds |
show details |
| Photo | Address | Area | Beds / Baths | Price | Details |
|---|---|---|---|---|---|

|
#21
Shellmound St Apt 6321
Emeryville, CA 94608
|
- sq. feet
|
- baths - beds |
show details | |

|
#22
52nd St
Emeryville, CA 94608
|
- sq. feet
|
- baths - beds |
show details | |

|
#23
56th St
Emeryville, CA 94608
|
- sq. feet
|
- baths - beds |
show details | |

|
#24
West St # A
Emeryville, CA 94608
|
- sq. feet
|
- baths - beds |
show details | |

|
#25
40th St Apt 236
Emeryville, CA 94608
|
- sq. feet
|
- baths - beds |
show details | |

|
#26
Hubbard St, Unit 523
Emeryville, CA 94608
|
- sq. feet
|
- baths - beds |
show details | |

|
#27
Stanford Ave
Emeryville, CA 94608
|
- sq. feet
|
- baths - beds |
show details | |

|
#28
Hollis St Ste 100
Emeryville, CA 94608
|
- sq. feet
|
- baths - beds |
show details | |

|
#29
Adeline St # 209
Emeryville, CA 94608
|
- sq. feet
|
- baths - beds |
show details | |

|
#30
Shellmound St, Apt 601
Emeryville, CA 94608
|
- sq. feet
|
- baths - beds |
show details |
| Photo | Address | Area | Beds / Baths | Price | Details |
|---|---|---|---|---|---|

|
#31
37th St Apt A
Emeryville, CA 94608
|
- sq. feet
|
- baths - beds |
show details | |

|
#32
42nd St
Emeryville, CA 94608
|
- sq. feet
|
- baths - beds |
show details | |

|
#33
Market St
Emeryville, CA 94608
|
- sq. feet
|
- baths - beds |
show details | |

|
#34
Essex St
Emeryville, CA 94608
|
- sq. feet
|
- baths - beds |
show details | |

|
#35
55th St
Emeryville, CA 94608
|
- sq. feet
|
- baths - beds |
show details | |

|
#36
San Pablo Ave
Emeryville, CA 94608
|
- sq. feet
|
- baths - beds |
show details | |

|
#37
Beaudry St
Emeryville, CA 94608
|
- sq. feet
|
- baths - beds |
show details | |

|
#38
Magnolia St
Emeryville, CA 94608
|
- sq. feet
|
- baths - beds |
show details | |

|
#39
32nd St
Emeryville, CA 94608
|
- sq. feet
|
- baths - beds |
show details | |

|
#40
Market St
Emeryville, CA 94608
|
- sq. feet
|
- baths - beds |
show details |
| Photo | Address | Area | Beds / Baths | Price | Details |
|---|---|---|---|---|---|

|
#41
Christie Ave Apt 2423
Emeryville, CA 94608
|
- sq. feet
|
- baths - beds |
show details | |

|
Check over 1 million property listings on Foreclosure.com!
|
browse all offers | |||

Latest news about housing in Emeryville, CA collected exclusively by city-data.com from local newspapers, TV, and radio stations

 | Where to live between Daly City and Emeryville? (21 replies) |
| Emeryville information (8 replies) |
| Do we underestimate and downplay how Great Sacramento weather really is? (4577 replies) |
| Housing near Emeryville (7 replies) |
| sanfransico - where to live for a commute under 40 minutes, buy a townhome/condo under 550K (20 replies) |
| Building a home in the surrounding SF area (17 replies) |

Median year apartment built: 1991
Household type by relationship:
Households: 12,571- Male householders: 3,815 (1,872 living alone), Female householders: 3,266 (1,751 living alone)
1,612 spouses (1,573 opposite-sex spouses), 659 unmarried partners, (555 opposite-sex unmarried partners), 1,287 children (1,251 natural, 36 adopted, 0 stepchildren), 0 grandchildren, 225 brothers or sisters, 264 parents, 10 foster children, 94 other relatives, 1,322 non-relatives
- In group quarters: 11
Size of family households: 1,587 2-persons, 629 3-persons, 115 4-persons, 20 5-persons, 15 6-persons, 5 7-or-more-persons.
Size of nonfamily households: 3,830 1-person, 1,055 2-persons, 255 3-persons, 7 4-persons, 32 7-or-more-persons.
533 married couples with children.
323 single-parent households (98 men, 225 women).
64.4% of residents of Emeryville speak English at home.
5.5% of residents speak Spanish at home (74% speak English very well, 16% speak English well, 10% speak English not well).
9.7% of residents speak other Indo-European language at home (69% speak English very well, 23% speak English well, 8% speak English not well).
18.0% of residents speak Asian or Pacific Island language at home (66% speak English very well, 24% speak English well, 6% speak English not well, 4% don't speak English at all).
1.9% of residents speak other language at home (88% speak English very well, 3% speak English well, 9% speak English not well).
Foreign born population: 4,275 (34.0%)
(44.8% of them are naturalized citizens)
| Here: | 3.6 |
| State: | 6.0 |
| Here: | 2.9 |
| State: | 3.9 |

- Bedrooms in owner-occupied houses and condos in Emeryville, California
- 254no bedroom
- 8511 bedroom
- 7122 bedrooms
- 3163 bedrooms
- 844 bedrooms
- 75+ bedrooms

- Bedrooms in renter-occupied apartments in Emeryville, California
- 832no bedroom
- 2,4791 bedroom
- 1,5252 bedrooms
- 2753 bedrooms
- 154 bedrooms
- 175+ bedrooms

- Cars and other vehicles available in Emeryville in owner-occupied houses/condos
- 205no vehicle
- 1,3941 vehicle
- 5612 vehicles
- 553 vehicles
- 84 vehicles
- 05+ vehicles

- Cars and other vehicles available in Emeryville in renter-occupied apartments
- 867no vehicle
- 2,9691 vehicle
- 1,0642 vehicles
- 1593 vehicles
- 374 vehicles
- 485+ vehicles

- Rooms in owner-occupied houses in Emeryville, California
- 2171 room
- 2582 rooms
- 5543 rooms
- 5754 rooms
- 2965 rooms
- 2026 rooms
- 607 rooms
- 468 rooms
- 159+ rooms

- Rooms in renter-occupied apartments in Emeryville, California
- 7541 room
- 1,1012 rooms
- 1,7143 rooms
- 8744 rooms
- 4855 rooms
- 1996 rooms
- 07 rooms
- 08 rooms
- 179+ rooms


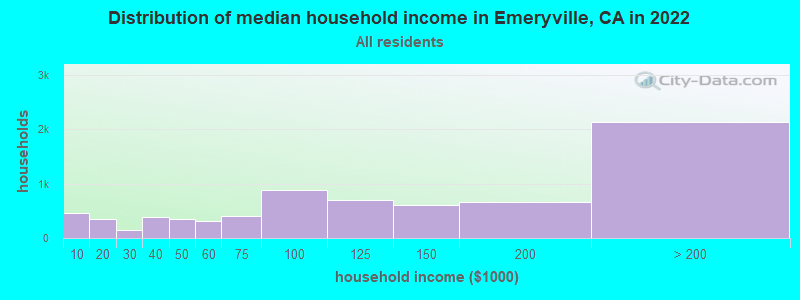
Emeryville, CA household income distribution

- 463Less than $10,000
- 346$10,000 to $19,999
- 147$20,000 to $29,999
- 395$30,000 to $39,999
- 342$40,000 to $49,999
- 317$50,000 to $59,999
- 408$60,000 to $74,999
- 875$75,000 to $99,999
- 697$100,000 to $124,999
- 607$125,000 to $149,999
- 657$150,000 to $199,999
- 2,133$200,000 or more
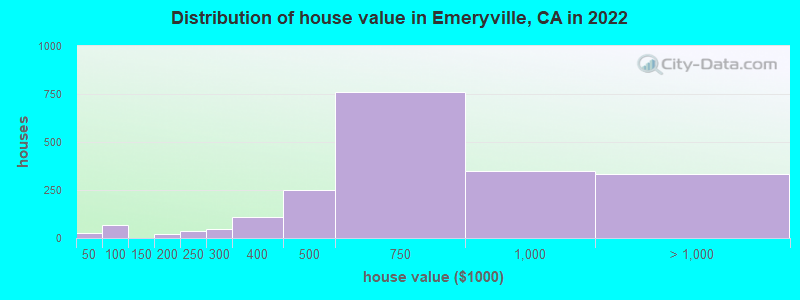
Home value of owner - occupied houses in 2022 in Emeryville, CA
-
- 12Less than $10,000
- 4$35,000 to $39,999
- 8$40,000 to $49,999
- 20$50,000 to $59,999
- 30$60,000 to $69,999
- 8$90,000 to $99,999
- 12$150,000 to $174,999
- 9$175,000 to $199,999
- 36$200,000 to $249,999
- 44$250,000 to $299,999
- 106$300,000 to $399,999
- 250$400,000 to $499,999
- 758$500,000 to $749,999
- 346$750,000 to $999,999
- 130$1,000,000 to $1,499,999
- 117$1,500,000 to $1,999,999
- 85$2,000,000 or more
Rent paid by renters in 2022 in Emeryville, CA
-
- 49$200 to $249
- 38$250 to $299
- 53$300 to $349
- 59$400 to $449
- 25$550 to $599
- 52$600 to $649
- 18$750 to $799
- 44$900 to $999
- 113$1,000 to $1,249
- 168$1,250 to $1,499
- 505$1,500 to $1,999
- 874$2,000 to $2,499
- 1,207$2,500 to $2,999
- 702$3,000 to $3,499
- 909$3,500 or more
- 79No cash rent


Percentage of workers working in this county: 69.0%
Number of people working at home: 3,518 (40.2% of all workers)
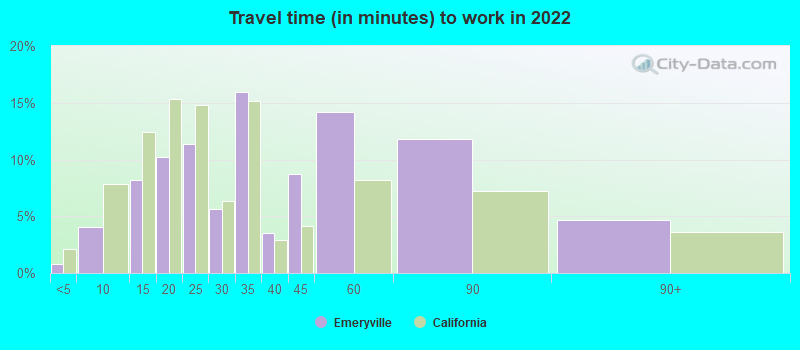
Travel time to work (commute)
- Less than 5 minutes: 93
- 5 to 9 minutes: 348
- 10 to 14 minutes: 471
- 15 to 19 minutes: 700
- 20 to 24 minutes: 888
- 25 to 29 minutes: 148
- 30 to 34 minutes: 815
- 35 to 39 minutes: 148
- 40 to 44 minutes: 472
- 45 to 59 minutes: 900
- 60 to 89 minutes: 467
- 90 or more minutes: 138
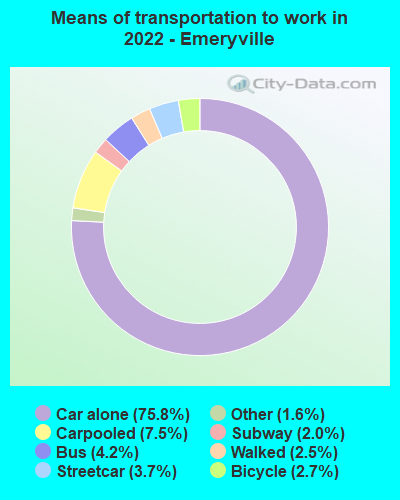
Means of transportation to work:
- Drove a car alone: 12,456 (60.6%)
- Carpooled: 1,289 (6.3%)
- Bus: 582 (2.8%)
- Subway or elevated rail: 479 (2.3%)
- Long-distance train or commuter rail: 268 (1.3%)
- Taxi: 275 (1.3%)
- Bicycle: 484 (2.4%)
- Walked: 408 (2.0%)
- Worked at home: 3,518 (17.1%)

- Unemployment by race in 2022
- Unemployment rate for White non-Hispanic residents
- 4.6%Males
- 3.7%Females
- Unemployment rate for Black residents
- 19.7%Males
- Unemployment rate for Asian residents
- 0.4%Males
- 2.4%Females
- Unemployment rate for other race residents
- 2.9%Males
- 15.5%Females
- Unemployment rate for two or more race residents
- 3.5%Males
- 2.1%Females
- Unemployment rate for Hispanic or Latino residents
- 6.2%Females

- Year of entry for the foreign-born population in Emeryville, California
- 2,3052010 or later
- 7352000 to 2009
- 8261990 to 1999
- 4791980 to 1989
- 3681970 to 1979
- 232Before 1970

First ancestries reported:
- Iranian: 343 (4.9%)
- German: 158 (2.3%)
- Italian: 143 (2.0%)
- American: 132 (1.9%)
- English: 96 (1.4%)
- Irish: 90 (1.3%)
- Northern European: 90 (1.3%)
- French: 88 (1.3%)
- European: 84 (1.2%)
- Ghanaian: 83 (1.2%)
- Ethiopian: 82 (1.2%)
- Romanian: 67 (1.0%)
- Polish: 61 (0.9%)
- British: 51 (0.7%)
- Belizean: 45 (0.6%)
- Haitian: 43 (0.6%)
- Hungarian: 39 (0.6%)
- Eastern European: 38 (0.5%)
- Russian: 38 (0.5%)
- Belgian: 29 (0.4%)
- African: 27 (0.4%)
- Slavic: 25 (0.4%)
- French Canadian: 22 (0.3%)
- Turkish: 22 (0.3%)
- Scottish: 21 (0.3%)
- Swedish: 20 (0.3%)
- Greek: 14 (0.2%)
- Celtic: 13 (0.2%)
- Dutch: 10 (0.1%)
- Trinidadian and Tobagonian: 10 (0.1%)
- Norwegian: 9 (0.1%)
- Jordanian: 8 (0.1%)
- Czech: 7 (0.1%)
- Egyptian: 5 (0.07%)
- Yugoslavian: 3 (0.04%)
Most common places of birth for foreign-born residents (%):
| Emeryville: | 20.9% (894) |
| California: | 6.6% (684,672) |
| Emeryville: | 12.9% (553) |
| California: | 5.2% (539,184) |
| Emeryville: | 8.1% (346) |
| California: | 3.0% (315,248) |
| Emeryville: | 7.6% (324) |
| California: | 2.0% (206,004) |
| Emeryville: | 5.4% (230) |
| California: | 1.7% (176,274) |
| Emeryville: | 3.8% (162) |
| California: | 37.2% (3,881,193) |
| Emeryville: | 3.8% (161) |
| California: | 0.2% (16,541) |
| Emeryville: | 3.5% (149) |
| California: | 0.1% (8,814) |
| Emeryville: | 3.3% (142) |
| California: | 4.9% (512,335) |
| Emeryville: | 2.7% (114) |
| California: | 1.2% (127,477) |
| Emeryville: | 2.6% (112) |
| California: | 0.6% (60,582) |
| Emeryville: | 2.6% (112) |
| California: | 0.4% (39,097) |
| Emeryville: | 2.6% (111) |
| California: | 0.4% (40,224) |
| Emeryville: | 1.9% (80) |
| California: | 0.7% (73,304) |
| Emeryville: | 1.7% (72) |
| California: | 7.8% (818,297) |
Place of birth for U.S.-born residents:
- This state: 4,159
- Other state: 3,873
- Northeast: 1,241
- Midwest: 1,119
- South: 969
- West: 543
74.2% of Emeryville residents lived in the same house 1 years ago.
Out of people who lived in different houses, 30.4% lived in this county.
Out of people who lived in different counties, 66.6% lived in California.
| Emeryville: | 74.2% |
| State average: | 88.9% |
Education attainment for males 25 years and older:
- No schooling: 76
- Nursery to 4th grade: 0
- 5th and 6th grade: 29
- 7th and 8th grade: 7
- 9th grade: 0
- 10th grade: 0
- 11th grade: 0
- 12th grade, no diploma: 22
- High school graduate (or equivalency): 314
- Less than 1 year of college: 142
- Some college more than 1 year, no degree: 611
- Associate degree: 244
- Bachelor's degree: 2,117
- Master's degree: 956
- Professional school degree: 215
- Doctorate degree: 474

Education attainment for females 25 years and older:
- No schooling: 46
- Nursery to 4th grade: 9
- 5th and 6th grade: 45
- 7th and 8th grade: 0
- 9th grade: 0
- 10th grade: 0
- 11th grade: 19
- 12th grade, no diploma: 34
- High school graduate (or equivalency): 319
- Less than 1 year of college: 122
- Some college more than 1 year, no degree: 342
- Associate degree: 346
- Bachelor's degree: 2,187
- Master's degree: 1,516
- Professional school degree: 347
- Doctorate degree: 318


Housing units in structures:
- One, detached: 609
- One, attached: 619
- Two: 194
- 3 or 4: 255
- 5 to 9: 385
- 10 to 19: 309
- 20 to 49: 719
- 50 or more: 5,055
- Mobile homes: 25
Housing units lacking complete kitchen facilities in 2022: 3.5%
House/condo owner moved in on average 7 years ago
Renter moved in on average 1 years ago

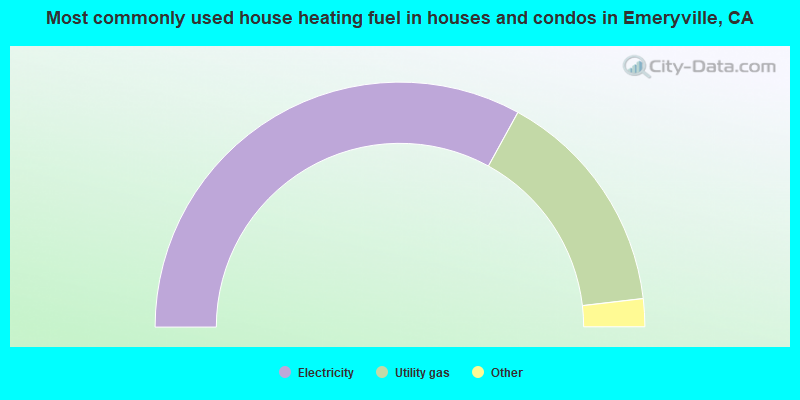
- 66.0%Electricity
- 30.3%Utility gas
- 1.4%Bottled, tank, or LP gas
- 1.3%No fuel used
- 0.5%Other fuel
- 0.4%Solar energy
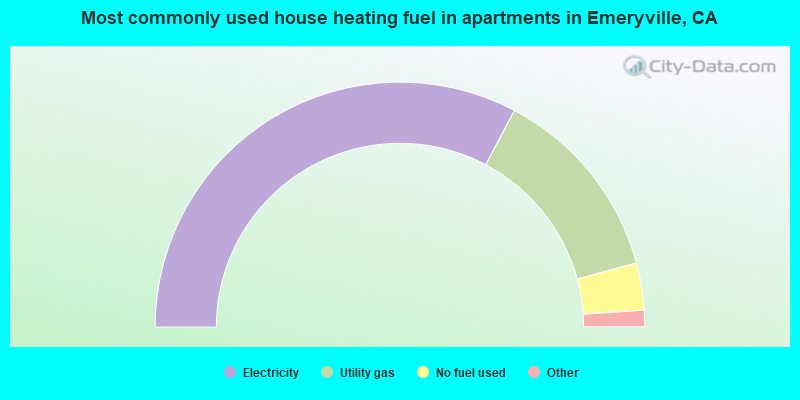
- 65.5%Electricity
- 26.1%Utility gas
- 6.2%No fuel used
- 1.6%Bottled, tank, or LP gas
- 0.4%Other fuel
Private vs. public school enrollment:
| Here: | 12.3% |
| California: | 10.5% |
| Here: | 0.0% |
| California: | 8.5% |
| Here: | 6.2% |
| California: | 15.9% |


