North Royalton, OH (Ohio) Houses and Residents
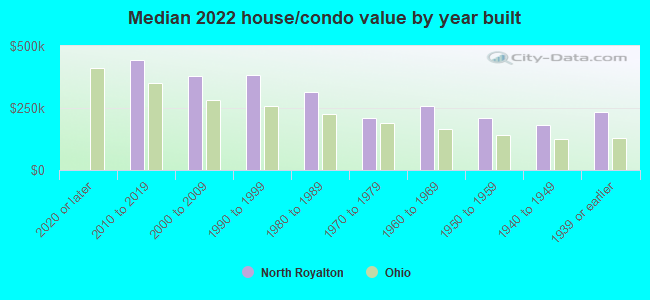
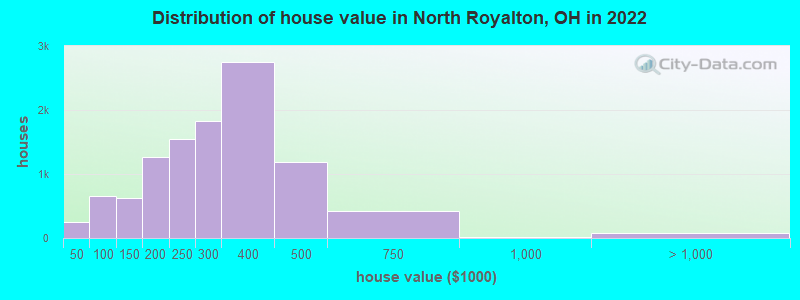
Estimated median house or condo value in 2022: $291,036 (it was $169,900 in 2000 )
North Royalton:
$291,036Ohio:
$204,100
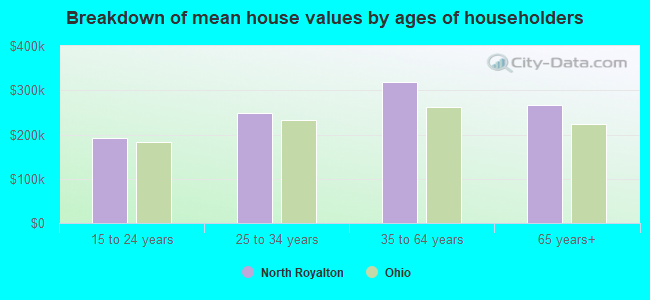
Lower value quartile - upper value quartile: $206,109 - $387,261Mean price in 2022: Detached houses: $335,544 Here:
$335,544State:
$254,366
Townhouses or other attached units: $169,994 Here:
$169,994State:
$225,733
In 3-to-4-unit structures: $144,043 Here:
$144,043State:
$203,002
In 5-or-more-unit structures: $113,129 Here:
$113,129State:
$211,593
Total population: 30,327 (Urban population: 27,358, Rural population: 1,290 (all nonfarm) )
Houses: 14,397 (13,524 occupied: 9,531 owner occupied, 4,071 renter occupied )
% of renters here:
30%State:
33%
Housing density: 676 houses/condos per square mile
Median price asked for vacant for-sale houses and condos in 2022: $226,022.
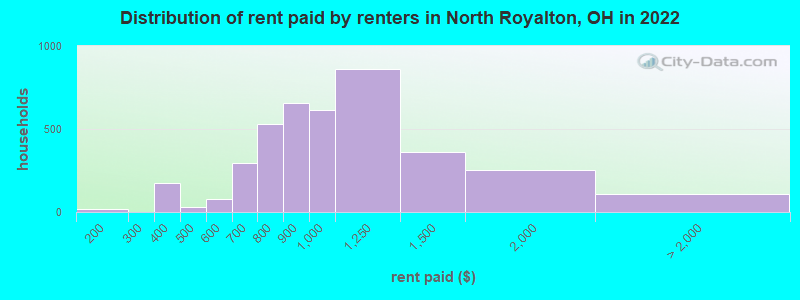
Median contract rent in 2022: $920 (lower quartile is $792, upper quartile is $1,174)
Median rent asked for vacant for-rent units in 2022: $1,397
Median gross rent in North Royalton, OH in 2022: $1,041
Housing units in North Royalton with a mortgage: 5,934 (1,140 second mortgage, 28 home equity loan, 1,097 both second mortgage and home equity loan )Houses without a mortgage: 415
Median household income for houses/condos with a mortgage: $118,648
Median household income for apartments without a mortgage: $72,905
Median monthly housing costs: $1,179
Data:
Median house or condo value ($)
Median house or condo value ($ change since 2000)
Median house or condo value ($) - White
Median house or condo value ($) - Black or African American
Median house or condo value ($) - Asian
Median house or condo value ($) - Hispanic or Latino
Median house or condo value ($) - American Indian and Alaska Native
Median house or condo value ($) - Multirace
Median house or condo value ($) - Other Race
Median price asked for mobile homes ($)
Household density (households per square mile)
Mean house or condo value by units in structure - 1, detached ($)
Mean house or condo value by units in structure - 1, attached ($)
Mean house or condo value by units in structure - 2 ($)
Mean house or condo value by units in structure by units in structure - 3 or 4 ($)
Mean house or condo value by units in structure - 5 or more ($)
Mean house or condo value by units in structure - Boat, RV, van, etc. ($)
Mean house or condo value by units in structure - Mobile home ($)
Median contract rent ($)
Median contract rent - Lower quartile ($)
Median contract rent - Upper quartile ($)
Median gross rent ($)
Urban houses (%)
Rural houses (%)
Houses occupied (%)
Houses occupied (% change since 2000)
Houses owner occupied (%)
Houses owner occupied (% change since 2000)
Houses renter occupied (%)
Houses renter occupied (% change since 2000)
Vacant housing units - For rent (%)
Vacant housing units - For rent (% change since 2000)
Vacant housing units - For sale only (%)
Vacant housing units - For sale only (% change since 2000)
Vacant housing units - Rented or sold, not occupied (%)
Vacant housing units - Rented or sold, not occupied (% change since 2000)
Vacant housing units - For seasonal, recreational, or occasional use (%)
Vacant housing units - For seasonal, recreational, or occasional use (% change since 2000)
Vacant housing units - For migrant workers (%)
Vacant housing units - For migrant workers (% change since 2000)
Vacant housing units - Other vacant (%)
Vacant housing units - Other vacant (% change since 2000)
Median monthly housing costs ($)
Median household income for houses/condos with a mortgage ($)
Median household income for houses/condos without a mortgage ($)
Median household income ($)
Median household income ($) - White
Median household income ($) - Black or African American
Median household income ($) - Asian
Median household income ($) - Hispanic or Latino
Median household income ($) - American Indian and Alaska Native
Median household income ($) - Multirace
Median household income ($) - Other Race
Mortgage status - with mortgage (%)
Mortgage status - with second mortgage (%)
Mortgage status - with home equity loan (%)
Mortgage status - with both second mortgage and home equity loan (%)
Mortgage status - without a mortgage (%)
Median year house/condo built
Median year apartment built
Household type by relationship - Male householder living alone (%)
Household type by relationship - Male householder not living alone (%)
Household type by relationship - Female householder living alone (%)
Household type by relationship - Female householder not living alone (%)
Household type by relationship - Opposite-Sex spouse (%)
Household type by relationship - Same-Sex spouse (%)
Household type by relationship - Opposite-Sex unmarried partner (%)
Household type by relationship - Same-Sex unmarried partner (%)
Household type by relationship - In group quarters (%)
Size of family households - 2-person household (%)
Size of family households - 3-person household (%)
Size of family households - 4-person household (%)
Size of family households - 5-person household (%)
Size of family households - 6-person household (%)
Size of family households - 7-or-more-person household (%)
Size of nonfamily households - 1-person household (%)
Size of nonfamily households - 2-person household (%)
Size of nonfamily households - 3-person household (%)
Size of nonfamily households - 4-person household (%)
Size of nonfamily households - 5-person household (%)
Size of nonfamily households - 6-person household (%)
Size of nonfamily households - 7-or-moreperson household (%)
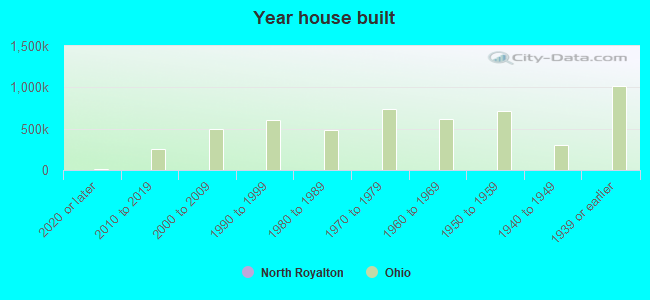
Year house built - Built 2010 or later (%)
Year house built - Built 2000 to 2009 (%)
Year house built - Built 1990 to 1999 (%)
Year house built - Built 1980 to 1989 (%)
Year house built - Built 1970 to 1979 (%)
Year house built - Built 1960 to 1969 (%)
Year house built - Built 1950 to 1959 (%)
Year house built - Built 1940 to 1949 (%)
Year house built - Built 1939 or earlier (%)
Median number of rooms in houses and condos
Median number of rooms in apartments
Median number of bedrooms in owner occupied houses
Mean number of bedrooms in owner occupied houses
Median number of bedrooms in renter occupied houses
Mean number of bedrooms in renter occupied houses
Median number of vehichles in owner occupied houses
Mean number of vehichles in owner occupied houses
Median number of vehichles in renter occupied houses
Mean number of vehichles in renter occupied houses
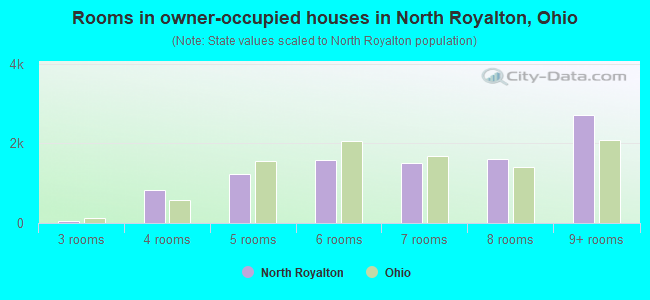
Rooms in owner-occupied houses - 1 room (%)
Rooms in owner-occupied houses - 2 rooms (%)
Rooms in owner-occupied houses - 3 rooms (%)
Rooms in owner-occupied houses - 4 rooms (%)
Rooms in owner-occupied houses - 5 rooms (%)
Rooms in owner-occupied houses - 6 rooms (%)
Rooms in owner-occupied houses - 7 rooms (%)
Rooms in owner-occupied houses - 8 rooms (%)
Rooms in owner-occupied houses - 9+ rooms (%)
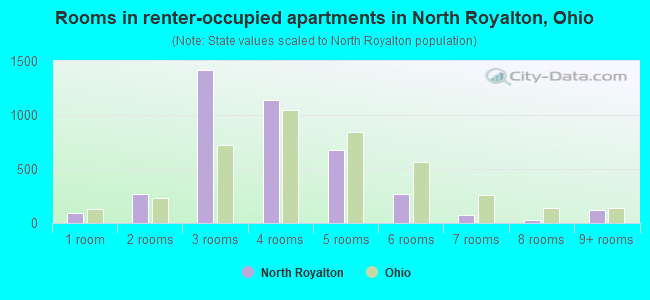
Rooms in renter-occupied houses - 1 room (%)
Rooms in renter-occupied houses - 2 rooms (%)
Rooms in renter-occupied houses - 3 rooms (%)
Rooms in renter-occupied houses - 4 rooms (%)
Rooms in renter-occupied houses - 5 rooms (%)
Rooms in renter-occupied houses - 6 rooms (%)
Rooms in renter-occupied houses - 7 rooms (%)
Rooms in renter-occupied houses - 8 rooms (%)
Rooms in renter-occupied houses - 9+ rooms (%)
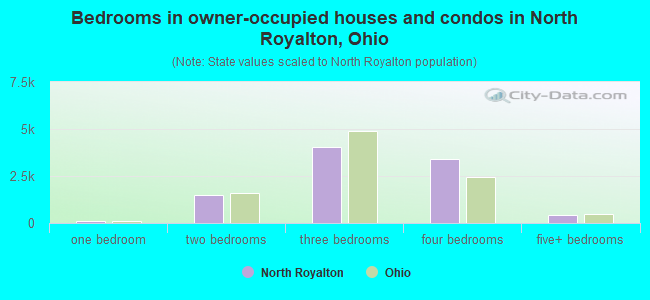
Bedrooms in owner-occupied houses - no bedrooms (%)
Bedrooms in owner-occupied houses - 1 bedroom (%)
Bedrooms in owner-occupied houses - 2 bedrooms (%)
Bedrooms in owner-occupied houses - 3 bedrooms (%)
Bedrooms in owner-occupied houses - 4 bedrooms (%)
Bedrooms in owner-occupied houses - 5+ bedrooms (%)
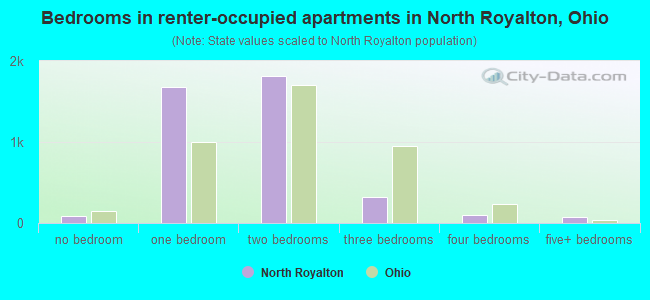
Bedrooms in renter-occupied houses - no bedrooms (%)
Bedrooms in renter-occupied houses - 1 bedroom (%)
Bedrooms in renter-occupied houses - 2 bedrooms (%)
Bedrooms in renter-occupied houses - 3 bedrooms (%)
Bedrooms in renter-occupied houses - 4 bedrooms (%)
Bedrooms in renter-occupied houses - 5+ bedrooms (%)
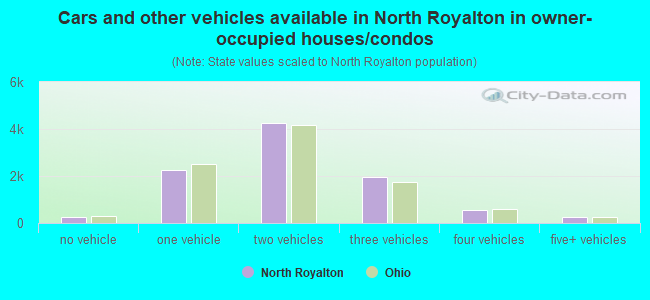
Vehicles available in owner-occupied houses - no vehicle available (%)
Vehicles available in owner-occupied houses - 1 vehicle available(%)
Vehicles available in owner-occupied houses - 2 Vehicles available (%)
Vehicles available in owner-occupied houses - 3 Vehicles available (%)
Vehicles available in owner-occupied houses - 4 Vehicles available (%)
Vehicles available in owner-occupied houses - 5+ Vehicles available (%)
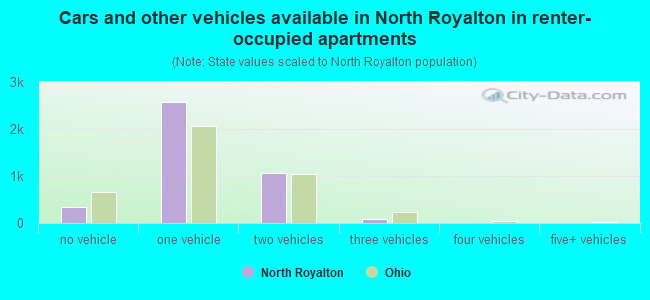
Vehicles available in renter-occupied houses - no vehicle available (%)
Vehicles available in renter-occupied houses - 1 vehicle available (%)
Vehicles available in renter-occupied houses - 2 Vehicles available (%)
Vehicles available in renter-occupied houses - 3 Vehicles available (%)
Vehicles available in renter-occupied houses - 4 Vehicles available (%)
Vehicles available in renter-occupied houses - 5+ Vehicles available (%)
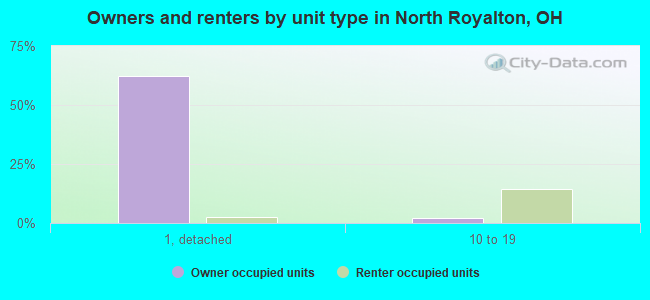
Housing units in structures - 1, detached (%)
Housing units in structures - 1, attached (%)
Housing units in structures - 2 (%)
Housing units in structures - 3 or 4 (%)
Housing units in structures - 5 to 9 (%)
Housing units in structures - 10 to 19 (%)
Housing units in structures - 20 to 49 (%)
Housing units in structures - 50 or more (%)
Housing units in structures - Mobile home (%)
Housing units in structures - Boat, RV, van, etc. (%)
Housing units in structures - Owners - 1, detached (%)
Housing units in structures - Owners - 1, attached (%)
Housing units in structures - Owners - 2 (%)
Housing units in structures - Owners - 3 or 4 (%)
Housing units in structures - Owners - 5 to 9 (%)
Housing units in structures - Owners - 10 to 19 (%)
Housing units in structures - Owners - 20 to 49 (%)
Housing units in structures - Owners - 50 or more (%)
Housing units in structures - Owners - Mobile home (%)
Housing units in structures - Owners - Boat, RV, van, etc. (%)
Housing units in structures - Renters - 1, detached (%)
Housing units in structures - Renters - 1, attached (%)
Housing units in structures - Renters - 2 (%)
Housing units in structures - Renters - 3 or 4 (%)
Housing units in structures - Renters - 5 to 9 (%)
Housing units in structures - Renters - 10 to 19 (%)
Housing units in structures - Renters - 20 to 49 (%)
Housing units in structures - Renters - 50 or more (%)
Housing units in structures - Renters - Mobile home (%)
Housing units in structures - Renters - Boat, RV, van, etc. (%)
House/condo owner moved in on average (years ago)
Renter moved in on average (years ago)
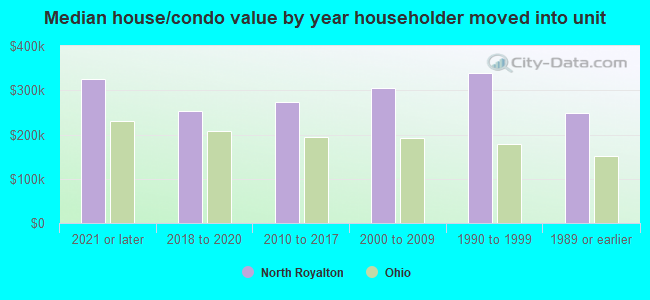
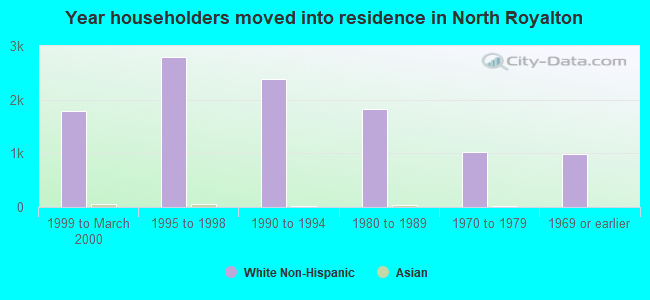
Year householder moved into unit - Moved in 1999 to March 2000 (%)
Year householder moved into unit - Moved in 1999 to March 2000 (%) - White
Year householder moved into unit - Moved in 1999 to March 2000 (%) - Black or African American
Year householder moved into unit - Moved in 1999 to March 2000 (%) - Asian
Year householder moved into unit - Moved in 1999 to March 2000 (%) - Hispanic or Latino
Year householder moved into unit - Moved in 1999 to March 2000 (%) - American Indian and Alaska Native
Year householder moved into unit - Moved in 1999 to March 2000 (%) - Multirace
Year householder moved into unit - Moved in 1999 to March 2000 (%) - Other Race
Year householder moved into unit - Moved in 1995 to 1998 (%)
Year householder moved into unit - Moved in 1995 to 1998 (%) - White
Year householder moved into unit - Moved in 1995 to 1998 (%) - Black or African American
Year householder moved into unit - Moved in 1995 to 1998 (%) - Asian
Year householder moved into unit - Moved in 1995 to 1998 (%) - Hispanic or Latino
Year householder moved into unit - Moved in 1995 to 1998 (%) - American Indian and Alaska Native
Year householder moved into unit - Moved in 1995 to 1998 (%) - Multirace
Year householder moved into unit - Moved in 1995 to 1998 (%) - Other Race
Year householder moved into unit - Moved in 1990 to 1994 (%)
Year householder moved into unit - Moved in 1990 to 1994 (%) - White
Year householder moved into unit - Moved in 1990 to 1994 (%) - Black or African American
Year householder moved into unit - Moved in 1990 to 1994 (%) - Asian
Year householder moved into unit - Moved in 1990 to 1994 (%) - Hispanic or Latino
Year householder moved into unit - Moved in 1990 to 1994 (%) - American Indian and Alaska Native
Year householder moved into unit - Moved in 1990 to 1994 (%) - Multirace
Year householder moved into unit - Moved in 1990 to 1994 (%) - Other Race
Year householder moved into unit - Moved in 1980 to 1989 (%)
Year householder moved into unit - Moved in 1980 to 1989 (%) - White
Year householder moved into unit - Moved in 1980 to 1989 (%) - Black or African American
Year householder moved into unit - Moved in 1980 to 1989 (%) - Asian
Year householder moved into unit - Moved in 1980 to 1989 (%) - Hispanic or Latino
Year householder moved into unit - Moved in 1980 to 1989 (%) - American Indian and Alaska Native
Year householder moved into unit - Moved in 1980 to 1989 (%) - Multirace
Year householder moved into unit - Moved in 1980 to 1989 (%) - Other Race
Year householder moved into unit - Moved in 1970 to 1979 (%)
Year householder moved into unit - Moved in 1970 to 1979 (%) - White
Year householder moved into unit - Moved in 1970 to 1979 (%) - Black or African American
Year householder moved into unit - Moved in 1970 to 1979 (%) - Asian
Year householder moved into unit - Moved in 1970 to 1979 (%) - Hispanic or Latino
Year householder moved into unit - Moved in 1970 to 1979 (%) - American Indian and Alaska Native
Year householder moved into unit - Moved in 1970 to 1979 (%) - Multirace
Year householder moved into unit - Moved in 1970 to 1979 (%) - Other Race
Year householder moved into unit - Moved in 1969 or earlier (%)
Year householder moved into unit - Moved in 1969 or earlier (%) - White
Year householder moved into unit - Moved in 1969 or earlier (%) - Black or African American
Year householder moved into unit - Moved in 1969 or earlier (%) - Asian
Year householder moved into unit - Moved in 1969 or earlier (%) - Hispanic or Latino
Year householder moved into unit - Moved in 1969 or earlier (%) - American Indian and Alaska Native
Year householder moved into unit - Moved in 1969 or earlier (%) - Multirace
Year householder moved into unit - Moved in 1969 or earlier (%) - Other Race
Housing units lacking complete plumbing facilities (%)
Housing units lacking complete kitchen facilities (%)
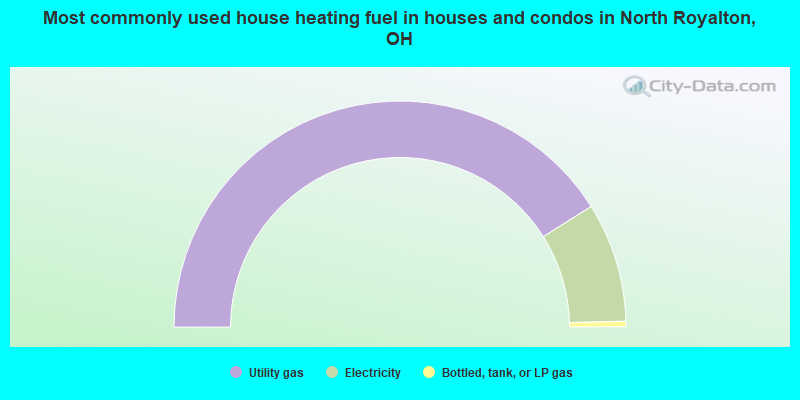
House heating fuel used in houses and condos - Utility gas (%)
House heating fuel used in houses and condos - Bottled, tank, or LP gas (%)
House heating fuel used in houses and condos - Electricity (%)
House heating fuel used in houses and condos - Fuel oil, kerosene, etc. (%)
House heating fuel used in houses and condos - Coal or coke (%)
House heating fuel used in houses and condos - Wood (%)
House heating fuel used in houses and condos - Solar energy (%)
House heating fuel used in houses and condos - Other fuel (%)
House heating fuel used in houses and condos - No fuel used (%)
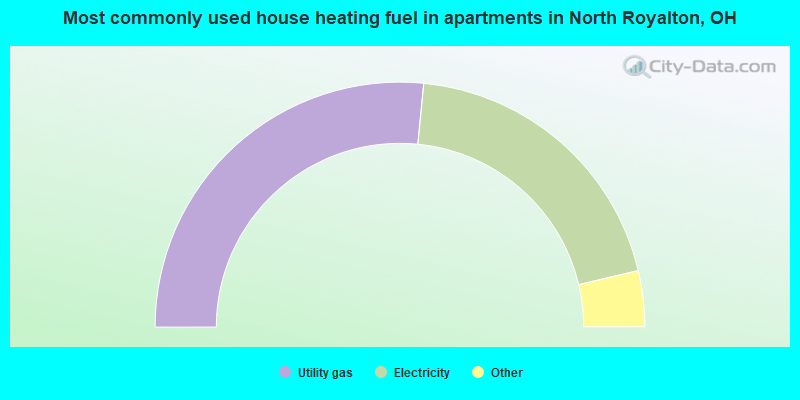
House heating fuel used in apartments - Utility gas (%)
House heating fuel used in apartments - Bottled, tank, or LP gas (%)
House heating fuel used in apartments - Electricity (%)
House heating fuel used in apartments - Fuel oil, kerosene, etc. (%)
House heating fuel used in apartments - Coal or coke (%)
House heating fuel used in apartments - Wood (%)
House heating fuel used in apartments - Solar energy (%)
House heating fuel used in apartments - Other fuel (%)
House heating fuel used in apartments - No fuel used (%)
Median year house/condo built: 1981Median year apartment built: 1986Household type by relationship:
Households: 30,610
Male householders: 6,673 (1,683 living alone ), Female householders: 6,645 (2,270 living alone )6,630 spouses (6,596 opposite-sex spouses ), 854 unmarried partners , (849 opposite-sex unmarried partners ), 7,526 children (7,161 natural , 207 adopted , 157 stepchildren ), 322 grandchildren , 452 brothers or sisters , 298 parents , 0 foster children , 388 other relatives , 478 non-relatives In group quarters: 339
Size of family households: 4,679 2-persons , 1,970 3-persons , 1,392 4-persons , 552 5-persons , 111 6-persons , 87 7-or-more-persons .
Size of nonfamily households: 3,982 1-person , 828 2-persons , 13 3-persons , 12 4-persons .
3,598 married couples with children. single-parent households (411 men , 808 women ).
84.7% of residents of North Royalton speak English at home. of residents speak Spanish at home (55% speak English very well , 15% speak English well , 30% speak English not well ).of residents speak other Indo-European language at home (66% speak English very well , 24% speak English well , 9% speak English not well ).of residents speak Asian or Pacific Island language at home (65% speak English very well , 33% speak English well , 2% speak English not well ).of residents speak other language at home (67% speak English very well , 26% speak English well , 8% speak English not well ).
Foreign born population: 3,620 (11.8%)of them are naturalized citizens )
Median number of rooms in houses and condos:
Median number of rooms in apartments
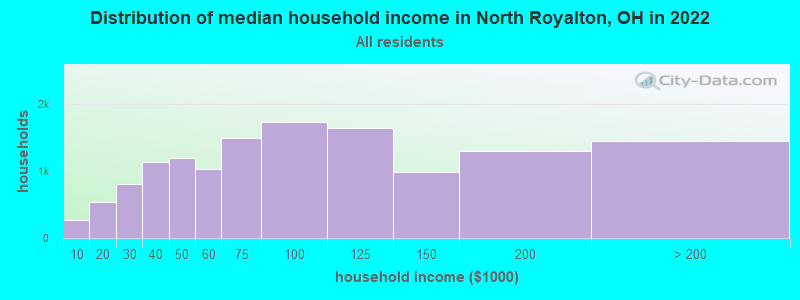
North Royalton, OH household income distribution 270 Less than $10,000536 $10,000 to $19,999811 $20,000 to $29,9991,140 $30,000 to $39,9991,196 $40,000 to $49,9991,030 $50,000 to $59,9991,498 $60,000 to $74,9991,733 $75,000 to $99,9991,637 $100,000 to $124,999988 $125,000 to $149,9991,303 $150,000 to $199,9991,447 $200,000 or more
Home value of owner - occupied houses in 2022 in North Royalton, OH 40 Less than $10,00028 $15,000 to $19,99913 $20,000 to $24,99912 $25,000 to $29,99913 $30,000 to $34,99928 $35,000 to $39,999107 $40,000 to $49,99974 $50,000 to $59,99918 $60,000 to $69,999167 $70,000 to $79,999154 $80,000 to $89,999127 $90,000 to $99,999361 $100,000 to $124,999260 $125,000 to $149,999546 $150,000 to $174,999715 $175,000 to $199,9991,545 $200,000 to $249,9991,831 $250,000 to $299,9992,750 $300,000 to $399,9991,191 $400,000 to $499,999422 $500,000 to $749,99912 $750,000 to $999,99924 $1,000,000 to $1,499,99949 $1,500,000 to $1,999,999Rent paid by renters in 2022 in North Royalton, OH 19 $100 to $14967 $300 to $349109 $350 to $39931 $400 to $44914 $500 to $54961 $550 to $599203 $600 to $64990 $650 to $699282 $700 to $749246 $750 to $799654 $800 to $899614 $900 to $999863 $1,000 to $1,249362 $1,250 to $1,499254 $1,500 to $1,99922 $3,000 to $3,4996 $3,500 or more80 No cash rent
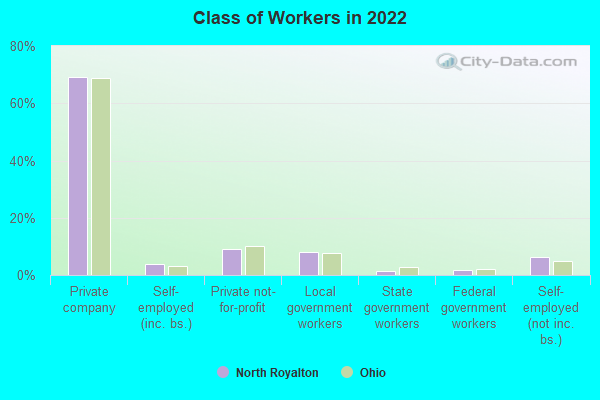
Percentage of workers working in this county: 83.4%Number of people working at home: 2,242 (13.5% of all workers )
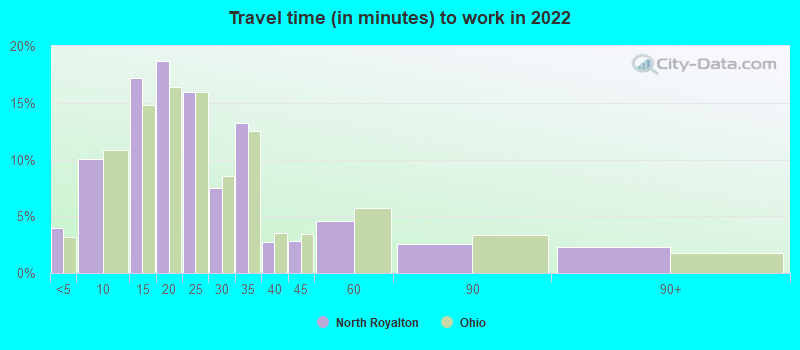
Travel time to work (commute)
Less than 5 minutes: 2935 to 9 minutes: 95510 to 14 minutes: 1,21815 to 19 minutes: 1,98320 to 24 minutes: 2,26125 to 29 minutes: 1,20430 to 34 minutes: 2,39035 to 39 minutes: 1,00440 to 44 minutes: 82445 to 59 minutes: 1,11660 to 89 minutes: 36490 or more minutes: 201
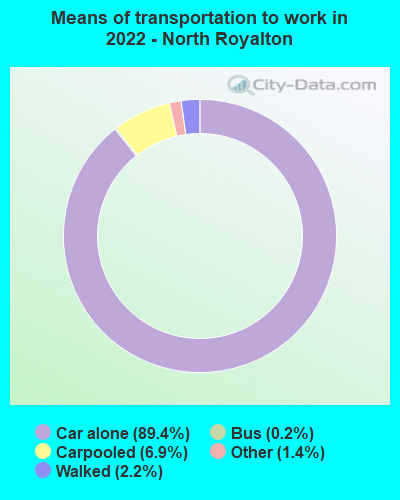
Means of transportation to work:
Drove a car alone: 5,649 (68.7%)Carpooled: 436 (5.3%)Bus : 8 (0.1%)Taxi: 91 (1.1%)Walked: 162 (2.0%)Worked at home: 2,242 (27.3%)
Unemployment by race in 2022
Unemployment rate for White non-Hispanic residents 2.2% Males2.4% FemalesUnemployment rate for Black residents 15.1% MalesUnemployment rate for Asian residents 4.5% Females
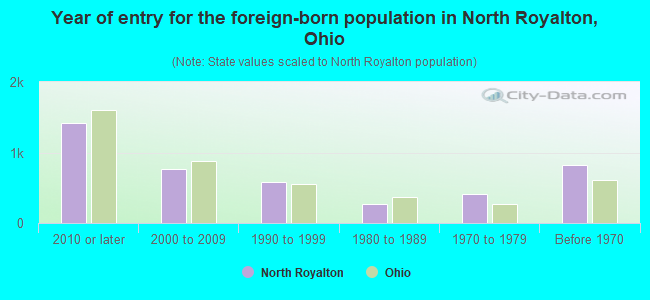
Year of entry for the foreign-born population in North Royalton, Ohio
1,415 2010 or later 769 2000 to 2009 586 1990 to 1999 269 1980 to 1989 409 1970 to 1979 825 Before 1970
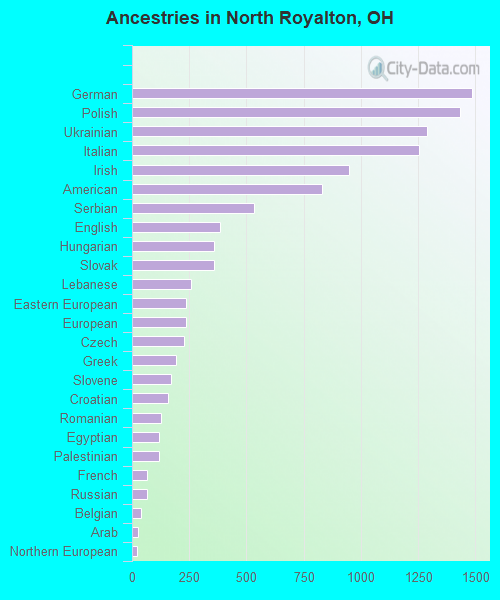
First ancestries reported:
German: 1,486 (10.3%)
Polish: 1,432 (9.9%)
Ukrainian: 1,288 (8.9%)
Italian: 1,254 (8.7%)
Irish: 949 (6.5%)
American: 832 (5.7%)
Serbian: 535 (3.7%)
English: 383 (2.6%)
Hungarian: 360 (2.5%)
Slovak: 360 (2.5%)
Lebanese: 257 (1.8%)
Eastern European: 238 (1.6%)
European: 238 (1.6%)
Czech: 229 (1.6%)
Greek: 191 (1.3%)
Slovene: 170 (1.2%)
Croatian: 157 (1.1%)
Romanian: 127 (0.9%)
Egyptian: 120 (0.8%)
Palestinian: 118 (0.8%)
French: 67 (0.5%)
Russian: 65 (0.4%)
Belgian: 38 (0.3%)
Arab: 25 (0.2%)
Northern European: 24 (0.2%)
Czechoslovakian: 24 (0.2%)
Welsh: 22 (0.2%)
Jordanian: 22 (0.2%)
Scotch-Irish: 21 (0.1%)
Albanian: 21 (0.1%)
British: 20 (0.1%)
Scottish: 20 (0.1%)
Lithuanian: 18 (0.1%)
Macedonian: 17 (0.1%)
Austrian: 14 (0.10%)
Swiss: 12 (0.08%)
Syrian: 10 (0.07%)
Finnish: 9 (0.06%)
Portuguese: 6 (0.04%)
Slavic: 4 (0.03%) Most common places of birth for foreign-born residents (%): Ukraine North Royalton:
21.0% (787)Ohio:
1.7% (9,564)
India North Royalton:
19.5% (732)Ohio:
11.6% (66,525)
Egypt North Royalton:
10.6% (398)Ohio:
0.8% (4,651)
Serbia North Royalton:
9.5% (356)Ohio:
0.3% (1,875)
Mexico North Royalton:
5.0% (189)Ohio:
7.8% (44,796)
Germany North Royalton:
2.9% (110)Ohio:
2.2% (12,846)
Romania North Royalton:
2.9% (109)Ohio:
1.1% (6,346)
Philippines North Royalton:
2.4% (89)Ohio:
3.1% (17,818)
Other Eastern Europe North Royalton:
2.2% (81)Ohio:
0.7% (4,155)
Vietnam North Royalton:
2.0% (75)Ohio:
1.9% (10,960)
Place of birth for U.S.-born residents:
This state: 22,862Other state: 3,781Northeast: 1,578Midwest: 637South: 1,083West: 496 88.7% of North Royalton residents lived in the same house 1 years ago.
Out of people who lived in different houses, 38.0% lived in this county.
Out of people who lived in different counties, 61.6% lived in Ohio.
North Royalton:
88.7%State average:
87.8%
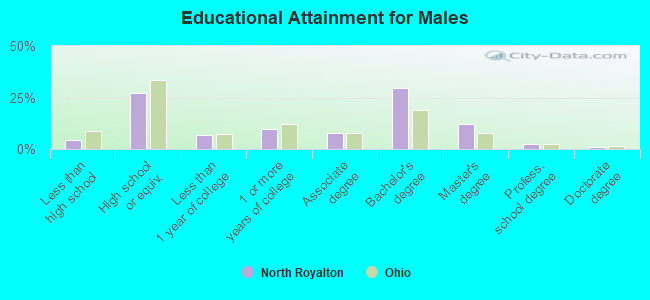
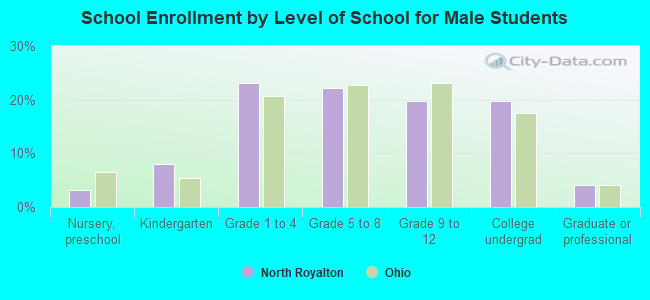
Education attainment for males 25 years and older:
No schooling: 128Nursery to 4th grade: 185th and 6th grade: 287th and 8th grade: 299th grade: 3310th grade: 3311th grade: 7712th grade, no diploma: 129High school graduate (or equivalency): 2,966Less than 1 year of college: 737Some college more than 1 year, no degree: 1,059Associate degree: 828Bachelor's degree: 3,254Master's degree: 1,317Professional school degree: 256Doctorate degree: 87
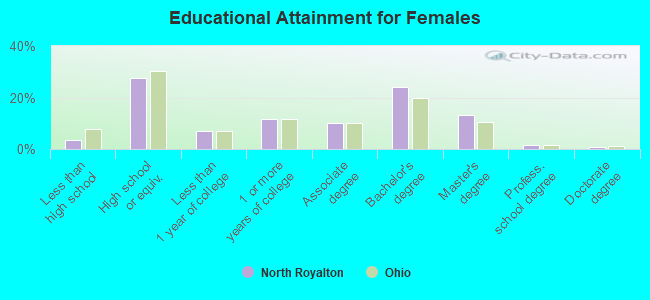
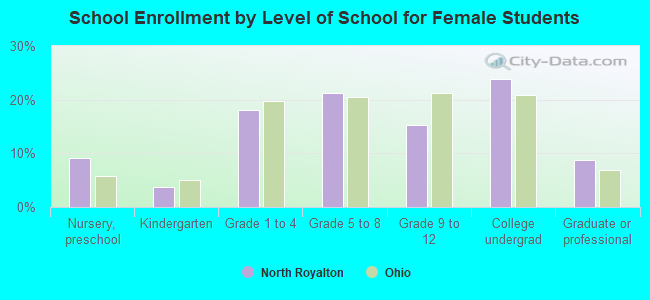
Education attainment for females 25 years and older:
No schooling: 52Nursery to 4th grade: 215th and 6th grade: 617th and 8th grade: 409th grade: 3810th grade: 2911th grade: 6812th grade, no diploma: 111High school graduate (or equivalency): 3,295Less than 1 year of college: 830Some college more than 1 year, no degree: 1,411Associate degree: 1,208Bachelor's degree: 2,892Master's degree: 1,598Professional school degree: 193Doctorate degree: 92
Housing units in structures:
One, detached: 8,596One, attached: 838Two: 953 or 4: 3565 to 9: 88310 to 19: 2,72020 to 49: 47850 or more: 415Mobile homes: 10Housing units lacking complete kitchen facilities in 2022: 1.6%House/condo owner moved in on average 13 years ago
Renter moved in on average 1 years ago
Private vs. public school enrollment:
Students in private schools in grades 1 to 8 (elementary and middle school): 520 Students in private schools in grades 9 to 12 (high school): 186 Students in private undergraduate colleges: 172