Races in Baton Rouge, Louisiana (LA) Detailed Stats
Data:
Races - White alone (%)
Races - White alone (% change since 2000)
Races - Black alone (%)
Races - Black alone (% change since 2000)
Races - American Indian alone (%)
Races - American Indian alone (% change since 2000)
Races - Asian alone (%)
Races - Asian alone (% change since 2000)
Races - Hispanic (%)
Races - Hispanic (% change since 2000)
Races - Native Hawaiian and Other Pacific Islander alone (%)
Races - Native Hawaiian and Other Pacific Islander alone (% change since 2000)
Races - Two or more races(%)
Races - Two or more races(% change since 2000)
Races - Other race alone (%)
Races - Other race alone (% change since 2000)
Racial diversity
Place of birth - Born in state of residence (%)
Place of birth - Born in state of residence (%) - White
Place of birth - Born in state of residence (%) - Black or African American
Place of birth - Born in state of residence (%) - Asian
Place of birth - Born in state of residence (%) - Hispanic or Latino
Place of birth - Born in state of residence (%) - American Indian and Alaska Native
Place of birth - Born in state of residence (%) - Multirace
Place of birth - Born in state of residence (%) - Other Race
Place of birth - Born in other state (%)
Place of birth - Born in other state (%) - White
Place of birth - Born in other state (%) - Black or African American
Place of birth - Born in other state (%) - Asian
Place of birth - Born in other state (%) - Hispanic or Latino
Place of birth - Born in other state (%) - American Indian and Alaska Native
Place of birth - Born in other state (%) - Multirace
Place of birth - Born in other state (%) - Other Race
Place of birth - Native, outside of US (%)
Place of birth - Native, outside of US (%) - White
Place of birth - Native, outside of US (%) - Black or African American
Place of birth - Native, outside of US (%) - Asian
Place of birth - Native, outside of US (%) - Hispanic or Latino
Place of birth - Native, outside of US (%) - American Indian and Alaska Native
Place of birth - Native, outside of US (%) - Multirace
Place of birth - Native, outside of US (%) - Other Race
Place of birth - Foreign born (%)
Place of birth - Foreign born (%) - White
Place of birth - Foreign born (%) - Black or African American
Place of birth - Foreign born (%) - Asian
Place of birth - Foreign born (%) - Hispanic or Latino
Place of birth - Foreign born (%) - American Indian and Alaska Native
Place of birth - Foreign born (%) - Multirace
Place of birth - Foreign born (%) - Other Race
Residents speaking English at home (%)
Residents speaking English at home - Born in the United States (%)
Residents speaking English at home - Native, born elsewhere (%)
Residents speaking English at home - Foreign born (%)
Residents speaking Spanish at home (%)
Residents speaking Spanish at home - Born in the United States (%)
Residents speaking Spanish at home - Native, born elsewhere (%)
Residents speaking Spanish at home - Foreign born (%)
Residents speaking other language at home (%)
Residents speaking other language at home - Born in the United States (%)
Residents speaking other language at home - Native, born elsewhere (%)
Residents speaking other language at home - Foreign born (%)
Marital status - Never married (%)
Marital status - Now married (%)
Marital status - Separated (%)
Marital status - Widowed (%)
Marital status - Divorced (%)
Ancestries Reported - Arab (%)
Ancestries Reported - Czech (%)
Ancestries Reported - Danish (%)
Ancestries Reported - Dutch (%)
Ancestries Reported - English (%)
Ancestries Reported - French (%)
Ancestries Reported - French Canadian (%)
Ancestries Reported - German (%)
Ancestries Reported - Greek (%)
Ancestries Reported - Hungarian (%)
Ancestries Reported - Irish (%)
Ancestries Reported - Italian (%)
Ancestries Reported - Lithuanian (%)
Ancestries Reported - Norwegian (%)
Ancestries Reported - Polish (%)
Ancestries Reported - Portuguese (%)
Ancestries Reported - Russian (%)
Ancestries Reported - Scotch-Irish (%)
Ancestries Reported - Scottish (%)
Ancestries Reported - Slovak (%)
Ancestries Reported - Subsaharan African (%)
Ancestries Reported - Swedish (%)
Ancestries Reported - Swiss (%)
Ancestries Reported - Ukrainian (%)
Ancestries Reported - United States (%)
Ancestries Reported - Welsh (%)
Ancestries Reported - West Indian (%)
Ancestries Reported - Other (%)
Geographical mobility - Same house 1 year ago (%)
Geographical mobility - Same house 1 year ago (%) - White
Geographical mobility - Same house 1 year ago (%) - Black or African American
Geographical mobility - Same house 1 year ago (%) - Asian
Geographical mobility - Same house 1 year ago (%) - Hispanic or Latino
Geographical mobility - Same house 1 year ago (%) - American Indian and Alaska Native
Geographical mobility - Same house 1 year ago (%) - Multirace
Geographical mobility - Same house 1 year ago (%) - Other Race
Geographical mobility - Moved within same county (%)
Geographical mobility - Moved within same county (%) - White
Geographical mobility - Moved within same county (%) - Black or African American
Geographical mobility - Moved within same county (%) - Asian
Geographical mobility - Moved within same county (%) - Hispanic or Latino
Geographical mobility - Moved within same county (%) - American Indian and Alaska Native
Geographical mobility - Moved within same county (%) - Multirace
Geographical mobility - Moved within same county (%) - Other Race
Geographical mobility - Moved from different county within same state (%)
Geographical mobility - Moved from different county within same state (%) - White
Geographical mobility - Moved from different county within same state (%) - Black or African American
Geographical mobility - Moved from different county within same state (%) - Asian
Geographical mobility - Moved from different county within same state (%) - Hispanic or Latino
Geographical mobility - Moved from different county within same state (%) - American Indian and Alaska Native
Geographical mobility - Moved from different county within same state (%) - Multirace
Geographical mobility - Moved from different county within same state (%) - Other Race
Geographical mobility - Moved from different state (%)
Geographical mobility - Moved from different state (%) - White
Geographical mobility - Moved from different state (%) - Black or African American
Geographical mobility - Moved from different state (%) - Asian
Geographical mobility - Moved from different state (%) - Hispanic or Latino
Geographical mobility - Moved from different state (%) - American Indian and Alaska Native
Geographical mobility - Moved from different state (%) - Multirace
Geographical mobility - Moved from different state (%) - Other Race
Geographical mobility - Moved from abroad (%)
Geographical mobility - Moved from abroad (%) - White
Geographical mobility - Moved from abroad (%) - Black or African American
Geographical mobility - Moved from abroad (%) - Asian
Geographical mobility - Moved from abroad (%) - Hispanic or Latino
Geographical mobility - Moved from abroad (%) - American Indian and Alaska Native
Geographical mobility - Moved from abroad (%) - Multirace
Geographical mobility - Moved from abroad (%) - Other Race
Place of birth for the foreign-born population - Ireland (%)
Place of birth for the foreign-born population - Denmark (%)
Place of birth for the foreign-born population - Norway (%)
Place of birth for the foreign-born population - Sweden (%)
Place of birth for the foreign-born population - United Kingdom (%)
Place of birth for the foreign-born population - England (%)
Place of birth for the foreign-born population - Scotland (%)
Place of birth for the foreign-born population - Other Northern Europe (%)
Place of birth for the foreign-born population - Austria (%)
Place of birth for the foreign-born population - Belgium (%)
Place of birth for the foreign-born population - France (%)
Place of birth for the foreign-born population - Germany (%)
Place of birth for the foreign-born population - Netherlands (%)
Place of birth for the foreign-born population - Switzerland (%)
Place of birth for the foreign-born population - Other Western Europe (%)
Place of birth for the foreign-born population - Greece (%)
Place of birth for the foreign-born population - Italy (%)
Place of birth for the foreign-born population - Portugal (%)
Place of birth for the foreign-born population - Spain (%)
Place of birth for the foreign-born population - Other Southern Europe (%)
Place of birth for the foreign-born population - Albania (%)
Place of birth for the foreign-born population - Belarus (%)
Place of birth for the foreign-born population - Bosnia and Herzegovina (%)
Place of birth for the foreign-born population - Bulgaria (%)
Place of birth for the foreign-born population - Croatia (%)
Place of birth for the foreign-born population - Czechoslovakia (%)
Place of birth for the foreign-born population - Hungary (%)
Place of birth for the foreign-born population - Latvia (%)
Place of birth for the foreign-born population - Lithuania (%)
Place of birth for the foreign-born population - North Macedonia (Macedonia) (%)
Place of birth for the foreign-born population - Moldova (%)
Place of birth for the foreign-born population - Poland (%)
Place of birth for the foreign-born population - Romania (%)
Place of birth for the foreign-born population - Russia (%)
Place of birth for the foreign-born population - Serbia (%)
Place of birth for the foreign-born population - Ukraine (%)
Place of birth for the foreign-born population - Other Eastern Europe (%)
Place of birth for the foreign-born population - China (%)
Place of birth for the foreign-born population - Hong Kong (%)
Place of birth for the foreign-born population - Taiwan (%)
Place of birth for the foreign-born population - Japan (%)
Place of birth for the foreign-born population - Korea (%)
Place of birth for the foreign-born population - Other Eastern Asia (%)
Place of birth for the foreign-born population - Afghanistan (%)
Place of birth for the foreign-born population - Bangladesh (%)
Place of birth for the foreign-born population - India (%)
Place of birth for the foreign-born population - Iran (%)
Place of birth for the foreign-born population - Kazakhstan (%)
Place of birth for the foreign-born population - Nepal (%)
Place of birth for the foreign-born population - Pakistan (%)
Place of birth for the foreign-born population - Sri Lanka (%)
Place of birth for the foreign-born population - Uzbekistan (%)
Place of birth for the foreign-born population - Other South Central Asia (%)
Place of birth for the foreign-born population - Burma (%)
Place of birth for the foreign-born population - Cambodia (%)
Place of birth for the foreign-born population - Indonesia (%)
Place of birth for the foreign-born population - Laos (%)
Place of birth for the foreign-born population - Malaysia (%)
Place of birth for the foreign-born population - Philippines (%)
Place of birth for the foreign-born population - Singapore (%)
Place of birth for the foreign-born population - Thailand (%)
Place of birth for the foreign-born population - Vietnam (%)
Place of birth for the foreign-born population - Other South Eastern Asia (%)
Place of birth for the foreign-born population - Armenia (%)
Place of birth for the foreign-born population - Iraq (%)
Place of birth for the foreign-born population - Israel (%)
Place of birth for the foreign-born population - Jordan (%)
Place of birth for the foreign-born population - Kuwait (%)
Place of birth for the foreign-born population - Lebanon (%)
Place of birth for the foreign-born population - Saudi Arabia (%)
Place of birth for the foreign-born population - Syria (%)
Place of birth for the foreign-born population - Turkey (%)
Place of birth for the foreign-born population - Yemen (%)
Place of birth for the foreign-born population - Other Western Asia (%)
Place of birth for the foreign-born population - Eritrea (%)
Place of birth for the foreign-born population - Ethiopia (%)
Place of birth for the foreign-born population - Kenya (%)
Place of birth for the foreign-born population - Somalia (%)
Place of birth for the foreign-born population - Uganda (%)
Place of birth for the foreign-born population - Zimbabwe (%)
Place of birth for the foreign-born population - Other Eastern Africa (%)
Place of birth for the foreign-born population - Cameroon (%)
Place of birth for the foreign-born population - Congo (%)
Place of birth for the foreign-born population - Democratic Republic of Congo (Zaire) (%)
Place of birth for the foreign-born population - Other Middle Africa (%)
Place of birth for the foreign-born population - Egypt (%)
Place of birth for the foreign-born population - Morocco (%)
Place of birth for the foreign-born population - Sudan (%)
Place of birth for the foreign-born population - Other Northern Africa (%)
Place of birth for the foreign-born population - South Africa (%)
Place of birth for the foreign-born population - Other Southern Africa (%)
Place of birth for the foreign-born population - Cabo Verde (%)
Place of birth for the foreign-born population - Ghana (%)
Place of birth for the foreign-born population - Liberia (%)
Place of birth for the foreign-born population - Nigeria (%)
Place of birth for the foreign-born population - Senegal (%)
Place of birth for the foreign-born population - Sierra Leone (%)
Place of birth for the foreign-born population - Other Western Africa (%)
Place of birth for the foreign-born population - Australia (%)
Place of birth for the foreign-born population - New Zealand (%)
Place of birth for the foreign-born population - Fiji (%)
Place of birth for the foreign-born population - Micronesia (%)
Place of birth for the foreign-born population - Bahamas (%)
Place of birth for the foreign-born population - Barbados (%)
Place of birth for the foreign-born population - Cuba (%)
Place of birth for the foreign-born population - Dominica (%)
Place of birth for the foreign-born population - Dominican Republic (%)
Place of birth for the foreign-born population - Grenada (%)
Place of birth for the foreign-born population - Haiti (%)
Place of birth for the foreign-born population - Jamaica (%)
Place of birth for the foreign-born population - St. Vincent and the Grenadines (%)
Place of birth for the foreign-born population - Trinidad and Tobago (%)
Place of birth for the foreign-born population - West Indies (%)
Place of birth for the foreign-born population - Other Caribbean (%)
Place of birth for the foreign-born population - Belize (%)
Place of birth for the foreign-born population - Costa Rica (%)
Place of birth for the foreign-born population - El Salvador (%)
Place of birth for the foreign-born population - Guatemala (%)
Place of birth for the foreign-born population - Honduras (%)
Place of birth for the foreign-born population - Mexico (%)
Place of birth for the foreign-born population - Nicaragua (%)
Place of birth for the foreign-born population - Panama (%)
Place of birth for the foreign-born population - Other Central America (%)
Place of birth for the foreign-born population - Argentina (%)
Place of birth for the foreign-born population - Bolivia (%)
Place of birth for the foreign-born population - Brazil (%)
Place of birth for the foreign-born population - Chile (%)
Place of birth for the foreign-born population - Colombia (%)
Place of birth for the foreign-born population - Ecuador (%)
Place of birth for the foreign-born population - Guyana (%)
Place of birth for the foreign-born population - Peru (%)
Place of birth for the foreign-born population - Uruguay (%)
Place of birth for the foreign-born population - Venezuela (%)
Place of birth for the foreign-born population - Other South America (%)
Place of birth for the foreign-born population - Canada (%)
Place of birth for the foreign-born population - Other Northern America (%)
Place of birth for the foreign-born population - Other (%)
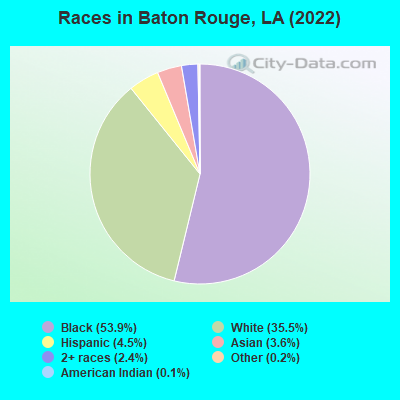
According to 2022 data, the most numerous races in Baton Rouge, LA are White alone (78,623 residents), Black alone (119,280 residents), and Hispanic (9,899 residents). 91.1% of Baton Rouge residents speak English at home. 6.5% of Baton Rouge, LA residents are foreign-born (3.3% born in Asia, 1.9% born in Latin America), which is 38.2% greater than the foreign-born rate of 4.0% across the entire state of Louisiana.
Race distribution in Baton Rouge
2000 2022
113,478 49.8% Black alone 101,867 44.7% White alone 5,940 2.6% Asian alone 3,918 1.7% Hispanic 1,918 0.8% Two or more races 376 0.2% American Indian alone 253 0.1% Other race alone 68 0.03% Native Hawaiian and Other
119,280 53.9% Black alone 78,623 35.5% White alone 9,899 4.5% Hispanic 7,871 3.6% Asian alone 5,206 2.4% Two or more races 340 0.2% Other race alone 232 0.1% American Indian alone
2000 2022
2,794,391 62.5% White alone 1,443,390 32.3% Black alone 107,738 2.4% Hispanic 54,256 1.2% Asian alone 39,260 0.9% Two or more races 24,129 0.5% American Indian alone 4,736 0.1% Other race alone 1,076 0.02% Native Hawaiian and Other
2,603,221 56.7% White alone 1,420,055 30.9% Black alone 262,213 5.7% Hispanic 183,270 4.0% Two or more races 81,169 1.8% Asian alone 19,991 0.4% American Indian alone 18,043 0.4% Other race alone 2,279 0.05% Native Hawaiian and Other
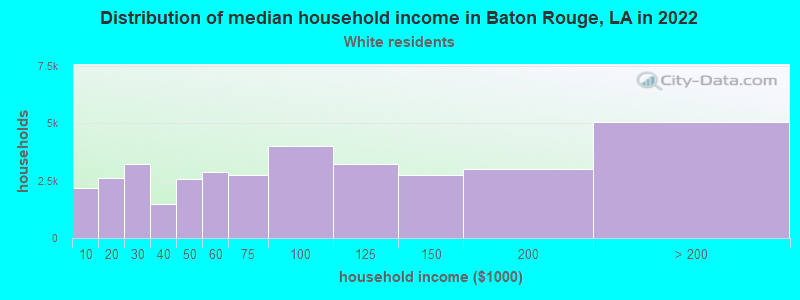
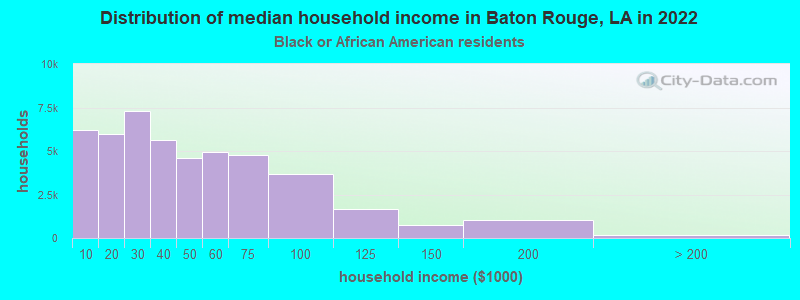
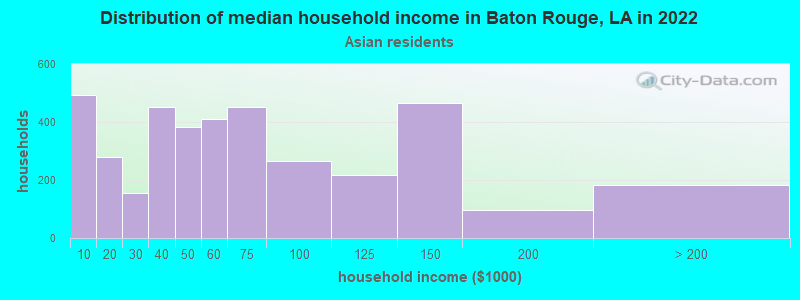
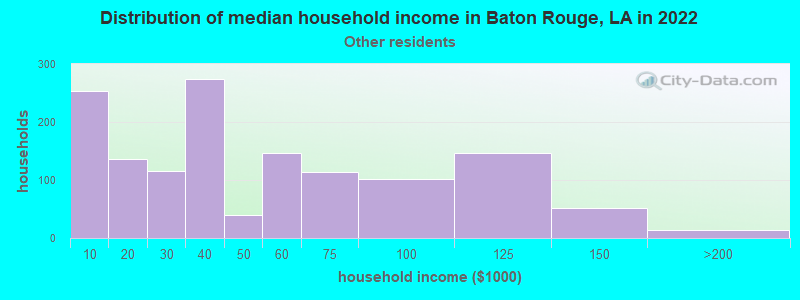
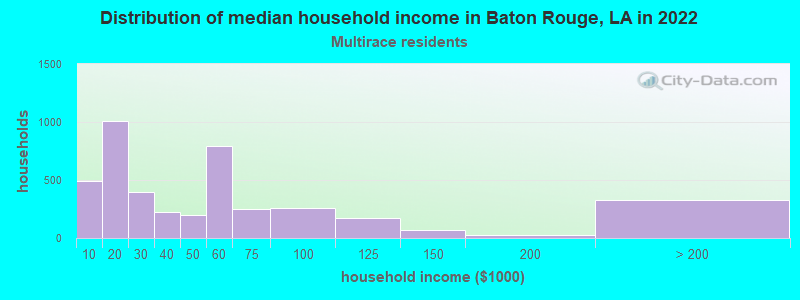
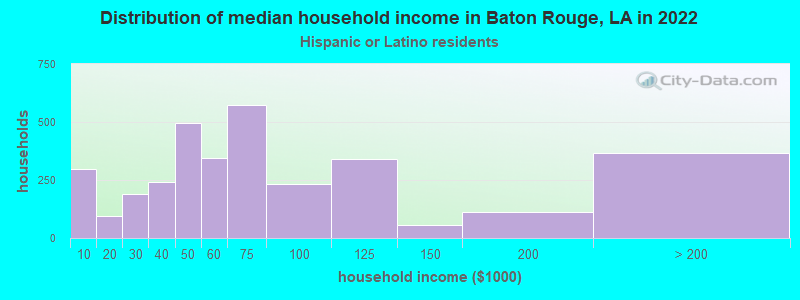
Income and house value in Baton Rouge Median household income in 2022 $76,290 White non-Hispanic householders$35,866 Black householders$57,922 Asian householders$63,282 Some other race householders$90,461 Two or more races householders$62,944 Hispanic or Latino race householdersMedian 2022 house value $300,833 White Non-Hispanic householders$136,786 Black or African American householders$213,985 American Indian or Alaska Native householders $271,160 Asian householders$146,436 Some other race householders$197,821 Two or more races householders$217,121 Hispanic or Latino householders
Median age by race in Baton Rouge
33.5 Median age for White residents33.2 34.3 30.1 Median age for Black or African American residents26.5 33.9 37.6 Median age for American Indian / Alaska Native residents37.4 59.3 36.8 Median age for Asian residents41.6 33.9 -666,666,666.0 Median age for Native Hawaiian / Pacific Islander residents-666,666,666.0 -666,666,666.0 23.0 Median age for Other race residents23.4 22.2 22.3 Median age for Two or more races residents21.8 24.3 33.4 Median age for White alone residents33.1 34.6 23.7 Median age for Hispanic or Latino residents26.3 23.4
Owner/renter occupied households by race in Baton Rouge
House owners and renters - White residents 20,766 58.0% Owner occupied15,066 42.0% Renter occupiedHouse owners and renters - Black or African American residents 15,807 33.9% Owner occupied30,859 66.1% Renter occupiedHouse owners and renters - American Indian / Alaska Native residents 58 52.8% Owner occupied52 47.2% Renter occupiedHouse owners and renters - Asian residents 2,098 65.1% Owner occupied1,125 34.9% Renter occupiedHouse owners and renters - Other race residents 335 19.1% Owner occupied1,418 80.9% Renter occupiedHouse owners and renters - Two or more races residents 1,189 72.9% Owner occupied441 27.1% Renter occupiedHouse owners and renters - White alone residents 20,366 58.2% Owner occupied14,631 41.8% Renter occupiedHouse owners and renters - Hispanic or Latino residents 1,263 40.1% Owner occupied1,883 59.9% Renter occupied
Language usage in Baton Rouge
English speakers - Total 91.1% of residents of Baton Rouge speak English at home.
3.1% of residents speak Spanish at home 1,704 26.9% Speak English very well4,642 73.1% Speak English less than very well5.9% of residents speak other language at home 6,846 56.6% Speak English very well5,244 43.4% Speak English less than very well
English speakers - Born in the United States 97.9% of residents of Baton Rouge speak English at home.
1.1% of residents speak Spanish at home 417 100.0% Speak English very well1.0% of residents speak other language at home 208 54.6% Speak English very well173 45.4% Speak English less than very well
English speakers - Native, born elsewhere 58.5% of residents of Baton Rouge speak English at home.
9.5% of residents speak Spanish at home 97 100.0% Speak English very well32.0% of residents speak other language at home 295 90.8% Speak English very well30 9.2% Speak English less than very well
English speakers - Foreign-born 9.9% of residents of Baton Rouge speak English at home.
33.4% of residents speak Spanish at home 839 16.1% Speak English very well4,374 83.9% Speak English less than very well56.7% of residents speak other language at home 4,148 46.9% Speak English very well4,688 53.1% Speak English less than very well
White (Caucasian) - Speak only English Native:
97.9% (71,183)Foreign-born:
16.9% (690)
White (Caucasian) - Speak another language Native:
2.1% (1,554)Foreign-born:
83.1% (3,396)
Black or African American - Speak only English Native:
99.0% (108,412)Foreign-born:
13.0% (144)
Black or African American - Speak another language Native:
1.0% (1,135)Foreign-born:
86.1% (951)
American Indian / Alaska Native - Speak another language Native:
19.9% (67)Foreign-born:
100.0% (33)
Asian - Speak only English Native:
43.3% (999)Foreign-born:
11.1% (620)
Asian - Speak another language Native:
56.7% (1,306)Foreign-born:
88.9% (4,946)
Other race - Speak only English Native:
76.3% (1,118)Foreign-born:
0.6% (18)
Other race - Speak another language Native:
28.0% (411)Foreign-born:
100.0% (3,071)
Two or more races - Speak only English Native:
88.4% (6,555)Foreign-born:
13.8% (233)
Two or more races - Speak another language Native:
11.8% (876)Foreign-born:
85.6% (1,448)
White alone - Speak only English Native:
98.0% (70,596)Foreign-born:
18.8% (654)
White alone - Speak another language Native:
2.0% (1,457)Foreign-born:
81.2% (2,831)
Hispanic or Latino - Speak only English Native:
82.4% (2,484)Foreign-born:
2.7% (140)
Hispanic or Latino - Speak another language Native:
17.6% (529)Foreign-born:
97.3% (5,130)
Foreign-born residents in Baton Rouge 14,471 residents are foreign born (3.3% Asia , 1.9% Latin America ).
This city:
6.5%Louisiana:
4.2%
Marital status for residents in Baton Rouge Marital status - White (Caucasian) population 15 years and over
Males 49.0% Never married41.4% Now married0.7% Separated2.8% Widowed6.1% DivorcedFemales 42.1% Never married38.2% Now married1.9% Separated10.1% Widowed7.6% DivorcedWomen who gave birth in the past 12 months Now married:
100.0% (255)Unmarried:
0.0% (0)
Women who did not give birth in the past 12 months Now married:
32.5% (7,313)Unmarried:
67.5% (15,223)
Marital status - Black or African American population 15 years and over
Males 67.6% Never married19.9% Now married1.7% Separated1.8% Widowed9.0% DivorcedFemales 58.8% Never married16.4% Now married3.1% Separated8.2% Widowed13.6% DivorcedWomen who gave birth in the past 12 months Now married:
3.8% (76)Unmarried:
96.2% (1,949)
Women who did not give birth in the past 12 months Now married:
9.0% (2,815)Unmarried:
91.0% (28,498)
Marital status - American Indian / Alaska Native population 15 years and over
Males 31.6% Never married21.4% Now married0.0% Separated0.0% Widowed47.0% DivorcedFemales 39.3% Never married38.8% Now married0.0% Separated0.9% Widowed21.0% DivorcedWomen who did not give birth in the past 12 months Now married:
32.6% (35)Unmarried:
67.4% (72)
Marital status - Asian population 15 years and over
Males 58.0% Never married40.3% Now married0.0% Separated0.3% Widowed1.4% DivorcedFemales 37.9% Never married49.1% Now married0.0% Separated6.0% Widowed7.0% DivorcedWomen who did not give birth in the past 12 months Now married:
44.2% (1,325)Unmarried:
55.8% (1,672)
Marital status - Other race population 15 years and over
Males 60.0% Never married30.6% Now married1.6% Separated1.0% Widowed6.8% DivorcedFemales 55.6% Never married32.3% Now married2.4% Separated4.1% Widowed5.5% DivorcedWomen who gave birth in the past 12 months Now married:
46.2% (24)Unmarried:
53.8% (28)
Women who did not give birth in the past 12 months Now married:
30.2% (501)Unmarried:
69.8% (1,158)
Marital status - Two or more races population 15 years and over
Males 40.4% Never married52.6% Now married0.4% Separated0.0% Widowed6.6% DivorcedFemales 47.8% Never married40.8% Now married0.0% Separated6.1% Widowed5.3% DivorcedWomen who gave birth in the past 12 months Now married:
100.0% (18)Unmarried:
0.0% (0)
Women who did not give birth in the past 12 months Now married:
24.9% (978)Unmarried:
75.1% (2,956)
Marital status - White alone, not Hispanic / Latino population 15 years and over
Males 49.3% Never married41.4% Now married0.7% Separated2.7% Widowed5.9% DivorcedFemales 41.5% Never married38.5% Now married2.0% Separated10.4% Widowed7.6% DivorcedWomen who gave birth in the past 12 months Now married:
100.0% (255)Unmarried:
0.0% (0)
Women who did not give birth in the past 12 months Now married:
33.1% (7,254)Unmarried:
66.9% (14,657)
Marital status - Hispanic or Latino population 15 years and over
Males 63.1% Never married31.1% Now married0.0% Separated1.1% Widowed4.7% DivorcedFemales 56.7% Never married36.6% Now married2.1% Separated1.3% Widowed3.2% DivorcedWomen who gave birth in the past 12 months Now married:
56.8% (69)Unmarried:
43.2% (53)
Women who did not give birth in the past 12 months Now married:
30.9% (795)Unmarried:
69.1% (1,777)
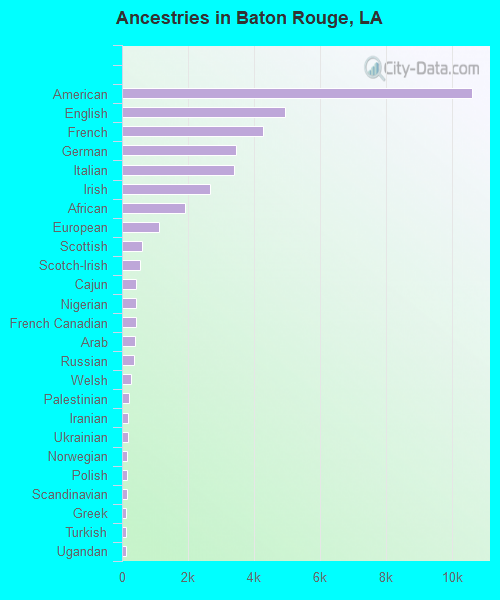
Ancestries in Baton Rouge
10,598 7.5% American4,949 3.5% English4,264 3.0% French3,458 2.4% German3,404 2.4% Italian2,670 1.9% Irish1,905 1.3% African1,108 0.8% European615 0.4% Scottish550 0.4% Scotch-Irish425 0.3% Cajun419 0.3% Nigerian411 0.3% French Canadian392 0.3% Arab363 0.3% Russian273 0.2% Welsh200 0.1% Palestinian194 0.1% Iranian186 0.1% Ukrainian164 0.1% Norwegian161 0.1% Polish157 0.1% Scandinavian133 0.09% Greek131 0.09% Turkish122 0.09% Ugandan117 0.08% Lebanese115 0.08% Swedish110 0.08% Ghanaian97 0.07% Dutch83 0.06% Australian82 0.06% British64 0.05% Jamaican62 0.04% Egyptian54 0.04% Moroccan48 0.03% Armenian43 0.03% Syrian42 0.03% Canadian40 0.03% Northern European39 0.03% Swiss36 0.03% Lithuanian34 0.02% Trinidadian and Tobagonian30 0.02% Bulgarian29 0.02% Czech28 0.02% Macedonian24 0.02% Romanian24 0.02% Belizean22 0.02% Sudanese22 0.02% Zimbabwean19 0.01% Eastern European18 0.01% Austrian17 0.01% Hungarian16 0.01% Portuguese15 0.01% Belgian14 0.01% Slovene13 0.01% Finnish12 0.01% Celtic10 0.01% Basque10 0.01% Ethiopian
Geographical mobility in Baton Rouge Same house 1 year ago 58,333 73.3% White (Caucasian)93,332 79.5% Black or African American243 63.0% American Indian / Alaska Native4,488 57.0% Asian3,804 67.1% Other race7,776 76.9% Two or more races57,205 73.1% White alone, not Hispanic / Latino6,735 70.8% Hispanic or LatinoMoved within same county 13,572 17.1% White / Caucasian13,180 11.2% Black or African American66 17.0% American Indian / Alaska Native2,202 28.0% Asian1,188 21.0% Other race1,648 16.3% Two or more races13,447 17.2% White alone, not Hispanic / Latino1,542 16.2% Hispanic or LatinoMoved within same state 4,851 6.1% White / Caucasian6,207 5.3% Black or African American68 17.6% American Indian / Alaska Native261 3.3% Asian147 2.6% Other race314 3.1% Two or more races4,819 6.2% White alone, not Hispanic / Latino321 3.4% Hispanic or LatinoMoved from different state 2,519 3.2% White / Caucasian4,563 3.9% Black or African American920 11.7% Asian296 5.2% Other race322 3.2% Two or more races2,519 3.2% White alone, not Hispanic / Latino324 3.4% Hispanic or LatinoMoved from abroad 273 0.3% White111 0.1% Black or African American12 3.1% American Indian / Alaska Native422 7.4% Other race69 0.7% Two or more races273 0.3% White alone, not Hispanic / Latino588 6.2% Hispanic or Latino
Children Nativity (place of birth) in Baton Rouge
Children under 6 years - Living with two parents Both parents native 3,820 100.0% NativeBoth parents foreign-born 1,392 100.0% NativeOne native, one foreign-born parent 659 100.0% NativeChildren under 6 years - Living with one parent Native parent 9,721 100.0% NativeForeign-born parent 610 100.0% NativeChildren 6 to 17 years - Living with two parents Both parents native 7,169 100.0% NativeBoth parents foreign-born 384 48.7% Native404 51.3% Foreign-bornOne native, one foreign-born parent 782 100.0% NativeChildren 6 to 17 years - Living with one parent Native parent 17,144 100.0% NativeForeign-born parent 428 60.6% Native278 39.4% Foreign-born
Place of birth for residents in Baton Rouge 7,575 Asia4,578 Americas4,419 Latin America3,651 Central America3,519 South Eastern Asia1,663 South Central Asia1,390 Eastern Asia1,135 Europe1,051 China1,029 Africa860 Western Asia587 Eastern Europe400 South America386 Western Africa367 Caribbean322 Western Europe283 Eastern Africa224 Northern Africa159 Northern America152 Oceania146 Australia and New Zealand Subregion117 Northern Europe108 Southern Europe45 Middle Africa45 Southern Africa2,651 Vietnam1,692 Honduras919 China664 El Salvador630 Bangladesh593 India592 Philippines471 Nicaragua435 Yemen405 Mexico367 Guatemala290 Germany275 Korea266 Nigeria230 Russia227 Iran206 Cuba159 Canada152 Nepal147 Brazil146 Australia141 Thailand136 Ukraine136 Algeria128 Syria124 Croatia121 Venezuela110 Ethiopia109 Ghana97 Dominican Republic87 Uganda86 Indonesia85 Saudi Arabia82 Italy72 Hong Kong70 Zimbabwe65 Turkey63 Japan59 Taiwan54 Guyana50 England49 Costa Rica47 Egypt45 Cameroon44 Sri Lanka43 Kuwait41 Bulgaria38 South Africa37 Laos33 Trinidad and Tobago32 Morocco32 Colombia31 Iraq29 Jamaica28 Sweden25 United Kingdom25 Spain24 Jordan24 Romania21 Lithuania17 Netherlands15 Kenya14 Kazakhstan13 Peru12 Ecuador11 Togo10 Argentina9 Malaysia9 France8 Poland7 Sudan6 Scotland6 Ireland5 Belgium
Grandparents responsible for own grandchildren in Baton Rouge
Grandparents (30 to 59 years) White / Caucasian 34 67.4% Responsible for grandchildren17 32.6% Not responsible for grandchildrenBlack or African American 339 30.0% Responsible for grandchildren792 70.0% Not responsible for grandchildrenOther race 42 100.0% Not responsible for grandchildrenTwo or more races 167 49.7% Responsible for grandchildren169 50.3% Not responsible for grandchildrenWhite alone, not Hispanic / Latino 35 66.8% Responsible for grandchildren18 33.2% Not responsible for grandchildrenHispanic or Latino 54 100.0% Not responsible for grandchildrenGrandparents (60 years and over) White / Caucasian 218 57.8% Responsible for grandchildren159 42.2% Not responsible for grandchildrenBlack or African American 1,001 70.4% Responsible for grandchildren420 29.6% Not responsible for grandchildrenOther race 61 100.0% Not responsible for grandchildrenTwo or more races 69 100.0% Not responsible for grandchildrenWhite alone, not Hispanic / Latino 222 63.7% Responsible for grandchildren126 36.3% Not responsible for grandchildrenHispanic or Latino 49 100.0% Not responsible for grandchildren
Zip codes: 70801 , 70802 , 70803 , 70805 , 70806 , 70808 , 70809 , 70810 , 70812 , 70814 , 70815 , 70816 , 70817 , 70819 , 70820 .