Races in Mukwonago, Wisconsin (WI) Detailed Stats
Ancestries, Foreign-born residents, place of birth
Settings
X


Recent posts about races in Mukwonago, Wisconsin on our local forum with over 2,400,000 registered users:
 | Houses for Rent west of Milwaukee (2 replies) |
| Need to find a place to rent that allows dogs .... (17 replies) |
| Best neighborhood for only child in Milwaukee burbs (1 reply) |
| I love Milwaukee (45 replies) |
| Where to look for home rentals? Rental prices high? (7 replies) |
| Moving from Utah to WI help w/high schools/cities (20 replies) |
Latest news about races in Mukwonago, WI collected exclusively by city-data.com from local newspapers, TV, and radio stations
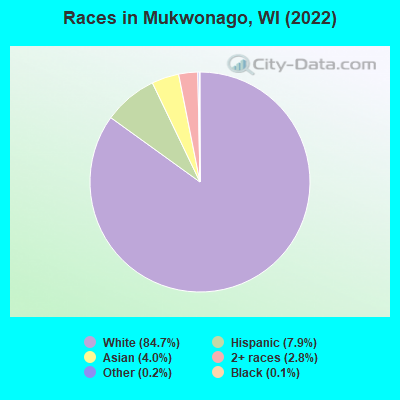
According to 2022 data, the most numerous races in Mukwonago, WI are White alone (7,095 residents), Hispanic (659 residents), and Black alone (12 residents). 94.4% of Mukwonago residents speak English at home. 5.3% of Mukwonago, WI residents are foreign-born (3.8% born in Asia, 0.7% born in Europe, 0.6% born in Latin America), which is 6.1% greater than the foreign-born rate of 5.0% across the entire state of Wisconsin.
Race distribution in Mukwonago
2000
2022

- 5,96296.8%White alone
- 1171.9%Hispanic
- 340.6%Two or more races
- 220.4%Asian alone
- 120.2%Black alone
- 140.2%American Indian alone
- 10.02%Other race alone

-
- 7,09584.7%White alone
- 6597.9%Hispanic
- 3334.0%Asian alone
- 2352.8%Two or more races
- 180.2%Other race alone
- 120.1%Black alone
- 50.06%American Indian alone
2000
2022
-
- 4,681,63087.3%White alone
- 300,2455.6%Black alone
- 192,9213.6%Hispanic
- 87,9951.6%Asian alone
- 51,9211.0%Two or more races
- 43,9800.8%American Indian alone
- 3,6370.07%Other race alone
- 1,3460.03%Native Hawaiian and Other
Pacific Islander alone

-
- 4,654,03179.0%White alone
- 447,0227.6%Hispanic
- 345,6785.9%Black alone
- 217,5323.7%Two or more races
- 172,2422.9%Asian alone
- 33,7620.6%American Indian alone
- 19,6800.3%Other race alone
- 2,5920.04%Native Hawaiian and Other
Pacific Islander alone

Income and house value in Mukwonago
- Median household income in 2022
- $95,884White non-Hispanic householders
- $74,892Asian householders
- $66,920Some other race householders
- $82,825Two or more races householders
- $64,435Hispanic or Latino race householders
- Median 2022 house value
- $328,254White Non-Hispanic householders
- $318,075Asian householders
- $423,098Hispanic or Latino householders
Household income for White non-Hispanic householders

Household income for American Indian and Alaska Native householders

Household income for Asian householders

Household income for Some other race householders

Household income for Two or more races householders

Household income for Hispanic or Latino race householders

Median age by race in Mukwonago
- 39.7Median age for White residents
- 39.7Males
- 39.5Females
- -632,587,858.8Median age for Black or African American residents
- -696,969,696.3Males
- -618,143,459.3Females
- 51.6Median age for American Indian / Alaska Native residents
- -1,272,916,665.4Males
- -689,393,938.7Females
- 71.0Median age for Asian residents
- 61.2Males
- 71.4Females
- -825,688,072.6Median age for Native Hawaiian / Pacific Islander residents
- -862,745,097.2Males
- -666,666,666.0Females
- 40.6Median age for Other race residents
- 61.6Males
- 22.0Females
- 17.7Median age for Two or more races residents
- 44.8Males
- 15.5Females
- 39.7Median age for White alone residents
- 39.8Males
- 40.3Females
- 22.3Median age for Hispanic or Latino residents
- 44.1Males
- 15.2Females
Owner/renter occupied households by race in Mukwonago
- House owners and renters - White residents
- 2,07170.8%Owner occupied
- 85329.2%Renter occupied
- House owners and renters - American Indian / Alaska Native residents
- 737.0%Owner occupied
- 1263.0%Renter occupied
- House owners and renters - Asian residents
- 10095.5%Owner occupied
- 54.5%Renter occupied
- House owners and renters - Other race residents
- 3475.9%Owner occupied
- 1124.1%Renter occupied
- House owners and renters - Two or more races residents
- 23886.1%Owner occupied
- 3813.9%Renter occupied
- House owners and renters - White alone residents
- 2,05270.3%Owner occupied
- 86729.7%Renter occupied
- House owners and renters - Hispanic or Latino residents
- 17683.8%Owner occupied
- 3416.2%Renter occupied
Language usage in Mukwonago
- English speakers - Total
- 94.4% of residents of Mukwonago speak English at home.
- 1.3% of residents speak Spanish at home
- 6057.1%Speak English very well
- 4542.9%Speak English less than very well
- 4.5% of residents speak other language at home
- 11030.9%Speak English very well
- 24669.1%Speak English less than very well
- English speakers - Born in the United States
- 98.2% of residents of Mukwonago speak English at home.
- 1.8% of residents speak Spanish at home
- 27100.0%Speak English very well
- English speakers - Native, born elsewhere
- 65.0% of residents of Mukwonago speak English at home.
- 35.0% of residents speak Spanish at home
- 7100.0%Speak English very well
- English speakers - Foreign-born
- 25.9% of residents of Mukwonago speak English at home.
- 11.0% of residents speak Spanish at home
- 1938.8%Speak English very well
- 3061.2%Speak English less than very well
- 63.5% of residents speak other language at home
- 6322.3%Speak English very well
- 21977.7%Speak English less than very well
White (Caucasian) - Speak only English
| Native: | 99.1% (6,594) |
| Foreign-born: | 50.5% (34) |
White (Caucasian) - Speak another language
| Native: | 0.8% (53) |
| Foreign-born: | 47.8% (33) |
American Indian / Alaska Native - Speak another language
| Native: | 91.4% (15) |
| Foreign-born: | 100.0% (34) |
Asian - Speak only English
| Native: | 100.0% (10) |
| Foreign-born: | 22.8% (75) |
Other race - Speak another language
| Native: | 16.2% (19) |
| Foreign-born: | 97.7% (31) |
Two or more races - Speak another language
| Native: | 4.1% (31) |
| Foreign-born: | 90.8% (9) |
White alone - Speak only English
| Native: | 99.1% (6,489) |
| Foreign-born: | 46.9% (38) |
White alone - Speak another language
| Native: | 0.6% (42) |
| Foreign-born: | 50.1% (41) |
Hispanic or Latino - Speak another language
| Native: | 8.6% (55) |
| Foreign-born: | 100.0% (42) |
Foreign-born residents in Mukwonago
446 residents are foreign born (3.8% Asia, 0.7% Europe, 0.6% Latin America).
| This city: | 5.3% |
| Wisconsin: | 5.0% |


Marital status for residents in Mukwonago
Marital status - White (Caucasian) population 15 years and over
- Males
- 29.7%Never married
- 55.7%Now married
- 0.4%Separated
- 2.8%Widowed
- 11.3%Divorced
- Females
- 21.6%Never married
- 53.8%Now married
- 0.7%Separated
- 10.4%Widowed
- 13.5%Divorced
Women who gave birth in the past 12 months
| Now married: | 100.0% (69) |
| Unmarried: | 0.0% (0) |
Women who did not give birth in the past 12 months
| Now married: | 53.4% (870) |
| Unmarried: | 46.6% (760) |
Marital status - American Indian / Alaska Native population 15 years and over
- Males
- 0.0%Never married
- 100.0%Now married
- 0.0%Separated
- 0.0%Widowed
- 0.0%Divorced
- Females
- 33.3%Never married
- 66.7%Now married
- 0.0%Separated
- 0.0%Widowed
- 0.0%Divorced
Women who did not give birth in the past 12 months
| Now married: | 100.0% (11) |
| Unmarried: | 0.0% (0) |
Marital status - Asian population 15 years and over
- Males
- 87.9%Never married
- 12.1%Now married
- 0.0%Separated
- 0.0%Widowed
- 0.0%Divorced
- Females
- 0.0%Never married
- 100.0%Now married
- 0.0%Separated
- 0.0%Widowed
- 0.0%Divorced
Women who did not give birth in the past 12 months
| Now married: | 100.0% (24) |
| Unmarried: | 0.0% (0) |
Marital status - Other race population 15 years and over
- Males
- 29.7%Never married
- 64.9%Now married
- 0.0%Separated
- 0.0%Widowed
- 5.4%Divorced
- Females
- 69.5%Never married
- 30.5%Now married
- 0.0%Separated
- 0.0%Widowed
- 0.0%Divorced
Women who did not give birth in the past 12 months
| Now married: | 19.6% (9) |
| Unmarried: | 80.4% (37) |
Marital status - Two or more races population 15 years and over
- Males
- 22.2%Never married
- 77.8%Now married
- 0.0%Separated
- 0.0%Widowed
- 0.0%Divorced
- Females
- 60.7%Never married
- 0.0%Now married
- 0.0%Separated
- 39.3%Widowed
- 0.0%Divorced
Women who did not give birth in the past 12 months
| Now married: | 0.0% (0) |
| Unmarried: | 100.0% (43) |
Marital status - White alone, not Hispanic / Latino population 15 years and over
- Males
- 29.2%Never married
- 55.9%Now married
- 0.4%Separated
- 2.9%Widowed
- 11.5%Divorced
- Females
- 21.5%Never married
- 53.7%Now married
- 0.7%Separated
- 10.5%Widowed
- 13.6%Divorced
Women who gave birth in the past 12 months
| Now married: | 100.0% (70) |
| Unmarried: | 0.0% (0) |
Women who did not give birth in the past 12 months
| Now married: | 53.2% (870) |
| Unmarried: | 46.8% (765) |
Marital status - Hispanic or Latino population 15 years and over
- Males
- 26.6%Never married
- 72.7%Now married
- 0.0%Separated
- 0.0%Widowed
- 0.7%Divorced
- Females
- 56.8%Never married
- 43.2%Now married
- 0.0%Separated
- 0.0%Widowed
- 0.0%Divorced
Women who did not give birth in the past 12 months
| Now married: | 43.2% (36) |
| Unmarried: | 56.8% (48) |
Ancestries in Mukwonago

- 1,04234.9%German
- 32410.8%Polish
- 1705.7%American
- 1254.2%European
- 1194.0%Irish
- 1163.9%English
- 1113.7%Italian
- 501.7%Norwegian
- 291.0%Dutch
- 270.9%Croatian
- 120.4%Danish
- 90.3%Scottish
- 80.3%Greek
- 70.2%Czech
- 60.2%Austrian
- 60.2%Eastern European
- 60.2%Russian
- 60.2%Scotch-Irish
- 60.2%Slovak
- 50.2%Welsh
- 30.1%Serbian
- 10.03%Swedish

Geographical mobility in Mukwonago

- Same house 1 year ago
- 6,32588.7%White (Caucasian)
- 43100.0%American Indian / Alaska Native
- 31995.3%Asian
- 6469.7%Other race
- 60788.3%Two or more races
- 6,27489.1%White alone, not Hispanic / Latino
- 55885.9%Hispanic or Latino

-
- Moved within same county
- 4306.0%White / Caucasian
- 82.4%Asian
- 426.2%Two or more races
- 4045.7%White alone, not Hispanic / Latino
- 6610.2%Hispanic or Latino

-
- Moved within same state
- 2233.1%White / Caucasian
- 10100.0%Black or African American
- 51.6%Asian
- 2729.4%Other race
- 324.7%Two or more races
- 2173.1%White alone, not Hispanic / Latino
- 264.0%Hispanic or Latino

-
- Moved from different state
- 1231.7%White / Caucasian
- 1241.8%White alone, not Hispanic / Latino

-
- Moved from abroad
- 270.4%White
- 210.3%White alone, not Hispanic / Latino

Children Nativity (place of birth) in Mukwonago
Place of birth for residents in Mukwonago
![Place of birth for the foreign-born population - Regions]()
- 315Asia
- 221South Eastern Asia
- 78Eastern Asia
- 64Americas
- 54Europe
- 53Latin America
- 41Central America
- 32Eastern Europe
- 13Western Europe
- 11South America
- 10Africa
- 10Northern Africa
- 10Northern America
- 7Southern Europe
- 7South Central Asia
- 6Western Asia

![Place of birth for the foreign-born population - Countries]()
- 221Philippines
- 78Korea
- 41Mexico
- 16Poland
- 15Belarus
- 11Colombia
- 10Germany
- 10Egypt
- 10Canada
- 7Greece
- 7India
- 6Lebanon
- 2Netherlands

Zip codes: 53149.