Races in Sparta, Wisconsin (WI) Detailed Stats
Ancestries, Foreign-born residents, place of birth
Settings
X


Recent posts about races in Sparta, Wisconsin on our local forum with over 2,400,000 registered users:
 | The West Central HO Model Railroad: 7 Scale Miles of Track! Located in Sparta, WI (9 replies) |
| Tomah/Sparta Area (20 replies) |
| housing location advice for work in Sparta: maybe West Salem or Onalaska? (3 replies) |
| Ft McCoy, Sparta area (6 replies) |
| RELOCATING, your help is appreciated! :) (12 replies) |
| Another moving to La Crosse area... Need advice!!! (11 replies) |
Latest news about races in Sparta, WI collected exclusively by city-data.com from local newspapers, TV, and radio stations
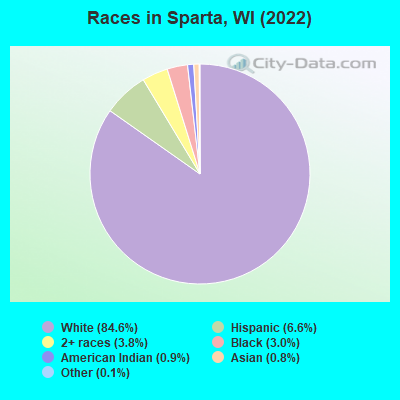
According to 2022 data, the most numerous races in Sparta, WI are White alone (8,422 residents), Hispanic (657 residents), and Black alone (302 residents). 94.3% of Sparta residents speak English at home. 1.7% of Sparta, WI residents are foreign-born , which is 198.2% less than the foreign-born rate of 5.0% across the entire state of Wisconsin.
Race distribution in Sparta
2000
2022

- 8,29595.9%White alone
- 1571.8%Hispanic
- 560.6%Black alone
- 540.6%Two or more races
- 540.6%Asian alone
- 270.3%American Indian alone
- 40.05%Native Hawaiian and Other
Pacific Islander alone - 10.01%Other race alone

-
- 8,42284.6%White alone
- 6576.6%Hispanic
- 3823.8%Two or more races
- 3023.0%Black alone
- 870.9%American Indian alone
- 810.8%Asian alone
- 140.1%Other race alone
2000
2022
-
- 4,681,63087.3%White alone
- 300,2455.6%Black alone
- 192,9213.6%Hispanic
- 87,9951.6%Asian alone
- 51,9211.0%Two or more races
- 43,9800.8%American Indian alone
- 3,6370.07%Other race alone
- 1,3460.03%Native Hawaiian and Other
Pacific Islander alone

-
- 4,654,03179.0%White alone
- 447,0227.6%Hispanic
- 345,6785.9%Black alone
- 217,5323.7%Two or more races
- 172,2422.9%Asian alone
- 33,7620.6%American Indian alone
- 19,6800.3%Other race alone
- 2,5920.04%Native Hawaiian and Other
Pacific Islander alone

Income and house value in Sparta
- Median household income in 2022
- $56,686White non-Hispanic householders
- $46,396Black householders
- $63,193Two or more races householders
- $54,267Hispanic or Latino race householders
- Median 2022 house value
- $184,238White Non-Hispanic householders
- over $1,000,000Black or African American householders
- $264,009American Indian or Alaska Native householders
- $30,871Asian householders
- $177,817Two or more races householders
- $234,620Hispanic or Latino householders
Household income for White non-Hispanic householders

Household income for Black householders

Household income for American Indian and Alaska Native householders

Household income for Some other race householders

Household income for Two or more races householders

Household income for Hispanic or Latino race householders

Median age by race in Sparta
- 40.1Median age for White residents
- 39.9Males
- 40.4Females
- 35.8Median age for Black or African American residents
- 35.3Males
- 29.9Females
- 34.1Median age for American Indian / Alaska Native residents
- 33.5Males
- 34.0Females
- -697,777,777.1Median age for Asian residents
- -694,063,926.2Males
- -707,659,114.7Females
- -825,688,072.6Median age for Native Hawaiian / Pacific Islander residents
- -862,745,097.2Males
- -732,444,443.7Females
- 37.0Median age for Other race residents
- 51.1Males
- 34.7Females
- 27.4Median age for Two or more races residents
- 29.2Males
- 27.1Females
- 40.5Median age for White alone residents
- 40.3Males
- 41.6Females
- 21.1Median age for Hispanic or Latino residents
- 28.5Males
- 13.2Females
Owner/renter occupied households by race in Sparta
- House owners and renters - White residents
- 2,58267.2%Owner occupied
- 1,26332.8%Renter occupied
- House owners and renters - Black or African American residents
- 146.5%Owner occupied
- 20493.5%Renter occupied
- House owners and renters - American Indian / Alaska Native residents
- 1549.3%Owner occupied
- 1550.7%Renter occupied
- House owners and renters - Other race residents
- 25100.0%Renter occupied
- House owners and renters - Two or more races residents
- 6031.5%Owner occupied
- 13068.5%Renter occupied
- House owners and renters - White alone residents
- 2,57867.2%Owner occupied
- 1,26132.8%Renter occupied
- House owners and renters - Hispanic or Latino residents
- 3131.2%Owner occupied
- 6868.8%Renter occupied
Language usage in Sparta
- English speakers - Total
- 94.3% of residents of Sparta speak English at home.
- 3.6% of residents speak Spanish at home
- 24771.6%Speak English very well
- 9828.4%Speak English less than very well
- 1.9% of residents speak other language at home
- 179100.0%Speak English very well
- English speakers - Born in the United States
- 94.4% of residents of Sparta speak English at home.
- 4.1% of residents speak Spanish at home
- 7191.0%Speak English very well
- 79.0%Speak English less than very well
- 1.4% of residents speak other language at home
- 27100.0%Speak English very well
- English speakers - Native, born elsewhere
- 70.2% of residents of Sparta speak English at home.
- 17.4% of residents speak Spanish at home
- 2890.3%Speak English very well
- 39.7%Speak English less than very well
- 12.9% of residents speak other language at home
- 23100.0%Speak English very well
- English speakers - Foreign-born
- 38.5% of residents of Sparta speak English at home.
- 57.7% of residents speak Spanish at home
- 90100.0%Speak English less than very well
- 5.8% of residents speak other language at home
- 9100.0%Speak English very well
White (Caucasian) - Speak only English
| Native: | 98.0% (8,066) |
| Foreign-born: | 57.9% (35) |
White (Caucasian) - Speak another language
| Native: | 2.0% (168) |
| Foreign-born: | 47.1% (28) |
Other race - Speak only English
| Native: | 15.8% (17) |
| Foreign-born: | 100.0% (20) |
Two or more races - Speak another language
| Native: | 12.9% (54) |
| Foreign-born: | 100.0% (75) |
White alone - Speak only English
| Native: | 98.9% (7,920) |
| Foreign-born: | 79.4% (31) |
White alone - Speak another language
| Native: | 1.1% (87) |
| Foreign-born: | 20.5% (8) |
Hispanic or Latino - Speak only English
| Native: | 46.2% (216) |
| Foreign-born: | 24.0% (28) |
Hispanic or Latino - Speak another language
| Native: | 53.2% (249) |
| Foreign-born: | 73.5% (85) |
Foreign-born residents in Sparta
167 residents are foreign born
| This city: | 1.7% |
| Wisconsin: | 5.0% |


Marital status for residents in Sparta
Marital status - White (Caucasian) population 15 years and over
- Males
- 33.6%Never married
- 43.7%Now married
- 2.3%Separated
- 1.4%Widowed
- 19.0%Divorced
- Females
- 22.0%Never married
- 41.2%Now married
- 4.0%Separated
- 9.1%Widowed
- 23.8%Divorced
Women who gave birth in the past 12 months
| Now married: | 36.9% (23) |
| Unmarried: | 63.1% (40) |
Women who did not give birth in the past 12 months
| Now married: | 46.6% (851) |
| Unmarried: | 53.4% (975) |
Marital status - Black or African American population 15 years and over
- Males
- 98.9%Never married
- 1.1%Now married
- 0.0%Separated
- 0.0%Widowed
- 0.0%Divorced
- Females
- 0.0%Never married
- 51.5%Now married
- 0.0%Separated
- 28.8%Widowed
- 19.7%Divorced
Women who gave birth in the past 12 months
| Now married: | 100.0% (33) |
| Unmarried: | 0.0% (0) |
Women who did not give birth in the past 12 months
| Now married: | 0.0% (0) |
| Unmarried: | 100.0% (13) |
Marital status - American Indian / Alaska Native population 15 years and over
- Males
- 70.4%Never married
- 18.5%Now married
- 0.0%Separated
- 0.0%Widowed
- 11.1%Divorced
- Females
- 100.0%Never married
- 0.0%Now married
- 0.0%Separated
- 0.0%Widowed
- 0.0%Divorced
Women who did not give birth in the past 12 months
| Now married: | 0.0% (0) |
| Unmarried: | 100.0% (68) |
Marital status - Other race population 15 years and over
- Males
- 20.8%Never married
- 22.8%Now married
- 56.4%Separated
- 0.0%Widowed
- 0.0%Divorced
- Females
- 0.0%Never married
- 100.0%Now married
- 0.0%Separated
- 0.0%Widowed
- 0.0%Divorced
Women who did not give birth in the past 12 months
| Now married: | 100.0% (21) |
| Unmarried: | 0.0% (0) |
Marital status - Two or more races population 15 years and over
- Males
- 58.3%Never married
- 41.7%Now married
- 0.0%Separated
- 0.0%Widowed
- 0.0%Divorced
- Females
- 31.1%Never married
- 45.9%Now married
- 0.0%Separated
- 0.0%Widowed
- 23.0%Divorced
Women who did not give birth in the past 12 months
| Now married: | 41.4% (36) |
| Unmarried: | 58.6% (51) |
Marital status - White alone, not Hispanic / Latino population 15 years and over
- Males
- 33.1%Never married
- 44.0%Now married
- 2.4%Separated
- 1.4%Widowed
- 19.1%Divorced
- Females
- 22.4%Never married
- 40.5%Now married
- 4.1%Separated
- 9.3%Widowed
- 23.7%Divorced
Women who gave birth in the past 12 months
| Now married: | 36.9% (24) |
| Unmarried: | 63.1% (40) |
Women who did not give birth in the past 12 months
| Now married: | 44.9% (809) |
| Unmarried: | 55.1% (994) |
Marital status - Hispanic or Latino population 15 years and over
- Males
- 35.6%Never married
- 35.6%Now married
- 25.3%Separated
- 0.0%Widowed
- 3.6%Divorced
- Females
- 7.0%Never married
- 76.7%Now married
- 0.0%Separated
- 0.0%Widowed
- 16.3%Divorced
Women who did not give birth in the past 12 months
| Now married: | 90.2% (86) |
| Unmarried: | 9.8% (9) |
Ancestries in Sparta

- 90925.5%German
- 3549.9%Norwegian
- 2767.7%American
- 2356.6%Irish
- 1494.2%English
- 1323.7%Polish
- 1103.1%Italian
- 702.0%Swedish
- 641.8%Finnish
- 581.6%European
- 511.4%Belgian
- 361.0%Czech
- 300.8%Czechoslovakian
- 290.8%Scottish
- 280.8%Welsh
- 250.7%Eastern European
- 220.6%Hungarian
- 140.4%Dutch
- 140.4%French Canadian
- 130.4%Greek
- 130.4%Swiss
- 100.3%Scotch-Irish
- 10.03%French
- 10.03%African

Geographical mobility in Sparta

- Same house 1 year ago
- 7,77390.3%White (Caucasian)
- 21069.3%Black or African American
- 9684.6%American Indian / Alaska Native
- 10886.4%Other race
- 29950.6%Two or more races
- 7,72692.2%White alone, not Hispanic / Latino
- 38859.0%Hispanic or Latino

-
- Moved within same county
- 4154.8%White / Caucasian
- 7324.2%Black or African American
- 1513.1%American Indian / Alaska Native
- 6984.6%Asian
- 1310.1%Other race
- 10417.6%Two or more races
- 3133.7%White alone, not Hispanic / Latino
- 16825.5%Hispanic or Latino

-
- Moved within same state
- 2843.3%White / Caucasian
- 196.3%Black or African American
- 32.5%American Indian / Alaska Native
- 2883.4%White alone, not Hispanic / Latino

-
- Moved from different state
- 861.0%White / Caucasian
- 490.6%White alone, not Hispanic / Latino
- 487.3%Hispanic or Latino

-
- Moved from abroad
- 630.7%White
- 20835.1%Two or more races
- 290.3%White alone, not Hispanic / Latino
- 599.0%Hispanic or Latino

Children Nativity (place of birth) in Sparta
Place of birth for residents in Sparta
![Place of birth for the foreign-born population - Regions]()
- 123Americas
- 112Latin America
- 104Central America
- 43Europe
- 24Northern Europe
- 18Western Europe
- 10Northern America
- 7Caribbean

![Place of birth for the foreign-born population - Countries]()
- 98Mexico
- 24United Kingdom
- 10Netherlands
- 10Canada
- 7Germany
- 7Cuba
- 5Honduras

Grandparents responsible for own grandchildren in Sparta
Zip codes: 54656.