Estimated zip code population in 2022: 6,063
Zip code population in 2010: 6,518
Zip code population in 2000: 6,619
Houses and condos: 3,078
Renter-occupied apartments: 800
% of renters here:
30%State:
35%
March 2022 cost of living index in zip code 73084: 84.4
(less than average, U.S. average is 100)
Land area: 16.9
sq. mi.
Water area: 0.0
sq. mi.
Population density: 359 people per square mile (very low).
OSM Map
General Map
Google Map
MSN Map
OSM Map
General Map
Google Map
MSN Map
OSM Map
General Map
Google Map
MSN Map
OSM Map
General Map
Google Map
MSN Map
Please wait while loading the map...
Real estate property taxes paid for housing units in 2022:
This zip code:
0.8% ($968)Oklahoma:
0.8% ($1,501)
Median real estate property taxes paid for housing units with mortgages in 2022: $1,127 (0.8%)
Median real estate property taxes paid for housing units with no mortgage in 2022: $799 (0.7%)
Profiles of local businesses
Business Search - 14 Million verified businesses
Males: 3,087 Females: 2,975
For population 25 years and over in 73084:
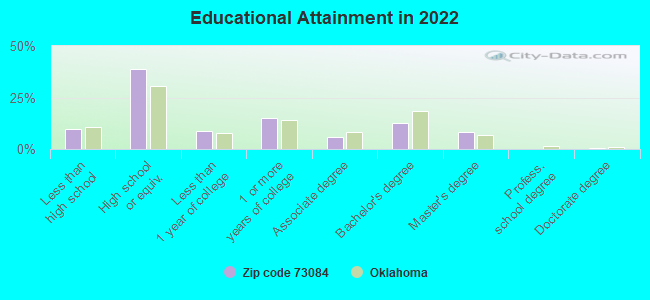
High school or higher: 89.2%Bachelor's degree or higher: 21.2%Graduate or professional degree: 8.8%Unemployed: 6.0%Mean travel time to work (commute): 25.9 minutes
For population 15 years and over in 73084:
Never married: 28.8%Now married: 42.0%Separated: 1.4%Widowed: 8.5%Divorced: 19.3%
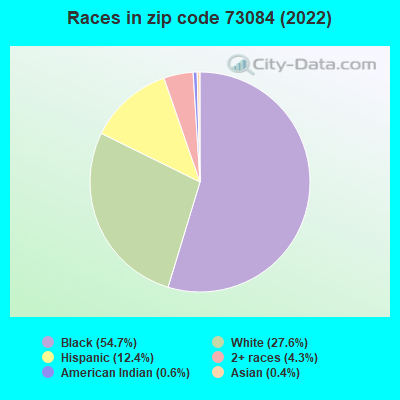
Zip code 73084 compared to state average:
Black race population percentage significantly above state average. Median age above state average. Length of stay since moving in significantly above state average. 3,313 54.7% Black 1,674 27.6% White 754 12.4% Hispanic or Latino 259 4.3% Two or more races 34 0.6% American Indian 27 0.4% Asian
Data:
Median household income ($)
Median household income (% change since 2000)
Household income diversity
Ratio of average income to average house value (%)
Ratio of average income to average rent
Median household income ($) - White
Median household income ($) - Black or African American
Median household income ($) - Asian
Median household income ($) - Hispanic or Latino
Median household income ($) - American Indian and Alaska Native
Median household income ($) - Multirace
Median household income ($) - Other Race
Median household income for houses/condos with a mortgage ($)
Median household income for apartments without a mortgage ($)
Races - White alone (%)
Races - White alone (% change since 2000)
Races - Black alone (%)
Races - Black alone (% change since 2000)
Races - American Indian alone (%)
Races - American Indian alone (% change since 2000)
Races - Asian alone (%)
Races - Asian alone (% change since 2000)
Races - Hispanic (%)
Races - Hispanic (% change since 2000)
Races - Native Hawaiian and Other Pacific Islander alone (%)
Races - Native Hawaiian and Other Pacific Islander alone (% change since 2000)
Races - Two or more races (%)
Races - Two or more races (% change since 2000)
Races - Other race alone (%)
Races - Other race alone (% change since 2000)
Racial diversity
Unemployment (%)
Unemployment (% change since 2000)
Unemployment (%) - White
Unemployment (%) - Black or African American
Unemployment (%) - Asian
Unemployment (%) - Hispanic or Latino
Unemployment (%) - American Indian and Alaska Native
Unemployment (%) - Multirace
Unemployment (%) - Other Race
Population density (people per square mile)
Population - Males (%)
Population - Females (%)
Population - Males (%) - White
Population - Males (%) - Black or African American
Population - Males (%) - Asian
Population - Males (%) - Hispanic or Latino
Population - Males (%) - American Indian and Alaska Native
Population - Males (%) - Multirace
Population - Males (%) - Other Race
Population - Females (%) - White
Population - Females (%) - Black or African American
Population - Females (%) - Asian
Population - Females (%) - Hispanic or Latino
Population - Females (%) - American Indian and Alaska Native
Population - Females (%) - Multirace
Population - Females (%) - Other Race
Coronavirus confirmed cases (May 28, 2024)
Deaths caused by coronavirus (May 28, 2024)
Coronavirus confirmed cases (per 100k population) (May 28, 2024)
Deaths caused by coronavirus (per 100k population) (May 28, 2024)
Daily increase in number of cases (May 28, 2024)
Weekly increase in number of cases (May 28, 2024)
Cases doubled (in days) (May 28, 2024)
Hospitalized patients (Apr 18, 2022)
Negative test results (Apr 18, 2022)
Total test results (Apr 18, 2022)
COVID Vaccine doses distributed (per 100k population) (Sep 19, 2023)
COVID Vaccine doses administered (per 100k population) (Sep 19, 2023)
COVID Vaccine doses distributed (Sep 19, 2023)
COVID Vaccine doses administered (Sep 19, 2023)
Likely homosexual households (%)
Likely homosexual households (% change since 2000)
Likely homosexual households - Lesbian couples (%)
Likely homosexual households - Lesbian couples (% change since 2000)
Likely homosexual households - Gay men (%)
Likely homosexual households - Gay men (% change since 2000)
Cost of living index
Median gross rent ($)
Median contract rent ($)
Median monthly housing costs ($)
Median house or condo value ($)
Median house or condo value ($ change since 2000)
Mean house or condo value by units in structure - 1, detached ($)
Mean house or condo value by units in structure - 1, attached ($)
Mean house or condo value by units in structure - 2 ($)
Mean house or condo value by units in structure by units in structure - 3 or 4 ($)
Mean house or condo value by units in structure - 5 or more ($)
Mean house or condo value by units in structure - Boat, RV, van, etc. ($)
Mean house or condo value by units in structure - Mobile home ($)
Median house or condo value ($) - White
Median house or condo value ($) - Black or African American
Median house or condo value ($) - Asian
Median house or condo value ($) - Hispanic or Latino
Median house or condo value ($) - American Indian and Alaska Native
Median house or condo value ($) - Multirace
Median house or condo value ($) - Other Race
Median resident age
Resident age diversity
Median resident age - Males
Median resident age - Females
Median resident age - White
Median resident age - Black or African American
Median resident age - Asian
Median resident age - Hispanic or Latino
Median resident age - American Indian and Alaska Native
Median resident age - Multirace
Median resident age - Other Race
Median resident age - Males - White
Median resident age - Males - Black or African American
Median resident age - Males - Asian
Median resident age - Males - Hispanic or Latino
Median resident age - Males - American Indian and Alaska Native
Median resident age - Males - Multirace
Median resident age - Males - Other Race
Median resident age - Females - White
Median resident age - Females - Black or African American
Median resident age - Females - Asian
Median resident age - Females - Hispanic or Latino
Median resident age - Females - American Indian and Alaska Native
Median resident age - Females - Multirace
Median resident age - Females - Other Race
Commute - mean travel time to work (minutes)
Travel time to work - Less than 5 minutes (%)
Travel time to work - Less than 5 minutes (% change since 2000)
Travel time to work - 5 to 9 minutes (%)
Travel time to work - 5 to 9 minutes (% change since 2000)
Travel time to work - 10 to 19 minutes (%)
Travel time to work - 10 to 19 minutes (% change since 2000)
Travel time to work - 20 to 29 minutes (%)
Travel time to work - 20 to 29 minutes (% change since 2000)
Travel time to work - 30 to 39 minutes (%)
Travel time to work - 30 to 39 minutes (% change since 2000)
Travel time to work - 40 to 59 minutes (%)
Travel time to work - 40 to 59 minutes (% change since 2000)
Travel time to work - 60 to 89 minutes (%)
Travel time to work - 60 to 89 minutes (% change since 2000)
Travel time to work - 90 or more minutes (%)
Travel time to work - 90 or more minutes (% change since 2000)
Marital status - Never married (%)
Marital status - Now married (%)
Marital status - Separated (%)
Marital status - Widowed (%)
Marital status - Divorced (%)
Median family income ($)
Median family income (% change since 2000)
Median non-family income ($)
Median non-family income (% change since 2000)
Median per capita income ($)
Median per capita income (% change since 2000)
Median family income ($) - White
Median family income ($) - Black or African American
Median family income ($) - Asian
Median family income ($) - Hispanic or Latino
Median family income ($) - American Indian and Alaska Native
Median family income ($) - Multirace
Median family income ($) - Other Race
Median year house/condo built
Median year apartment built
Year house built - Built 2005 or later (%)
Year house built - Built 2000 to 2004 (%)
Year house built - Built 1990 to 1999 (%)
Year house built - Built 1980 to 1989 (%)
Year house built - Built 1970 to 1979 (%)
Year house built - Built 1960 to 1969 (%)
Year house built - Built 1950 to 1959 (%)
Year house built - Built 1940 to 1949 (%)
Year house built - Built 1939 or earlier (%)
Average household size
Household density (households per square mile)
Average household size - White
Average household size - Black or African American
Average household size - Asian
Average household size - Hispanic or Latino
Average household size - American Indian and Alaska Native
Average household size - Multirace
Average household size - Other Race
Occupied housing units (%)
Vacant housing units (%)
Owner occupied housing units (%)
Renter occupied housing units (%)
Vacancy status - For rent (%)
Vacancy status - For sale only (%)
Vacancy status - Rented or sold, not occupied (%)
Vacancy status - For seasonal, recreational, or occasional use (%)
Vacancy status - For migrant workers (%)
Vacancy status - Other vacant (%)
Residents with income below the poverty level (%)
Residents with income below 50% of the poverty level (%)
Children below poverty level (%)
Poor families by family type - Married-couple family (%)
Poor families by family type - Male, no wife present (%)
Poor families by family type - Female, no husband present (%)
Poverty status for native-born residents (%)
Poverty status for foreign-born residents (%)
Poverty among high school graduates not in families (%)
Poverty among people who did not graduate high school not in families (%)
Residents with income below the poverty level (%) - White
Residents with income below the poverty level (%) - Black or African American
Residents with income below the poverty level (%) - Asian
Residents with income below the poverty level (%) - Hispanic or Latino
Residents with income below the poverty level (%) - American Indian and Alaska Native
Residents with income below the poverty level (%) - Multirace
Residents with income below the poverty level (%) - Other Race
Air pollution - Air Quality Index (AQI)
Air pollution - CO
Air pollution - NO2
Air pollution - SO2
Air pollution - Ozone
Air pollution - PM10
Air pollution - PM25
Air pollution - Pb
Crime - Murders per 100,000 population
Crime - Rapes per 100,000 population
Crime - Robberies per 100,000 population
Crime - Assaults per 100,000 population
Crime - Burglaries per 100,000 population
Crime - Thefts per 100,000 population
Crime - Auto thefts per 100,000 population
Crime - Arson per 100,000 population
Crime - City-data.com crime index
Crime - Violent crime index
Crime - Property crime index
Crime - Murders per 100,000 population (5 year average)
Crime - Rapes per 100,000 population (5 year average)
Crime - Robberies per 100,000 population (5 year average)
Crime - Assaults per 100,000 population (5 year average)
Crime - Burglaries per 100,000 population (5 year average)
Crime - Thefts per 100,000 population (5 year average)
Crime - Auto thefts per 100,000 population (5 year average)
Crime - Arson per 100,000 population (5 year average)
Crime - City-data.com crime index (5 year average)
Crime - Violent crime index (5 year average)
Crime - Property crime index (5 year average)
1996 Presidential Elections Results (%) - Democratic Party (Clinton)
1996 Presidential Elections Results (%) - Republican Party (Dole)
1996 Presidential Elections Results (%) - Other
2000 Presidential Elections Results (%) - Democratic Party (Gore)
2000 Presidential Elections Results (%) - Republican Party (Bush)
2000 Presidential Elections Results (%) - Other
2004 Presidential Elections Results (%) - Democratic Party (Kerry)
2004 Presidential Elections Results (%) - Republican Party (Bush)
2004 Presidential Elections Results (%) - Other
2008 Presidential Elections Results (%) - Democratic Party (Obama)
2008 Presidential Elections Results (%) - Republican Party (McCain)
2008 Presidential Elections Results (%) - Other
2012 Presidential Elections Results (%) - Democratic Party (Obama)
2012 Presidential Elections Results (%) - Republican Party (Romney)
2012 Presidential Elections Results (%) - Other
2016 Presidential Elections Results (%) - Democratic Party (Clinton)
2016 Presidential Elections Results (%) - Republican Party (Trump)
2016 Presidential Elections Results (%) - Other
2020 Presidential Elections Results (%) - Democratic Party (Biden)
2020 Presidential Elections Results (%) - Republican Party (Trump)
2020 Presidential Elections Results (%) - Other
Ancestries Reported - Arab (%)
Ancestries Reported - Czech (%)
Ancestries Reported - Danish (%)
Ancestries Reported - Dutch (%)
Ancestries Reported - English (%)
Ancestries Reported - French (%)
Ancestries Reported - French Canadian (%)
Ancestries Reported - German (%)
Ancestries Reported - Greek (%)
Ancestries Reported - Hungarian (%)
Ancestries Reported - Irish (%)
Ancestries Reported - Italian (%)
Ancestries Reported - Lithuanian (%)
Ancestries Reported - Norwegian (%)
Ancestries Reported - Polish (%)
Ancestries Reported - Portuguese (%)
Ancestries Reported - Russian (%)
Ancestries Reported - Scotch-Irish (%)
Ancestries Reported - Scottish (%)
Ancestries Reported - Slovak (%)
Ancestries Reported - Subsaharan African (%)
Ancestries Reported - Swedish (%)
Ancestries Reported - Swiss (%)
Ancestries Reported - Ukrainian (%)
Ancestries Reported - United States (%)
Ancestries Reported - Welsh (%)
Ancestries Reported - West Indian (%)
Ancestries Reported - Other (%)
Educational Attainment - No schooling completed (%)
Educational Attainment - Less than high school (%)
Educational Attainment - High school or equivalent (%)
Educational Attainment - Less than 1 year of college (%)
Educational Attainment - 1 or more years of college (%)
Educational Attainment - Associate degree (%)
Educational Attainment - Bachelor's degree (%)
Educational Attainment - Master's degree (%)
Educational Attainment - Professional school degree (%)
Educational Attainment - Doctorate degree (%)
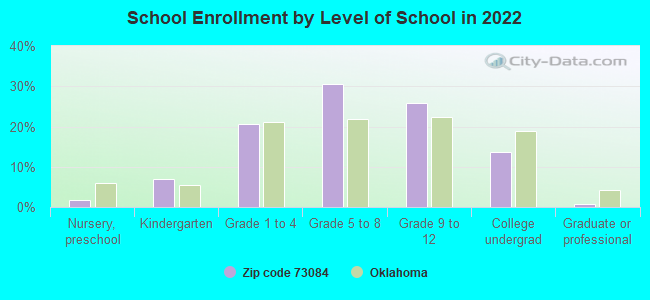
School Enrollment - Nursery, preschool (%)
School Enrollment - Kindergarten (%)
School Enrollment - Grade 1 to 4 (%)
School Enrollment - Grade 5 to 8 (%)
School Enrollment - Grade 9 to 12 (%)
School Enrollment - College undergrad (%)
School Enrollment - Graduate or professional (%)
School Enrollment - Not enrolled in school (%)
School enrollment - Public schools (%)
School enrollment - Private schools (%)
School enrollment - Not enrolled (%)
Median number of rooms in houses and condos
Median number of rooms in apartments
Housing units lacking complete plumbing facilities (%)
Housing units lacking complete kitchen facilities (%)
Density of houses
Urban houses (%)
Rural houses (%)
Households with people 60 years and over (%)
Households with people 65 years and over (%)
Households with people 75 years and over (%)
Households with one or more nonrelatives (%)
Households with no nonrelatives (%)
Population in households (%)
Family households (%)
Nonfamily households (%)
Population in families (%)
Family households with own children (%)
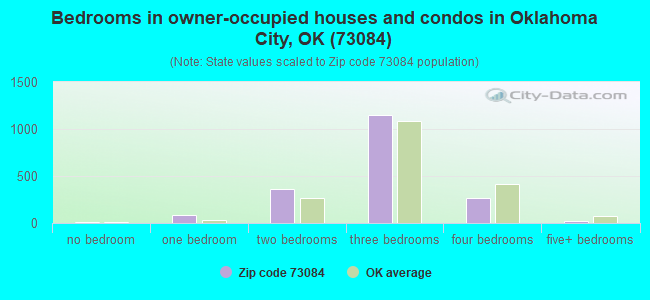
Median number of bedrooms in owner occupied houses
Mean number of bedrooms in owner occupied houses
Median number of bedrooms in renter occupied houses
Mean number of bedrooms in renter occupied houses
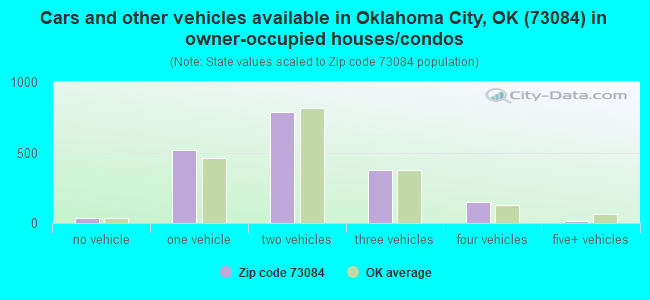
Median number of vehichles in owner occupied houses
Mean number of vehichles in owner occupied houses
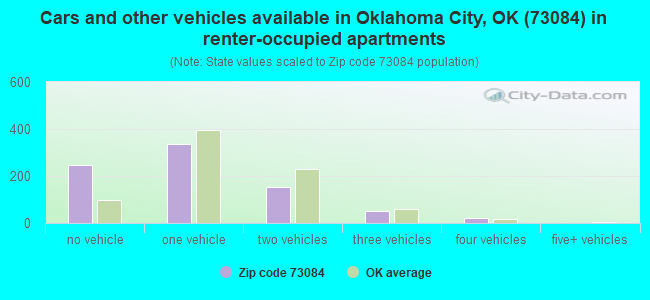
Median number of vehichles in renter occupied houses
Mean number of vehichles in renter occupied houses
Mortgage status - with mortgage (%)
Mortgage status - with second mortgage (%)
Mortgage status - with home equity loan (%)
Mortgage status - with both second mortgage and home equity loan (%)
Mortgage status - without a mortgage (%)
Average family size
Average family size - White
Average family size - Black or African American
Average family size - Asian
Average family size - Hispanic or Latino
Average family size - American Indian and Alaska Native
Average family size - Multirace
Average family size - Other Race
Geographical mobility - Same house 1 year ago (%)
Geographical mobility - Moved within same county (%)
Geographical mobility - Moved from different county within same state (%)
Geographical mobility - Moved from different state (%)
Geographical mobility - Moved from abroad (%)
Place of birth - Born in state of residence (%)
Place of birth - Born in other state (%)
Place of birth - Native, outside of US (%)
Place of birth - Foreign born (%)
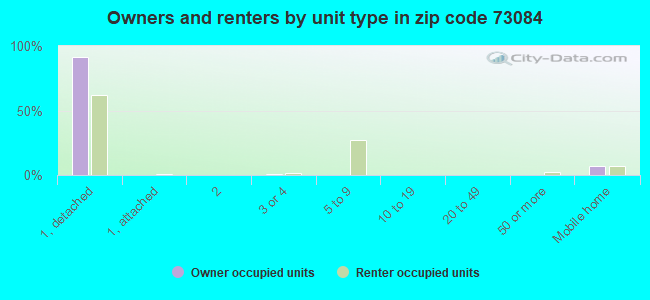
Housing units in structures - 1, detached (%)
Housing units in structures - 1, attached (%)
Housing units in structures - 2 (%)
Housing units in structures - 3 or 4 (%)
Housing units in structures - 5 to 9 (%)
Housing units in structures - 10 to 19 (%)
Housing units in structures - 20 to 49 (%)
Housing units in structures - 50 or more (%)
Housing units in structures - Mobile home (%)
Housing units in structures - Boat, RV, van, etc. (%)
House/condo owner moved in on average (years ago)
Renter moved in on average (years ago)
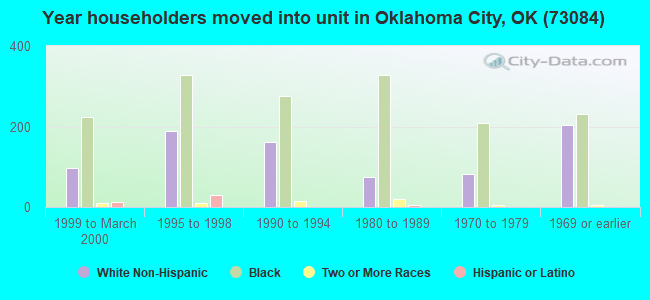
Year householder moved into unit - Moved in 1999 to March 2000 (%)
Year householder moved into unit - Moved in 1995 to 1998 (%)
Year householder moved into unit - Moved in 1990 to 1994 (%)
Year householder moved into unit - Moved in 1980 to 1989 (%)
Year householder moved into unit - Moved in 1970 to 1979 (%)
Year householder moved into unit - Moved in 1969 or earlier (%)
Means of transportation to work - Drove car alone (%)
Means of transportation to work - Carpooled (%)
Means of transportation to work - Public transportation (%)
Means of transportation to work - Bus or trolley bus (%)
Means of transportation to work - Streetcar or trolley car (%)
Means of transportation to work - Subway or elevated (%)
Means of transportation to work - Railroad (%)
Means of transportation to work - Ferryboat (%)
Means of transportation to work - Taxicab (%)
Means of transportation to work - Motorcycle (%)
Means of transportation to work - Bicycle (%)
Means of transportation to work - Walked (%)
Means of transportation to work - Other means (%)
Working at home (%)
Industry diversity
Most Common Industries - Agriculture, forestry, fishing and hunting, and mining (%)
Most Common Industries - Agriculture, forestry, fishing and hunting (%)
Most Common Industries - Mining, quarrying, and oil and gas extraction (%)
Most Common Industries - Construction (%)
Most Common Industries - Manufacturing (%)
Most Common Industries - Wholesale trade (%)
Most Common Industries - Retail trade (%)
Most Common Industries - Transportation and warehousing, and utilities (%)
Most Common Industries - Transportation and warehousing (%)
Most Common Industries - Utilities (%)
Most Common Industries - Information (%)
Most Common Industries - Finance and insurance, and real estate and rental and leasing (%)
Most Common Industries - Finance and insurance (%)
Most Common Industries - Real estate and rental and leasing (%)
Most Common Industries - Professional, scientific, and management, and administrative and waste management services (%)
Most Common Industries - Professional, scientific, and technical services (%)
Most Common Industries - Management of companies and enterprises (%)
Most Common Industries - Administrative and support and waste management services (%)
Most Common Industries - Educational services, and health care and social assistance (%)
Most Common Industries - Educational services (%)
Most Common Industries - Health care and social assistance (%)
Most Common Industries - Arts, entertainment, and recreation, and accommodation and food services (%)
Most Common Industries - Arts, entertainment, and recreation (%)
Most Common Industries - Accommodation and food services (%)
Most Common Industries - Other services, except public administration (%)
Most Common Industries - Public administration (%)
Occupation diversity
Most Common Occupations - Management, business, science, and arts occupations (%)
Most Common Occupations - Management, business, and financial occupations (%)
Most Common Occupations - Management occupations (%)
Most Common Occupations - Business and financial operations occupations (%)
Most Common Occupations - Computer, engineering, and science occupations (%)
Most Common Occupations - Computer and mathematical occupations (%)
Most Common Occupations - Architecture and engineering occupations (%)
Most Common Occupations - Life, physical, and social science occupations (%)
Most Common Occupations - Education, legal, community service, arts, and media occupations (%)
Most Common Occupations - Community and social service occupations (%)
Most Common Occupations - Legal occupations (%)
Most Common Occupations - Education, training, and library occupations (%)
Most Common Occupations - Arts, design, entertainment, sports, and media occupations (%)
Most Common Occupations - Healthcare practitioners and technical occupations (%)
Most Common Occupations - Health diagnosing and treating practitioners and other technical occupations (%)
Most Common Occupations - Health technologists and technicians (%)
Most Common Occupations - Service occupations (%)
Most Common Occupations - Healthcare support occupations (%)
Most Common Occupations - Protective service occupations (%)
Most Common Occupations - Fire fighting and prevention, and other protective service workers including supervisors (%)
Most Common Occupations - Law enforcement workers including supervisors (%)
Most Common Occupations - Food preparation and serving related occupations (%)
Most Common Occupations - Building and grounds cleaning and maintenance occupations (%)
Most Common Occupations - Personal care and service occupations (%)
Most Common Occupations - Sales and office occupations (%)
Most Common Occupations - Sales and related occupations (%)
Most Common Occupations - Office and administrative support occupations (%)
Most Common Occupations - Natural resources, construction, and maintenance occupations (%)
Most Common Occupations - Farming, fishing, and forestry occupations (%)
Most Common Occupations - Construction and extraction occupations (%)
Most Common Occupations - Installation, maintenance, and repair occupations (%)
Most Common Occupations - Production, transportation, and material moving occupations (%)
Most Common Occupations - Production occupations (%)
Most Common Occupations - Transportation occupations (%)
Most Common Occupations - Material moving occupations (%)
People in Group quarters - Institutionalized population (%)
People in Group quarters - Correctional institutions (%)
People in Group quarters - Federal prisons and detention centers (%)
People in Group quarters - Halfway houses (%)
People in Group quarters - Local jails and other confinement facilities (including police lockups) (%)
People in Group quarters - Military disciplinary barracks (%)
People in Group quarters - State prisons (%)
People in Group quarters - Other types of correctional institutions (%)
People in Group quarters - Nursing homes (%)
People in Group quarters - Hospitals/wards, hospices, and schools for the handicapped (%)
People in Group quarters - Hospitals/wards and hospices for chronically ill (%)
People in Group quarters - Hospices or homes for chronically ill (%)
People in Group quarters - Military hospitals or wards for chronically ill (%)
People in Group quarters - Other hospitals or wards for chronically ill (%)
People in Group quarters - Hospitals or wards for drug/alcohol abuse (%)
People in Group quarters - Mental (Psychiatric) hospitals or wards (%)
People in Group quarters - Schools, hospitals, or wards for the mentally retarded (%)
People in Group quarters - Schools, hospitals, or wards for the physically handicapped (%)
People in Group quarters - Institutions for the deaf (%)
People in Group quarters - Institutions for the blind (%)
People in Group quarters - Orthopedic wards and institutions for the physically handicapped (%)
People in Group quarters - Wards in general hospitals for patients who have no usual home elsewhere (%)
People in Group quarters - Wards in military hospitals for patients who have no usual home elsewhere (%)
People in Group quarters - Juvenile institutions (%)
People in Group quarters - Long-term care (%)
People in Group quarters - Homes for abused, dependent, and neglected children (%)
People in Group quarters - Residential treatment centers for emotionally disturbed children (%)
People in Group quarters - Training schools for juvenile delinquents (%)
People in Group quarters - Short-term care, detention or diagnostic centers for delinquent children (%)
People in Group quarters - Type of juvenile institution unknown (%)
People in Group quarters - Noninstitutionalized population (%)
People in Group quarters - College dormitories (includes college quarters off campus) (%)
People in Group quarters - Military quarters (%)
People in Group quarters - On base (%)
People in Group quarters - Barracks, unaccompanied personnel housing (UPH), (Enlisted/Officer), ;and similar group living quarters for military personnel (%)
People in Group quarters - Transient quarters for temporary residents (%)
People in Group quarters - Military ships (%)
People in Group quarters - Group homes (%)
People in Group quarters - Homes or halfway houses for drug/alcohol abuse (%)
People in Group quarters - Homes for the mentally ill (%)
People in Group quarters - Homes for the mentally retarded (%)
People in Group quarters - Homes for the physically handicapped (%)
People in Group quarters - Other group homes (%)
People in Group quarters - Religious group quarters (%)
People in Group quarters - Dormitories (%)
People in Group quarters - Agriculture workers' dormitories on farms (%)
People in Group quarters - Job Corps and vocational training facilities (%)
People in Group quarters - Other workers' dormitories (%)
People in Group quarters - Crews of maritime vessels (%)
People in Group quarters - Other nonhousehold living situations (%)
People in Group quarters - Other noninstitutional group quarters (%)
Residents speaking English at home (%)
Residents speaking English at home - Born in the United States (%)
Residents speaking English at home - Native, born elsewhere (%)
Residents speaking English at home - Foreign born (%)
Residents speaking Spanish at home (%)
Residents speaking Spanish at home - Born in the United States (%)
Residents speaking Spanish at home - Native, born elsewhere (%)
Residents speaking Spanish at home - Foreign born (%)
Residents speaking other language at home (%)
Residents speaking other language at home - Born in the United States (%)
Residents speaking other language at home - Native, born elsewhere (%)
Residents speaking other language at home - Foreign born (%)
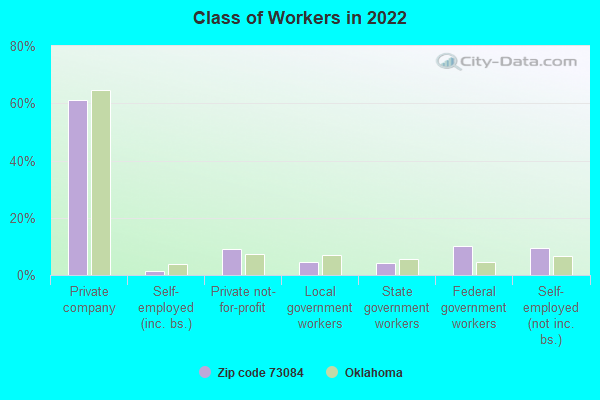
Class of Workers - Employee of private company (%)
Class of Workers - Self-employed in own incorporated business (%)
Class of Workers - Private not-for-profit wage and salary workers (%)
Class of Workers - Local government workers (%)
Class of Workers - State government workers (%)
Class of Workers - Federal government workers (%)
Class of Workers - Self-employed workers in own not incorporated business and Unpaid family workers (%)
House heating fuel used in houses and condos - Utility gas (%)
House heating fuel used in houses and condos - Bottled, tank, or LP gas (%)
House heating fuel used in houses and condos - Electricity (%)
House heating fuel used in houses and condos - Fuel oil, kerosene, etc. (%)
House heating fuel used in houses and condos - Coal or coke (%)
House heating fuel used in houses and condos - Wood (%)
House heating fuel used in houses and condos - Solar energy (%)
House heating fuel used in houses and condos - Other fuel (%)
House heating fuel used in houses and condos - No fuel used (%)
House heating fuel used in apartments - Utility gas (%)
House heating fuel used in apartments - Bottled, tank, or LP gas (%)
House heating fuel used in apartments - Electricity (%)
House heating fuel used in apartments - Fuel oil, kerosene, etc. (%)
House heating fuel used in apartments - Coal or coke (%)
House heating fuel used in apartments - Wood (%)
House heating fuel used in apartments - Solar energy (%)
House heating fuel used in apartments - Other fuel (%)
House heating fuel used in apartments - No fuel used (%)
Armed forces status - In Armed Forces (%)
Armed forces status - Civilian (%)
Armed forces status - Civilian - Veteran (%)
Armed forces status - Civilian - Nonveteran (%)
Fatal accidents locations in years 2005-2021
Fatal accidents locations in 2005
Fatal accidents locations in 2006
Fatal accidents locations in 2007
Fatal accidents locations in 2008
Fatal accidents locations in 2009
Fatal accidents locations in 2010
Fatal accidents locations in 2011
Fatal accidents locations in 2012
Fatal accidents locations in 2013
Fatal accidents locations in 2014
Fatal accidents locations in 2015
Fatal accidents locations in 2016
Fatal accidents locations in 2017
Fatal accidents locations in 2018
Fatal accidents locations in 2019
Fatal accidents locations in 2020
Fatal accidents locations in 2021
Alcohol use - People drinking some alcohol every month (%)
Alcohol use - People not drinking at all (%)
Alcohol use - Average days/month drinking alcohol
Alcohol use - Average drinks/week
Alcohol use - Average days/year people drink much
Audiometry - Average condition of hearing (%)
Audiometry - People that can hear a whisper from across a quiet room (%)
Audiometry - People that can hear normal voice from across a quiet room (%)
Audiometry - Ears ringing, roaring, buzzing (%)
Audiometry - Had a job exposure to loud noise (%)
Audiometry - Had off-work exposure to loud noise (%)
Blood Pressure & Cholesterol - Has high blood pressure (%)
Blood Pressure & Cholesterol - Checking blood pressure at home (%)
Blood Pressure & Cholesterol - Frequently checking blood cholesterol (%)
Blood Pressure & Cholesterol - Has high cholesterol level (%)
Consumer Behavior - Money monthly spent on food at supermarket/grocery store
Consumer Behavior - Money monthly spent on food at other stores
Consumer Behavior - Money monthly spent on eating out
Consumer Behavior - Money monthly spent on carryout/delivered foods
Consumer Behavior - Income spent on food at supermarket/grocery store (%)
Consumer Behavior - Income spent on food at other stores (%)
Consumer Behavior - Income spent on eating out (%)
Consumer Behavior - Income spent on carryout/delivered foods (%)
Current Health Status - General health condition (%)
Current Health Status - Blood donors (%)
Current Health Status - Has blood ever tested for HIV virus (%)
Current Health Status - Left-handed people (%)
Dermatology - People using sunscreen (%)
Diabetes - Diabetics (%)
Diabetes - Had a blood test for high blood sugar (%)
Diabetes - People taking insulin (%)
Diet Behavior & Nutrition - Diet health (%)
Diet Behavior & Nutrition - Milk product consumption (# of products/month)
Diet Behavior & Nutrition - Meals not home prepared (#/week)
Diet Behavior & Nutrition - Meals from fast food or pizza place (#/week)
Diet Behavior & Nutrition - Ready-to-eat foods (#/month)
Diet Behavior & Nutrition - Frozen meals/pizza (#/month)
Drug Use - People that ever used marijuana or hashish (%)
Drug Use - Ever used hard drugs (%)
Drug Use - Ever used any form of cocaine (%)
Drug Use - Ever used heroin (%)
Drug Use - Ever used methamphetamine (%)
Health Insurance - People covered by health insurance (%)
Kidney Conditions-Urology - Avg. # of times urinating at night
Medical Conditions - People with asthma (%)
Medical Conditions - People with anemia (%)
Medical Conditions - People with psoriasis (%)
Medical Conditions - People with overweight (%)
Medical Conditions - Elderly people having difficulties in thinking or remembering (%)
Medical Conditions - People who ever received blood transfusion (%)
Medical Conditions - People having trouble seeing even with glass/contacts (%)
Medical Conditions - People with arthritis (%)
Medical Conditions - People with gout (%)
Medical Conditions - People with congestive heart failure (%)
Medical Conditions - People with coronary heart disease (%)
Medical Conditions - People with angina pectoris (%)
Medical Conditions - People who ever had heart attack (%)
Medical Conditions - People who ever had stroke (%)
Medical Conditions - People with emphysema (%)
Medical Conditions - People with thyroid problem (%)
Medical Conditions - People with chronic bronchitis (%)
Medical Conditions - People with any liver condition (%)
Medical Conditions - People who ever had cancer or malignancy (%)
Mental Health - People who have little interest in doing things (%)
Mental Health - People feeling down, depressed, or hopeless (%)
Mental Health - People who have trouble sleeping or sleeping too much (%)
Mental Health - People feeling tired or having little energy (%)
Mental Health - People with poor appetite or overeating (%)
Mental Health - People feeling bad about themself (%)
Mental Health - People who have trouble concentrating on things (%)
Mental Health - People moving or speaking slowly or too fast (%)
Mental Health - People having thoughts they would be better off dead (%)
Oral Health - Average years since last visit a dentist
Oral Health - People embarrassed because of mouth (%)
Oral Health - People with gum disease (%)
Oral Health - General health of teeth and gums (%)
Oral Health - Average days a week using dental floss/device
Oral Health - Average days a week using mouthwash for dental problem
Oral Health - Average number of teeth
Pesticide Use - Households using pesticides to control insects (%)
Pesticide Use - Households using pesticides to kill weeds (%)
Physical Activity - People doing vigorous-intensity work activities (%)
Physical Activity - People doing moderate-intensity work activities (%)
Physical Activity - People walking or bicycling (%)
Physical Activity - People doing vigorous-intensity recreational activities (%)
Physical Activity - People doing moderate-intensity recreational activities (%)
Physical Activity - Average hours a day doing sedentary activities
Physical Activity - Average hours a day watching TV or videos
Physical Activity - Average hours a day using computer
Physical Functioning - People having limitations keeping them from working (%)
Physical Functioning - People limited in amount of work they can do (%)
Physical Functioning - People that need special equipment to walk (%)
Physical Functioning - People experiencing confusion/memory problems (%)
Physical Functioning - People requiring special healthcare equipment (%)
Prescription Medications - Average number of prescription medicines taking
Preventive Aspirin Use - Adults 40+ taking low-dose aspirin (%)
Reproductive Health - Vaginal deliveries (%)
Reproductive Health - Cesarean deliveries (%)
Reproductive Health - Deliveries resulted in a live birth (%)
Reproductive Health - Pregnancies resulted in a delivery (%)
Reproductive Health - Women breastfeeding newborns (%)
Reproductive Health - Women that had a hysterectomy (%)
Reproductive Health - Women that had both ovaries removed (%)
Reproductive Health - Women that have ever taken birth control pills (%)
Reproductive Health - Women taking birth control pills (%)
Reproductive Health - Women that have ever used Depo-Provera or injectables (%)
Reproductive Health - Women that have ever used female hormones (%)
Sexual Behavior - People 18+ that ever had sex (vaginal, anal, or oral) (%)
Sexual Behavior - Males 18+ that ever had vaginal sex with a woman (%)
Sexual Behavior - Males 18+ that ever performed oral sex on a woman (%)
Sexual Behavior - Males 18+ that ever had anal sex with a woman (%)
Sexual Behavior - Males 18+ that ever had any sex with a man (%)
Sexual Behavior - Females 18+ that ever had vaginal sex with a man (%)
Sexual Behavior - Females 18+ that ever performed oral sex on a man (%)
Sexual Behavior - Females 18+ that ever had anal sex with a man (%)
Sexual Behavior - Females 18+ that ever had any kind of sex with a woman (%)
Sexual Behavior - Average age people first had sex
Sexual Behavior - Average number of female sex partners in lifetime (males 18+)
Sexual Behavior - Average number of female vaginal sex partners in lifetime (males 18+)
Sexual Behavior - Average age people first performed oral sex on a woman (18+)
Sexual Behavior - Average number of woman performed oral sex on in lifetime (18+)
Sexual Behavior - Average number of male sex partners in lifetime (males 18+)
Sexual Behavior - Average number of male anal sex partners in lifetime (males 18+)
Sexual Behavior - Average age people first performed oral sex on a man (18+)
Sexual Behavior - Average number of male oral sex partners in lifetime (18+)
Sexual Behavior - People using protection when performing oral sex (%)
Sexual Behavior - Average number of times people have vaginal or anal sex a year
Sexual Behavior - People having sex without condom (%)
Sexual Behavior - Average number of male sex partners in lifetime (females 18+)
Sexual Behavior - Average number of male vaginal sex partners in lifetime (females 18+)
Sexual Behavior - Average number of female sex partners in lifetime (females 18+)
Sexual Behavior - Circumcised males 18+ (%)
Sleep Disorders - Average hours sleeping at night
Sleep Disorders - People that has trouble sleeping (%)
Smoking-Cigarette Use - People smoking cigarettes (%)
Taste & Smell - People 40+ having problems with smell (%)
Taste & Smell - People 40+ having problems with taste (%)
Taste & Smell - People 40+ that ever had wisdom teeth removed (%)
Taste & Smell - People 40+ that ever had tonsils teeth removed (%)
Taste & Smell - People 40+ that ever had a loss of consciousness because of a head injury (%)
Taste & Smell - People 40+ that ever had a broken nose or other serious injury to face or skull (%)
Taste & Smell - People 40+ that ever had two or more sinus infections (%)
Weight - Average height (inches)
Weight - Average weight (pounds)
Weight - Average BMI
Weight - People that are obese (%)
Weight - People that ever were obese (%)
Weight - People trying to lose weight (%)
Urban population: 4,656
Rural population: 1,406
Estimated median house/condo value in 2022: $128,512
73084:
$128,512Oklahoma:
$191,700
Median resident age: This zip code:
42.0 yearsOklahoma median age:
37.1 years
Average household size: This zip code:
2.3 peopleOklahoma:
2.5 people
Averages for the 2020 tax year for zip code 73084, filed in 2021:
Average Adjusted Gross Income (AGI) in 2020: $34,726 (Individual Income Tax Returns) Here:
$34,726State:
$63,060
Salary/wage: $32,038 (reported on 80.3% of returns )Here:
$32,038State:
$52,427
(% of AGI for various income ranges: 1099.2% for AGIs below $25k , 3704.0% for AGIs $25k-50k , 6381.6% for AGIs $50k-75k , 10367.8% for AGIs $75k-100k , 20964.0% for AGIs $100k-200k ) Taxable interest for individuals: $330 (reported on 15.9% of returns )This zip code:
$330Oklahoma:
$1,603
(% of AGI for various income ranges: 4.9% for AGIs below $25k , 4.9% for AGIs $25k-50k , 10.4% for AGIs $50k-75k , 17.8% for AGIs $75k-100k , 48.0% for AGIs $100k-200k ) Ordinary dividends: $570 (reported on 3.4% of returns )(% of AGI for various income ranges: 2.0% for AGIs $25k-50k , 4.8% for AGIs $50k-75k , 60.0% for AGIs $100k-200k ) Net capital gain/loss in AGI: +$3,700 (reported on 4.1% of returns )Here:
+$3,700State:
+$19,855
(% of AGI for various income ranges: 5.7% for AGIs $25k-50k , 30.4% for AGIs $50k-75k , 658.0% for AGIs $100k-200k ) Profit/loss from business: +$3,575 (reported on 17.6% of returns )Here:
+$3,575State:
+$9,904
(% of AGI for various income ranges: 93.5% for AGIs below $25k , 60.0% for AGIs $25k-50k , 164.8% for AGIs $50k-75k , 8.9% for AGIs $75k-100k , 18.0% for AGIs $100k-200k ) Taxable individual retirement arrangement distribution: $11,791 (reported on 3.8% of returns )73084:
$11,791Oklahoma:
$20,476
(% of AGI for various income ranges: 31.4% for AGIs below $25k , 42.4% for AGIs $25k-50k , 144.4% for AGIs $50k-75k , 334.4% for AGIs $75k-100k ) Total itemized deductions: $26,345 (reported on 3.8% of returns )Here:
$26,345State:
$39,736
(% of AGI for various income ranges: 99.5% for AGIs $25k-50k , 477.2% for AGIs $50k-75k , 1918.0% for AGIs $100k-200k ) Charity contributions: $8,689 (reported on 3.1% of returns )(% of AGI for various income ranges: 24.7% for AGIs $25k-50k , 93.6% for AGIs $50k-75k , 403.3% for AGIs $75k-100k ) Taxes paid: $4,600 (reported on 3.4% of returns )(% of AGI for various income ranges: 15.2% for AGIs $25k-50k , 74.0% for AGIs $50k-75k , 322.0% for AGIs $100k-200k ) Earned income credit: $2,476 (reported on 31.7% of returns )(% of AGI for various income ranges: 151.0% for AGIs below $25k , 100.4% for AGIs $25k-50k ) Percentage of individuals using paid preparers for their 2020 taxes: 93.1%(% for various income ranges: 93.1% for AGIs below $25k , 92.8% for AGIs $25k-50k , 94.4% for AGIs $50k-75k , 93.3% for AGIs $75k-100k , 90.9% for AGIs $100k-200k )
Averages for the 2012 tax year for zip code 73084, filed in 2013:
Average Adjusted Gross Income (AGI) in 2012: $30,605 (Individual Income Tax Returns) Here:
$30,605State:
$58,581
Salary/wage: $27,357 (reported on 83.4% of returns )Here:
$27,357State:
$45,973
(% of AGI for various income ranges: 76.8% for AGIs below $25k , 80.1% for AGIs $25k-50k , 72.9% for AGIs $50k-75k , 69.6% for AGIs $75k-100k , 60.2% for AGIs $100k-200k ) Taxable interest for individuals: $462 (reported on 15.5% of returns )This zip code:
$462Oklahoma:
$1,625
(% of AGI for various income ranges: 0.3% for AGIs below $25k , 0.2% for AGIs $25k-50k , 0.3% for AGIs $50k-75k , 0.1% for AGIs $75k-100k , 0.2% for AGIs $100k-200k ) Ordinary dividends: $3,100 (reported on 5.5% of returns )(% of AGI for various income ranges: 1.1% for AGIs below $25k , 0.8% for AGIs $25k-50k , 0.2% for AGIs $75k-100k ) Net capital gain/loss in AGI: +$2,938 (reported on 2.8% of returns )Here:
+$2,938State:
+$24,023
(% of AGI for various income ranges: 0.1% for AGIs $25k-50k , 1.0% for AGIs $50k-75k ) Profit/loss from business: +$5,632 (reported on 13.8% of returns )Here:
+$5,632State:
+$11,913
(% of AGI for various income ranges: 6.9% for AGIs below $25k , 1.4% for AGIs $25k-50k , 1.8% for AGIs $50k-75k , 0.9% for AGIs $75k-100k ) Taxable individual retirement arrangement distribution: $9,538 (reported on 4.5% of returns )73084:
$9,538Oklahoma:
$15,242
(% of AGI for various income ranges: 0.8% for AGIs below $25k , 1.1% for AGIs $25k-50k , 3.9% for AGIs $50k-75k ) Total itemized deductions: $16,651 (30% of AGI, reported on 18.3% of returns )Here:
$16,651State:
$24,882
Here:
29.7% of AGIState:
18.8% of AGI
(% of AGI for various income ranges: 5.6% for AGIs below $25k , 8.0% for AGIs $25k-50k , 13.0% for AGIs $50k-75k , 13.1% for AGIs $75k-100k , 16.4% for AGIs $100k-200k ) Charity contributions: $4,993 (reported on 15.2% of returns )(% of AGI for various income ranges: 1.1% for AGIs below $25k , 1.8% for AGIs $25k-50k , 3.6% for AGIs $50k-75k , 4.6% for AGIs $75k-100k , 3.4% for AGIs $100k-200k ) Taxes paid: $2,919 (reported on 18.3% of returns )(% of AGI for various income ranges: 0.7% for AGIs below $25k , 1.3% for AGIs $25k-50k , 2.3% for AGIs $50k-75k , 2.8% for AGIs $75k-100k , 3.3% for AGIs $100k-200k ) Earned income credit: $2,605 (reported on 36.9% of returns )(% of AGI for various income ranges: 11.2% for AGIs below $25k , 1.6% for AGIs $25k-50k ) Percentage of individuals using paid preparers for their 2012 taxes: 54.1%(% for various income ranges: 51.6% for AGIs below $25k , 51.7% for AGIs $25k-50k , 64.5% for AGIs $50k-75k , 70.0% for AGIs $75k-100k , 71.4% for AGIs $100k-200k )
Averages for the 2004 tax year for zip code 73084, filed in 2005:
Average Adjusted Gross Income (AGI) in 2004: $26,207 (Individual Income Tax Returns) Here:
$26,207State:
$41,245
Salary/wage: $24,611 (reported on 84.5% of returns )Here:
$24,611State:
$35,318
(% of AGI for various income ranges: 84.7% for AGIs below $10k , 78.1% for AGIs $10k-25k , 83.2% for AGIs $25k-50k , 75.0% for AGIs $50k-75k , 83.9% for AGIs $75k-100k , 67.3% for AGIs over 100k ) Taxable interest for individuals: $833 (reported on 23.3% of returns )This zip code:
$833Oklahoma:
$1,745
(% of AGI for various income ranges: 1.2% for AGIs below $10k , 0.5% for AGIs $10k-25k , 0.7% for AGIs $25k-50k , 1.0% for AGIs $50k-75k , 1.0% for AGIs $75k-100k , 0.5% for AGIs over 100k ) Taxable dividends: $894 (reported on 7.4% of returns )(% of AGI for various income ranges: 0.1% for AGIs below $10k , 0.2% for AGIs $10k-25k , 0.2% for AGIs $25k-50k , 0.4% for AGIs $50k-75k , 0.9% for AGIs over 100k ) Net capital gain/loss: +$959 (reported on 4.5% of returns )(% of AGI for various income ranges: -0.3% for AGIs below $10k , -0.1% for AGIs $10k-25k , 0.0% for AGIs $25k-50k , 1.1% for AGIs $50k-75k , -0.3% for AGIs over 100k ) Profit/loss from business: +$2,259 (reported on 13.2% of returns )Here:
+$2,259State:
+$8,532
(% of AGI for various income ranges: 4.5% for AGIs below $10k , 2.7% for AGIs $10k-25k , 0.9% for AGIs $25k-50k , 0.3% for AGIs $50k-75k , -1.0% for AGIs $75k-100k ) IRA payment deduction: $1,381 (reported on 0.8% of returns )73084:
$1,381Oklahoma:
$3,127
Total itemized deductions: $12,529 (27% of AGI, reported on 22.3% of returns )Here:
$12,529State:
$17,093
Here:
26.6% of AGIState:
20.5% of AGI
(% of AGI for various income ranges: 6.3% for AGIs below $10k , 6.5% for AGIs $10k-25k , 11.0% for AGIs $25k-50k , 13.6% for AGIs $50k-75k , 14.6% for AGIs $75k-100k , 12.3% for AGIs over 100k ) Charity contributions deductions: $4,028 (8% of AGI, reported on 20.3% of returns )Here:
8.3% of AGIState:
4.8% of AGI
(% of AGI for various income ranges: 0.9% for AGIs below $10k , 1.6% for AGIs $10k-25k , 3.1% for AGIs $25k-50k , 4.3% for AGIs $50k-75k , 5.1% for AGIs $75k-100k , 3.8% for AGIs over 100k ) Total tax: $2,931 (reported on 60.7% of returns )(% of AGI for various income ranges: 1.9% for AGIs below $10k , 3.0% for AGIs $10k-25k , 5.9% for AGIs $25k-50k , 9.3% for AGIs $50k-75k , 10.0% for AGIs $75k-100k , 15.5% for AGIs over 100k ) Earned income credit: $2,011 (reported on 36.3% of returns )Percentage of individuals using paid preparers for their 2004 taxes: 69.0%(% for various income ranges: 66.6% for AGIs below $10k , 73.8% for AGIs $10k-25k , 65.4% for AGIs $25k-50k , 62.8% for AGIs $50k-75k , 73.9% for AGIs $75k-100k , 85.0% for AGIs over 100k )
Estimated median household income in 2022: This zip code:
$48,692Oklahoma:
$59,673
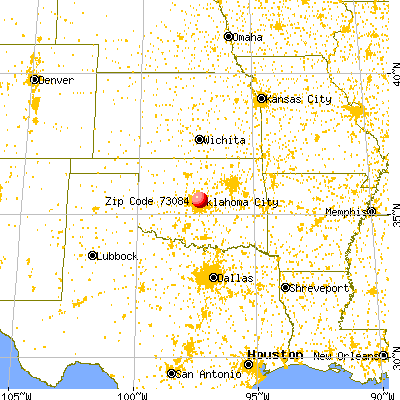
Nearest zip codes: 73066 ,
73141 ,
73130 ,
73049 ,
73110 ,
73151 .
Spencer Zip Code Map
Percentage of family households: This zip code:
39.5%Oklahoma:
47.1%
Percentage of households with unmarried partners: This zip code:
5.5%Oklahoma:
47.5%
Likely homosexual households (counted as self-reported same-sex unmarried-partner households)
Lesbian couples: 0.0% of all households Gay men: 1.1% of all households
Household received Food Stamps/SNAP in the past 12 months: 716Household did not receive Food Stamps/SNAP in the past 12 months: 2,020
Women who had a birth in the past 12 months: 54 (31 now married , 22 unmarried) Women who did not have a birth in the past 12 months: 982 (400 now married , 581 unmarried)
Housing units in zip code 73084 with a mortgage: 846 (24
second mortgage , 9
both second mortgage and home equity loan )
Houses without a mortgage: 27
Median monthly owner costs for units with a mortgage: $1,105
Median monthly owner costs for units without a mortgage: $344
Residents with income below the poverty level in 2022:
This zip code:
19.8%Whole state:
15.7%
Residents with income below 50% of the poverty level in 2022:
This zip code:
14.6%Whole state:
8.3%
Median number of rooms in houses and condos: Median number of rooms in apartments: Notable locations in this zip code not listed on our city pages
Click to draw/clear zip code borders Notable locations in zip code 73084: (A) , Spencer Fire Department (B) , Oklahoma City Fire Department Station 27 (C) . Display/hide their locations on the map
Churches in zip code 73084 include: (A) , True Love First Baptist Church (B) , Saint Pauls Baptist Church (C) , Saint Luke Baptist Church (D) , Saint Johns CME Church (E) , Saint James Baptist Church (F) , Spencer Road Free Will Baptist Church (G) , Spencer Church of Christ (H) , Reigning Life Assembly of God (I) . Display/hide their locations on the map
Cemeteries: (1) , Hillcrest Memory Gardens (2) , Kolb Cemetery (3) , Ewing Cemetery (4) , Oaklawn Memorial Gardens (5) . Display/hide their locations on the map
Park in zip code 73084: (1) . Display/hide its location on the map
Year house built (houses)
43 2020 or later218 2010 to 2019325 2000 to 2009201 1990 to 1999573 1980 to 1989381 1970 to 1979551 1960 to 1969470 1950 to 1959206 1940 to 194936 1939 or earlier
Zip code 73084 household income distribution in 2022 142 Less than $10,000189 $10,000 to $14,999131 $15,000 to $19,999395 $20,000 to $24,99954 $25,000 to $29,999186 $30,000 to $34,999116 $35,000 to $39,999159 $40,000 to $44,99958 $45,000 to $49,999231 $50,000 to $59,999320 $60,000 to $74,999458 $75,000 to $99,999102 $100,000 to $124,999123 $125,000 to $149,99934 $150,000 to $199,99940 $200,000 or moreEstimate of home value of owner-occupied houses/condos in 2022 in zip code 73084 58 Less than $10,0006 $10,000 to $14,99931 $15,000 to $19,99931 $20,000 to $24,99962 $30,000 to $34,99922 $35,000 to $39,99984 $40,000 to $49,99930 $50,000 to $59,99958 $60,000 to $69,99945 $70,000 to $79,999100 $80,000 to $89,99997 $90,000 to $99,999351 $100,000 to $124,999136 $125,000 to $149,999124 $150,000 to $174,99996 $175,000 to $199,99972 $200,000 to $249,999143 $250,000 to $299,999126 $300,000 to $399,9997 $400,000 to $499,99973 $500,000 to $749,9993 $750,000 to $999,9995 $1,000,000 to $1,499,999Rent paid by renters in 2022 in zip code 73084 9 $100 to $149242 $150 to $1991 $200 to $24928 $350 to $39911 $450 to $49911 $500 to $54913 $550 to $59924 $600 to $64925 $650 to $69940 $700 to $74970 $750 to $799115 $800 to $89956 $900 to $99967 $1,000 to $1,2499 $1,250 to $1,49999 No cash rent
Median gross rent in 2022: $908.
Median price asked for vacant for-sale houses and condos in 2022: $131,672.
Estimated median house (or condo) value in 2022 for: White Non-Hispanic householders: $133,425Black or African American householders: $131,614American Indian or Alaska Native householders: $61,799Asian householders: $219,789Two or more races householders: $170,142Hispanic or Latino householders: $82,744Estimated median house or condo value in 2022: $128,512
73084:
$128,512Oklahoma:
$191,700
Lower value quartile - upper value quartile: $89,652 - $195,603
Mean price in 2022: Detached houses: $274,748Here:
$274,748State:
$255,409
Townhouses or other attached units: $249,137Here:
$249,137State:
$206,466
In 2-unit structures: $165,980Here:
$165,980State:
$195,100
In 3-to-4-unit structures: $117,600Here:
$117,600State:
$140,612
In 5-or-more-unit structures: $252,687Here:
$252,687State:
$233,805
Mobile homes: $96,211Here:
$96,211State:
$110,804
Occupied boats, RVs, vans, etc.: $130,680Here:
$130,680State:
$68,690
Housing units in structures:
One, detached: 2,507One, attached: 83 or 4: 405 to 9: 24950 or more: 19Mobile homes: 231Boats, RVs, vans, etc.: 12Unemployment : 6.0%
Means of transportation to work in zip code 73084 83.1% 1,983 Drove a car alone7.1% 170 Carpooled0.5% 11 Walked0.4% 9 Other means8.6% 205 Worked at homeTravel time to work (commute) in zip code 73084 5 Less than 5 minutes122 5 to 9 minutes227 10 to 14 minutes423 15 to 19 minutes343 20 to 24 minutes193 25 to 29 minutes443 30 to 34 minutes86 35 to 39 minutes123 40 to 44 minutes147 45 to 59 minutes17 60 to 89 minutes36 90 or more minutes
Percentage of zip code residents living and working in this county: 93.5%
Household type by relationship:
Households: 6,063
Male householders: 1,139 (427 living alone ), Female householders: 1,556 (606 living alone )907 spouses (907 opposite-sex spouses ), 88 unmarried partners , (55 opposite-sex unmarried partners ), 1,713 children (1,549 natural , 118 adopted , 45 stepchildren ), 299 grandchildren , 99 brothers or sisters , 141 parents , 0 foster children , 49 other relatives , 66 non-relatives In group quarters: 11 (-1 institutionalized population )
Size of family households: 785 2-persons , 332 3-persons , 161 4-persons , 249 5-persons , 53 6-persons , 18 7-or-more-persons
Size of nonfamily households: 1,033 1-person , 30 2-persons , 5 3-persons
781 married couples with children. single-parent households (89 men , 337 women ).
88.1% of residents of 73084 zip code speak English at home. of residents speak Spanish at home (65% very well, 12% well, 14% not well, 8% not at all ).of residents speak other language at home (100% very well ).
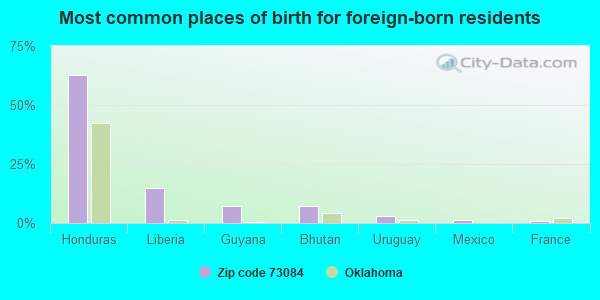
Foreign born population: 342 (5.6%)
(43.5%
of them are naturalized citizens )
This zip code:
5.6%Whole state:
6.0%
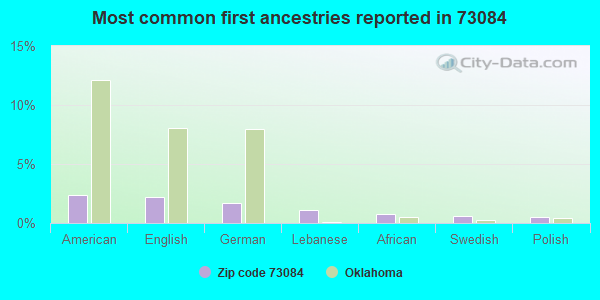
63% Honduras 15% Liberia 7% Guyana 7% Bhutan 3% Uruguay 1% Mexico 1% France 2% American 2% English 2% German 1% Lebanese 1% African 1% Swedish 1% Polish
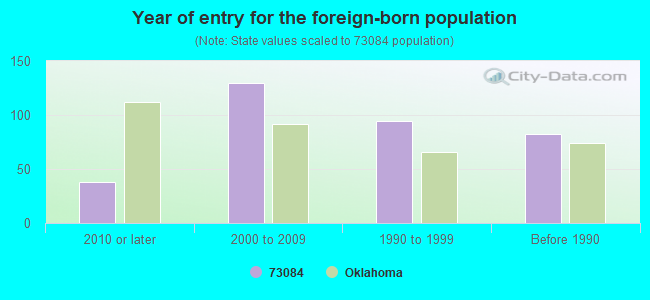
Year of entry for the foreign-born population
38 2010 or later 130 2000 to 2009 94 1990 to 1999 82 Before 1990
Facilities with environmental interests located in this zip code:
GREEN PASTURES ES (4300 N. POST RD. in SPENCER, OK)
(National Center for Education Statistics) - STATE ID-55-I089-244 Organizations: OKLAHOMA CITY (SCHOOL DISTRICT)
CHOCTAW READY MIX/CHOCTAW READY MIX SP (2540 LIBERTY in SPENCER, OK)
AIR MINOR (AIRS/AFS) Business SIC classification: READY-MIXED CONCRETE
CITY OF SPENCER (P.O. BOX 660 in SPENCER, OK)
National Pollutant Discharge Elimination System NON-MAJOR (Tracking pollutant discharge elimination systems) - permit Business SIC classification: SEWERAGE SYSTEMSAlternative names: SPENCER, CITY OF
GOSPEL TABERNACLE ACADEMY (9115 NE 36TH in SPENCER, OK)
COMPLIANCE ACTIVITY (Tracking inspections of insecticide, fungicide, and rodenticide, and toxic substances) STATE MASTER (Oklahoma environmental compliance activities data) Alternative names: GOSPEL TABERNACLE MHP
Housing units lacking complete plumbing facilities: 5.9%
Housing units lacking complete kitchen facilities: 8.0%
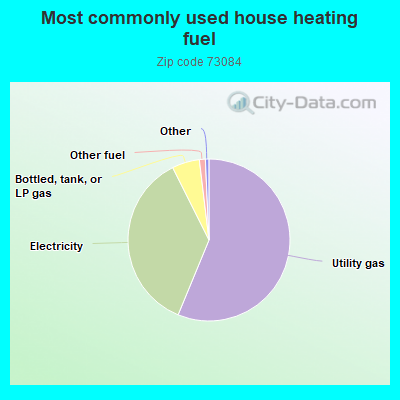
56.3% Utility gas 36.4% Electricity 5.5% Bottled, tank, or LP gas 1.2% Other fuel
Population in 1990: 7,675.
Place of birth for U.S.-born residents:
This state: 4,063Northeast: 137Midwest: 389South: 741West: 359
64% of the 73084 zip code residents lived in the same house 5 years ago.
Out of people who lived in different houses, 66% lived in this county.
Out of people who lived in different counties, 50% lived in Oklahoma.
93% of the 73084 zip code residents lived in the same house 1 year ago.
Out of people who lived in different houses, 65% moved from this county.
Out of people who lived in different houses, 15% moved from different county within same state.
Out of people who lived in different houses, 20% moved from different state.
Out of people who lived in different houses, 3% moved from abroad.
Private vs. public school enrollment:
Students in private schools in grades 1 to 8 (elementary and middle school): 41
Students in private schools in grades 9 to 12 (high school): 28
Students in private undergraduate colleges: 52
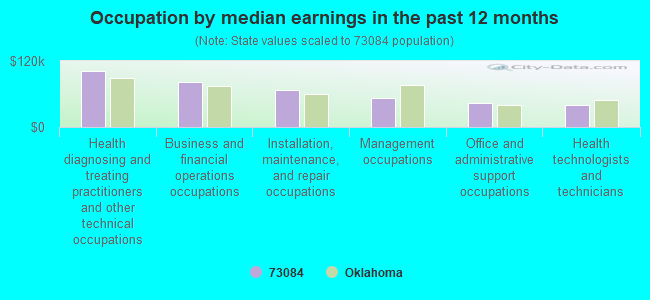
Occupation by median earnings in the past 12 months ($)
102,502 Health diagnosing and treating practitioners and other technical occupations 81,261 Business and financial operations occupations 67,644 Installation, maintenance, and repair occupations 52,650 Management occupations 43,318 Office and administrative support occupations 40,869 Health technologists and technicians
Top industries in this zip code by the number of employees in 2005:
Health Care and Social Assistance: All Other Outpatient Care Centers (100-249 employees: 1 establishment)Other Services (except Public Administration): Religious Organizations (10-19: 1, 5-9: 3, 1-4: 5)Finance and Insurance: Commercial Banking (20-49: 1)Construction: Electrical Contractors (10-19: 1, 5-9: 1, 1-4: 3)Educational Services: Elementary and Secondary Schools (10-19: 1, 5-9: 1)Other Services (except Public Administration): Cemeteries and Crematories (10-19: 1, 1-4: 1)Health Care and Social Assistance: Child Day Care Services (10-19: 1, 1-4: 1)Construction: Plumbing, Heating, and Air-Conditioning Contractors (5-9: 1)
People in group quarters in 2010:
97 people in mental (psychiatric) hospitals and psychiatric units in other hospitals
People in group quarters in 2000:
56 people in mental (psychiatric) hospitals or wards
19 people in hospitals/wards and hospices for chronically ill
19 people in other hospitals or wards for chronically ill
Fatal accident statistics in 2014:
Fatal accident count: 1Vehicles involved in fatal accidents: 1Fatal accidents caused by drunken drivers: 0Fatalities: 1Persons involved in fatal accidents: 2Pedestrians involved in fatal accidents: 0
Fatal accident statistics in 2012:
Fatal accident count: 2Vehicles involved in fatal accidents: 2Fatal accidents caused by drunken drivers: 1Fatalities: 2Persons involved in fatal accidents: 3Pedestrians involved in fatal accidents: 0
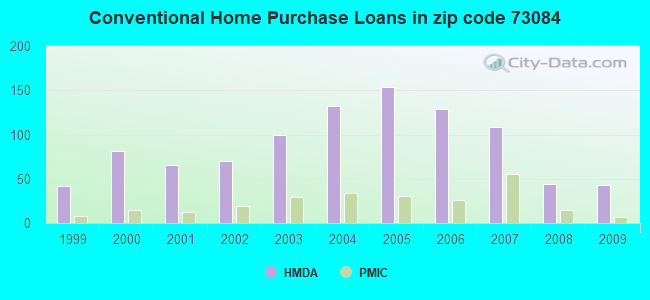
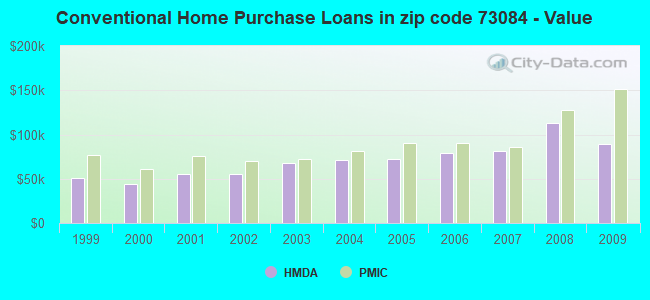
Home Mortgage Disclosure Act Aggregated Statistics For Year 2009(Based on 2 full and 10 partial tracts) A) FHA, FSA/RHS & VA B) Conventional C) Refinancings D) Home Improvement Loans F) Non-occupant Loans on G) Loans On Manufactured Number Average Value Number Average Value Number Average Value Number Average Value Number Average Value Number Average Value
LOANS ORIGINATED 63 $115,772 43 $89,149 118 $111,162 89 $15,880 28 $67,538 17 $36,659 APPLICATIONS APPROVED, NOT ACCEPTED 4 $106,432 12 $85,665 12 $84,004 5 $38,134 1 $54,800 2 $31,955 APPLICATIONS DENIED 13 $81,751 24 $68,592 91 $83,700 60 $21,744 13 $38,384 11 $61,665 APPLICATIONS WITHDRAWN 4 $113,805 4 $86,265 38 $114,180 4 $76,485 3 $71,893 1 $35,720 FILES CLOSED FOR INCOMPLETENESS 1 $68,100 3 $45,907 10 $90,488 2 $535,510 0 $0 1 $39,090
Aggregated Statistics For Year 2008(Based on 2 full and 10 partial tracts) A) FHA, FSA/RHS & VA B) Conventional C) Refinancings D) Home Improvement Loans E) Loans on Dwellings For 5+ Families F) Non-occupant Loans on G) Loans On Manufactured Number Average Value Number Average Value Number Average Value Number Average Value Number Average Value Number Average Value Number Average Value
LOANS ORIGINATED 54 $115,031 44 $112,805 96 $90,211 65 $17,370 1 $629,000 41 $81,996 11 $36,097 APPLICATIONS APPROVED, NOT ACCEPTED 3 $125,237 2 $56,935 18 $75,678 9 $23,474 0 $0 1 $26,100 2 $41,145 APPLICATIONS DENIED 18 $102,902 21 $79,406 172 $80,334 75 $35,522 0 $0 15 $40,285 7 $45,891 APPLICATIONS WITHDRAWN 4 $92,520 9 $85,010 51 $90,522 14 $51,604 0 $0 3 $31,700 1 $99,750 FILES CLOSED FOR INCOMPLETENESS 0 $0 1 $30,760 3 $119,650 3 $33,497 0 $0 0 $0 0 $0
Aggregated Statistics For Year 2007(Based on 2 full and 10 partial tracts) A) FHA, FSA/RHS & VA B) Conventional C) Refinancings D) Home Improvement Loans E) Loans on Dwellings For 5+ Families F) Non-occupant Loans on G) Loans On Manufactured Number Average Value Number Average Value Number Average Value Number Average Value Number Average Value Number Average Value Number Average Value
LOANS ORIGINATED 22 $106,249 109 $81,836 133 $77,118 82 $21,475 1 $536,410 57 $52,915 7 $40,334 APPLICATIONS APPROVED, NOT ACCEPTED 4 $96,205 16 $77,049 40 $82,458 4 $23,932 0 $0 4 $59,435 3 $71,677 APPLICATIONS DENIED 1 $112,170 52 $70,607 202 $83,285 89 $30,718 0 $0 19 $46,983 14 $56,409 APPLICATIONS WITHDRAWN 3 $80,573 14 $74,464 90 $92,335 11 $50,946 0 $0 9 $55,344 1 $86,440 FILES CLOSED FOR INCOMPLETENESS 0 $0 5 $66,910 27 $107,322 2 $54,880 0 $0 4 $62,842 0 $0
Aggregated Statistics For Year 2006(Based on 2 full and 10 partial tracts) A) FHA, FSA/RHS & VA B) Conventional C) Refinancings D) Home Improvement Loans E) Loans on Dwellings For 5+ Families F) Non-occupant Loans on G) Loans On Manufactured Number Average Value Number Average Value Number Average Value Number Average Value Number Average Value Number Average Value Number Average Value
LOANS ORIGINATED 40 $97,766 129 $79,499 170 $69,919 87 $25,377 0 $0 55 $47,262 4 $65,262 APPLICATIONS APPROVED, NOT ACCEPTED 0 $0 31 $74,566 36 $77,146 8 $22,308 0 $0 8 $90,518 9 $53,678 APPLICATIONS DENIED 4 $92,318 93 $69,904 302 $76,285 113 $25,755 2 $5,995 32 $50,005 14 $45,569 APPLICATIONS WITHDRAWN 2 $74,075 25 $66,518 139 $83,906 27 $53,912 0 $0 10 $51,160 1 $73,870 FILES CLOSED FOR INCOMPLETENESS 0 $0 7 $64,621 24 $88,947 0 $0 0 $0 2 $32,705 2 $88,920
Aggregated Statistics For Year 2005(Based on 2 full and 10 partial tracts) A) FHA, FSA/RHS & VA B) Conventional C) Refinancings D) Home Improvement Loans F) Non-occupant Loans on G) Loans On Manufactured Number Average Value Number Average Value Number Average Value Number Average Value Number Average Value Number Average Value
LOANS ORIGINATED 35 $90,737 154 $71,777 200 $75,514 79 $27,325 48 $50,998 9 $86,399 APPLICATIONS APPROVED, NOT ACCEPTED 4 $64,615 42 $70,077 44 $67,230 7 $55,116 5 $56,496 10 $45,373 APPLICATIONS DENIED 6 $77,583 80 $64,167 320 $72,626 110 $30,225 28 $53,594 26 $70,035 APPLICATIONS WITHDRAWN 7 $7,354,239 49 $66,387 190 $81,881 28 $117,985 18 $61,848 3 $65,707 FILES CLOSED FOR INCOMPLETENESS 2 $71,230 7 $79,907 21 $88,314 1 $13,980 0 $0 0 $0
Aggregated Statistics For Year 2004(Based on 2 full and 10 partial tracts) A) FHA, FSA/RHS & VA B) Conventional C) Refinancings D) Home Improvement Loans F) Non-occupant Loans on G) Loans On Manufactured Number Average Value Number Average Value Number Average Value Number Average Value Number Average Value Number Average Value
LOANS ORIGINATED 48 $82,389 132 $70,782 224 $68,071 83 $22,336 74 $47,903 16 $40,926 APPLICATIONS APPROVED, NOT ACCEPTED 1 $130,850 24 $73,579 54 $59,224 5 $29,614 9 $42,218 3 $75,493 APPLICATIONS DENIED 10 $70,514 52 $55,401 275 $66,378 78 $25,025 15 $36,160 20 $31,440 APPLICATIONS WITHDRAWN 4 $75,438 39 $65,939 131 $73,419 12 $47,636 8 $54,222 3 $83,563 FILES CLOSED FOR INCOMPLETENESS 1 $44,000 2 $50,400 15 $82,886 2 $29,305 2 $29,325 1 $36,930
Aggregated Statistics For Year 2003(Based on 2 full and 10 partial tracts) A) FHA, FSA/RHS & VA B) Conventional C) Refinancings D) Home Improvement Loans F) Non-occupant Loans on Number Average Value Number Average Value Number Average Value Number Average Value Number Average Value
LOANS ORIGINATED 66 $77,825 99 $67,605 312 $64,661 80 $15,260 60 $41,695 APPLICATIONS APPROVED, NOT ACCEPTED 0 $0 20 $80,112 74 $66,968 3 $28,753 10 $45,458 APPLICATIONS DENIED 6 $66,675 56 $56,668 270 $62,904 55 $12,644 23 $47,498 APPLICATIONS WITHDRAWN 3 $82,177 7 $65,969 111 $73,985 8 $27,521 3 $49,967 FILES CLOSED FOR INCOMPLETENESS 1 $103,780 13 $54,928 36 $64,866 0 $0 3 $29,847
Aggregated Statistics For Year 2002(Based on 2 full and 10 partial tracts) A) FHA, FSA/RHS & VA B) Conventional C) Refinancings D) Home Improvement Loans F) Non-occupant Loans on Number Average Value Number Average Value Number Average Value Number Average Value Number Average Value
LOANS ORIGINATED 50 $67,122 70 $55,046 218 $61,044 64 $11,971 42 $29,609 APPLICATIONS APPROVED, NOT ACCEPTED 1 $62,400 9 $48,193 61 $60,789 5 $21,334 6 $37,450 APPLICATIONS DENIED 6 $56,632 42 $39,115 202 $52,337 48 $15,790 15 $38,289 APPLICATIONS WITHDRAWN 1 $70,910 11 $128,338 107 $57,572 6 $15,693 2 $36,145 FILES CLOSED FOR INCOMPLETENESS 0 $0 3 $58,840 35 $67,672 0 $0 3 $44,303
Aggregated Statistics For Year 2001(Based on 2 full and 10 partial tracts) A) FHA, FSA/RHS & VA B) Conventional C) Refinancings D) Home Improvement Loans F) Non-occupant Loans on Number Average Value Number Average Value Number Average Value Number Average Value Number Average Value
LOANS ORIGINATED 42 $62,081 65 $55,107 232 $65,619 64 $10,775 39 $86,657 APPLICATIONS APPROVED, NOT ACCEPTED 1 $79,530 20 $43,116 59 $50,306 4 $23,790 4 $40,120 APPLICATIONS DENIED 8 $53,181 58 $46,465 279 $51,181 66 $15,140 13 $32,377 APPLICATIONS WITHDRAWN 6 $56,385 12 $48,811 148 $50,719 12 $32,898 5 $28,838 FILES CLOSED FOR INCOMPLETENESS 1 $42,440 2 $41,905 32 $59,850 0 $0 2 $40,220
Aggregated Statistics For Year 2000(Based on 2 full and 10 partial tracts) A) FHA, FSA/RHS & VA B) Conventional C) Refinancings D) Home Improvement Loans F) Non-occupant Loans on Number Average Value Number Average Value Number Average Value Number Average Value Number Average Value
LOANS ORIGINATED 56 $55,074 81 $44,604 167 $48,113 63 $13,302 28 $25,512 APPLICATIONS APPROVED, NOT ACCEPTED 1 $76,700 27 $40,735 61 $56,312 14 $15,482 3 $41,773 APPLICATIONS DENIED 10 $53,301 80 $45,103 220 $52,575 70 $16,637 16 $30,730 APPLICATIONS WITHDRAWN 3 $59,290 9 $41,070 91 $49,123 3 $44,083 5 $37,340 FILES CLOSED FOR INCOMPLETENESS 1 $46,290 1 $19,580 31 $61,130 2 $57,950 1 $23,770
Aggregated Statistics For Year 1999(Based on 1 full and 5 partial tracts) A) FHA, FSA/RHS & VA B) Conventional C) Refinancings D) Home Improvement Loans F) Non-occupant Loans on Number Average Value Number Average Value Number Average Value Number Average Value Number Average Value
LOANS ORIGINATED 24 $57,116 42 $51,390 106 $45,943 31 $10,675 13 $31,688 APPLICATIONS APPROVED, NOT ACCEPTED 1 $20,100 13 $45,920 53 $44,574 5 $21,026 6 $29,850 APPLICATIONS DENIED 5 $47,936 46 $44,018 120 $45,674 46 $13,156 11 $26,255 APPLICATIONS WITHDRAWN 5 $69,316 13 $44,738 60 $45,426 7 $30,264 1 $10,430 FILES CLOSED FOR INCOMPLETENESS 2 $39,560 1 $33,710 31 $48,895 0 $0 2 $22,460
Private Mortgage Insurance Companies Aggregated Statistics For Year 2009(Based on 8 partial tracts) A) Conventional B) Refinancings Number Average Value Number Average Value
LOANS ORIGINATED 7 $151,704 4 $172,020 APPLICATIONS APPROVED, NOT ACCEPTED 0 $0 2 $114,700 APPLICATIONS DENIED 1 $45,160 2 $210,860 APPLICATIONS WITHDRAWN 1 $212,170 1 $259,030 FILES CLOSED FOR INCOMPLETENESS 0 $0 0 $0
Aggregated Statistics For Year 2008(Based on 2 full and 10 partial tracts) A) Conventional B) Refinancings C) Non-occupant Loans on Number Average Value Number Average Value Number Average Value
LOANS ORIGINATED 15 $128,210 14 $150,269 3 $50,707 APPLICATIONS APPROVED, NOT ACCEPTED 13 $116,493 5 $77,978 1 $41,130 APPLICATIONS DENIED 1 $64,940 6 $79,928 1 $49,980 APPLICATIONS WITHDRAWN 0 $0 0 $0 0 $0 FILES CLOSED FOR INCOMPLETENESS 3 $48,453 0 $0 1 $77,420
Aggregated Statistics For Year 2007(Based on 2 full and 10 partial tracts) A) Conventional B) Refinancings C) Non-occupant Loans on D) Loans On Manufactured Number Average Value Number Average Value Number Average Value Number Average Value
LOANS ORIGINATED 55 $86,036 18 $115,956 13 $54,922 1 $30,650 APPLICATIONS APPROVED, NOT ACCEPTED 5 $128,344 4 $90,860 2 $51,530 0 $0 APPLICATIONS DENIED 1 $87,620 0 $0 0 $0 0 $0 APPLICATIONS WITHDRAWN 1 $126,150 0 $0 0 $0 0 $0 FILES CLOSED FOR INCOMPLETENESS 0 $0 0 $0 0 $0 0 $0
Aggregated Statistics For Year 2006(Based on 10 partial tracts) A) Conventional B) Refinancings C) Non-occupant Loans on D) Loans On Manufactured Number Average Value Number Average Value Number Average Value Number Average Value
LOANS ORIGINATED 26 $90,790 12 $112,297 5 $58,836 1 $90,370 APPLICATIONS APPROVED, NOT ACCEPTED 8 $86,611 4 $92,538 2 $60,885 0 $0 APPLICATIONS DENIED 0 $0 0 $0 0 $0 0 $0 APPLICATIONS WITHDRAWN 1 $85,360 1 $122,780 0 $0 0 $0 FILES CLOSED FOR INCOMPLETENESS 0 $0 0 $0 0 $0 0 $0
Aggregated Statistics For Year 2005(Based on 2 full and 10 partial tracts) A) Conventional B) Refinancings C) Non-occupant Loans on Number Average Value Number Average Value Number Average Value
LOANS ORIGINATED 30 $90,446 17 $101,164 7 $53,637 APPLICATIONS APPROVED, NOT ACCEPTED 4 $71,800 6 $113,648 2 $54,420 APPLICATIONS DENIED 2 $58,310 0 $0 0 $0 APPLICATIONS WITHDRAWN 1 $115,650 3 $76,297 0 $0 FILES CLOSED FOR INCOMPLETENESS 0 $0 0 $0 0 $0
Aggregated Statistics For Year 2004(Based on 2 full and 10 partial tracts) A) Conventional B) Refinancings C) Non-occupant Loans on Number Average Value Number Average Value Number Average Value
LOANS ORIGINATED 34 $81,621 24 $80,739 9 $44,154 APPLICATIONS APPROVED, NOT ACCEPTED 3 $94,170 6 $115,228 0 $0 APPLICATIONS DENIED 0 $0 1 $75,490 0 $0 APPLICATIONS WITHDRAWN 1 $81,000 1 $58,300 0 $0 FILES CLOSED FOR INCOMPLETENESS 1 $121,320 0 $0 0 $0
Aggregated Statistics For Year 2003(Based on 2 full and 10 partial tracts) A) Conventional B) Refinancings C) Non-occupant Loans on Number Average Value Number Average Value Number Average Value
LOANS ORIGINATED 29 $72,178 22 $75,712 8 $47,676 APPLICATIONS APPROVED, NOT ACCEPTED 7 $81,093 12 $79,297 2 $48,245 APPLICATIONS DENIED 0 $0 1 $36,930 1 $36,930 APPLICATIONS WITHDRAWN 1 $97,440 3 $63,413 0 $0 FILES CLOSED FOR INCOMPLETENESS 0 $0 0 $0 0 $0
Aggregated Statistics For Year 2002(Based on 2 full and 10 partial tracts) A) Conventional B) Refinancings C) Non-occupant Loans on Number Average Value Number Average Value Number Average Value
LOANS ORIGINATED 19 $70,106 30 $80,245 6 $47,065 APPLICATIONS APPROVED, NOT ACCEPTED 5 $54,800 7 $69,566 2 $46,755 APPLICATIONS DENIED 0 $0 3 $49,733 2 $47,300 APPLICATIONS WITHDRAWN 2 $41,880 2 $139,275 0 $0 FILES CLOSED FOR INCOMPLETENESS 0 $0 0 $0 0 $0
Aggregated Statistics For Year 2001(Based on 2 full and 10 partial tracts) A) Conventional B) Refinancings C) Non-occupant Loans on Number Average Value Number Average Value Number Average Value
LOANS ORIGINATED 12 $75,868 25 $64,290 2 $37,525 APPLICATIONS APPROVED, NOT ACCEPTED 0 $0 4 $67,305 1 $35,660 APPLICATIONS DENIED 0 $0 1 $102,650 0 $0 APPLICATIONS WITHDRAWN 0 $0 1 $55,350 0 $0 FILES CLOSED FOR INCOMPLETENESS 1 $36,230 1 $28,670 2 $32,450
Aggregated Statistics For Year 2000(Based on 2 full and 10 partial tracts) A) Conventional B) Refinancings C) Non-occupant Loans on Number Average Value Number Average Value Number Average Value
LOANS ORIGINATED 15 $61,464 18 $68,025 3 $34,140 APPLICATIONS APPROVED, NOT ACCEPTED 2 $85,365 3 $51,620 1 $20,980 APPLICATIONS DENIED 0 $0 1 $54,410 1 $28,670 APPLICATIONS WITHDRAWN 1 $48,530 1 $83,580 0 $0 FILES CLOSED FOR INCOMPLETENESS 0 $0 0 $0 0 $0
Aggregated Statistics For Year 1999(Based on 1 full and 5 partial tracts) A) Conventional B) Refinancings C) Non-occupant Loans on Number Average Value Number Average Value Number Average Value
LOANS ORIGINATED 8 $77,100 7 $60,660 2 $29,885 APPLICATIONS APPROVED, NOT ACCEPTED 1 $37,800 1 $59,460 1 $25,830 APPLICATIONS DENIED 1 $11,560 0 $0 1 $11,560 APPLICATIONS WITHDRAWN 0 $0 1 $212,160 0 $0 FILES CLOSED FOR INCOMPLETENESS 0 $0 0 $0 0 $0
2002 - 2018 National Fire Incident Reporting System (NFIRS) incidents See full 2006 National Fire Incident Reporting System statistics for zip code 73084, Oklahoma
Most common first names in zip code 73084 among deceased individuals Name Count Lived (average)
James 43 72.1 years Mary 39 78.2 years John 38 75.8 years William 35 76.1 years Willie 33 73.6 years Robert 26 69.9 years Charles 23 64.1 years George 21 72.1 years Albert 20 75.1 years Arthur 19 71.9 years
Most common last names in zip code 73084 among deceased individuals Last name Count Lived (average)
Johnson 47 74.0 years Smith 47 70.9 years Williams 32 71.4 years Brown 26 78.7 years Jones 22 75.6 years Jackson 20 68.6 years Mitchell 19 72.4 years Taylor 17 74.8 years Moore 17 74.5 years Wright 16 75.7 years


 Nearest zip codes: 73066, 73141, 73130, 73049, 73110, 73151.
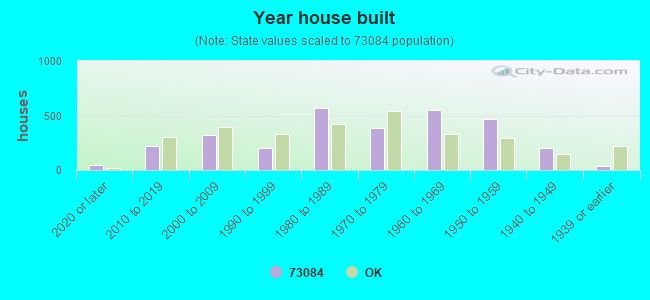


 According to the data from the years 2002 - 2018 the average number of fires per year is 107. The highest number of fire incidents - 163 took place in 2016, and the least - 67 in 2002. The data has an increasing trend.
 When looking into fire subcategories, the most incidents belonged to: Outside Fires (57.6%), and Structure Fires (23.5%).