Estimated zip code population in 2022: 31,841 Zip code population in 2010: 28,132 Zip code population in 2000: 31,292
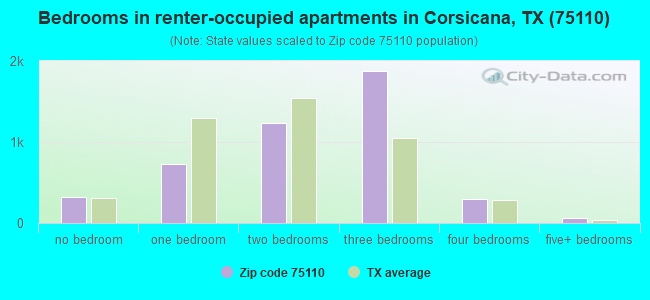
Houses and condos: 12,302 Renter-occupied apartments: 4,524
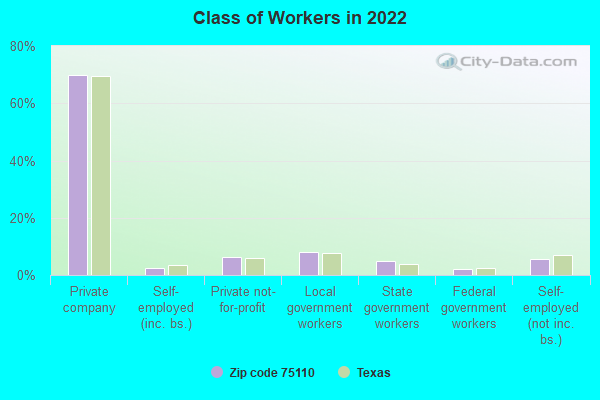
% of renters here:
41%
State:
38%
March 2022 cost of living index in zip code 75110: 80.0 (low, U.S. average is 100)
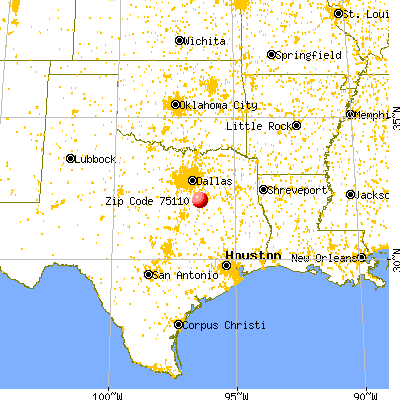
Land area: 149.9 sq. mi. Water area: 1.3 sq. mi.
Population density: 212 people per square mile
(very low).
OSM Map
General Map
Google Map
MSN Map
OSM Map
General Map
Google Map
MSN Map
OSM Map
General Map
Google Map
MSN Map
OSM Map
General Map
Google Map
MSN Map
Please wait while loading the map...
Real estate property taxes paid for housing units in 2022:
This zip code:
1.2% ($2,088)
Texas:
1.5% ($4,050)
Median real estate property taxes paid for housing units with mortgages in 2022: $2,708 (1.3%) Median real estate property taxes paid for housing units with no mortgage in 2022: $1,837 (1.4%)
Averages for the 2020 tax year for zip code 75110, filed in 2021:
Average Adjusted Gross Income (AGI) in 2020: $46,061 (Individual Income Tax Returns)
Here:
$46,061
State:
$77,054
Salary/wage: $40,255 (reported on 86.2% of returns)
Here:
$40,255
State:
$62,766
(% of AGI for various income ranges: 1263.3% for AGIs below $25k, 3694.1% for AGIs $25k-50k, 6762.2% for AGIs $50k-75k, 9497.4% for AGIs $75k-100k, 16100.0% for AGIs $100k-200k, 74416.0% for AGIs over 200k)
Taxable interest for individuals: $2,222 (reported on 14.2% of returns)
This zip code:
$2,222
Texas:
$2,665
(% of AGI for various income ranges: 5.9% for AGIs below $25k, 11.4% for AGIs $25k-50k, 27.5% for AGIs $50k-75k, 54.8% for AGIs $75k-100k, 137.0% for AGIs $100k-200k, 3922.0% for AGIs over 200k)
Ordinary dividends: $8,915 (reported on 7.0% of returns)
Here:
$8,915
State:
$10,044
(% of AGI for various income ranges: 7.6% for AGIs below $25k, 17.6% for AGIs $25k-50k, 58.4% for AGIs $50k-75k, 109.7% for AGIs $75k-100k, 355.4% for AGIs $100k-200k, 7318.0% for AGIs over 200k)
Net capital gain/loss in AGI: +$18,852 (reported on 7.1% of returns)
Here:
+$18,852
State:
+$39,590
(% of AGI for various income ranges: 5.6% for AGIs below $25k, 13.4% for AGIs $25k-50k, 39.6% for AGIs $50k-75k, 81.8% for AGIs $75k-100k, 486.4% for AGIs $100k-200k, 25168.0% for AGIs over 200k)
Profit/loss from business: +$9,002 (reported on 16.6% of returns)
Here:
+$9,002
State:
+$10,888
(% of AGI for various income ranges: 119.3% for AGIs below $25k, 88.8% for AGIs $25k-50k, 182.5% for AGIs $50k-75k, 260.8% for AGIs $75k-100k, 419.5% for AGIs $100k-200k, 9802.0% for AGIs over 200k)
Taxable individual retirement arrangement distribution: $17,175 (reported on 5.6% of returns)
75110:
$17,175
Texas:
$24,740
(% of AGI for various income ranges: 27.7% for AGIs below $25k, 50.7% for AGIs $25k-50k, 176.6% for AGIs $50k-75k, 303.1% for AGIs $75k-100k, 610.5% for AGIs $100k-200k, 3850.0% for AGIs over 200k)
Total itemized deductions: $38,740 (reported on 2.7% of returns)
Here:
$38,740
State:
$40,428
(% of AGI for various income ranges: 15.5% for AGIs below $25k, 60.1% for AGIs $25k-50k, 207.0% for AGIs $50k-75k, 250.8% for AGIs $75k-100k, 514.3% for AGIs $100k-200k, 7964.0% for AGIs over 200k)
Charity contributions: $14,163 (reported on 2.1% of returns)
Here:
$14,163
State:
$18,201
(% of AGI for various income ranges: 9.0% for AGIs $25k-50k, 38.7% for AGIs $50k-75k, 63.4% for AGIs $75k-100k, 141.4% for AGIs $100k-200k, 3744.0% for AGIs over 200k)
Taxes paid: $5,925 (reported on 2.5% of returns)
75110:
$5,925
State:
$7,821
(% of AGI for various income ranges: 1.7% for AGIs below $25k, 6.0% for AGIs $25k-50k, 18.1% for AGIs $50k-75k, 36.1% for AGIs $75k-100k, 107.7% for AGIs $100k-200k, 1168.0% for AGIs over 200k)
Earned income credit: $2,697 (reported on 27.6% of returns)
Here:
$2,697
State:
$2,584
(% of AGI for various income ranges: 151.2% for AGIs below $25k, 95.8% for AGIs $25k-50k, 2.0% for AGIs $50k-75k)
Percentage of individuals using paid preparers for their 2020 taxes: 93.9%
Here:
94%
State:
92%
(% for various income ranges: 94.0% for AGIs below $25k, 94.1% for AGIs $25k-50k, 92.9% for AGIs $50k-75k, 93.0% for AGIs $75k-100k, 94.4% for AGIs $100k-200k, 95.0% for AGIs over 200k)
Averages for the 2012 tax year for zip code 75110, filed in 2013:
Average Adjusted Gross Income (AGI) in 2012: $40,107 (Individual Income Tax Returns)
Here:
$40,107
State:
$65,384
Salary/wage: $34,217 (reported on 87.9% of returns)
Here:
$34,217
State:
$52,524
(% of AGI for various income ranges: 82.9% for AGIs below $25k, 85.9% for AGIs $25k-50k, 80.8% for AGIs $50k-75k, 79.4% for AGIs $75k-100k, 72.6% for AGIs $100k-200k, 41.5% for AGIs over 200k)
Taxable interest for individuals: $2,994 (reported on 16.9% of returns)
This zip code:
$2,994
Texas:
$2,372
(% of AGI for various income ranges: 0.5% for AGIs below $25k, 0.5% for AGIs $25k-50k, 0.7% for AGIs $50k-75k, 0.9% for AGIs $75k-100k, 1.1% for AGIs $100k-200k, 4.4% for AGIs over 200k)
Ordinary dividends: $10,252 (reported on 8.7% of returns)
Here:
$10,252
State:
$9,721
(% of AGI for various income ranges: 0.9% for AGIs below $25k, 0.6% for AGIs $25k-50k, 0.8% for AGIs $50k-75k, 1.1% for AGIs $75k-100k, 1.9% for AGIs $100k-200k, 9.1% for AGIs over 200k)
Net capital gain/loss in AGI: +$11,269 (reported on 7.2% of returns)
Here:
+$11,269
State:
+$35,319
(% of AGI for various income ranges: 0.3% for AGIs $25k-50k, 0.2% for AGIs $50k-75k, 0.9% for AGIs $75k-100k, 1.6% for AGIs $100k-200k, 10.6% for AGIs over 200k)
Profit/loss from business: +$11,181 (reported on 14.7% of returns)
Here:
+$11,181
State:
+$13,732
(% of AGI for various income ranges: 6.3% for AGIs below $25k, 1.9% for AGIs $25k-50k, 2.8% for AGIs $50k-75k, 1.9% for AGIs $75k-100k, 4.8% for AGIs $100k-200k, 7.6% for AGIs over 200k)
Taxable individual retirement arrangement distribution: $15,182 (reported on 6.7% of returns)
75110:
$15,182
Texas:
$19,511
(% of AGI for various income ranges: 1.7% for AGIs below $25k, 1.5% for AGIs $25k-50k, 2.3% for AGIs $50k-75k, 2.4% for AGIs $75k-100k, 3.7% for AGIs $100k-200k, 4.2% for AGIs over 200k)
Total itemized deductions: $22,193 (21% of AGI, reported on 12.8% of returns)
Here:
$22,193
State:
$24,724
Here:
20.7% of AGI
State:
15.9% of AGI
(% of AGI for various income ranges: 3.1% for AGIs below $25k, 4.8% for AGIs $25k-50k, 7.0% for AGIs $50k-75k, 8.1% for AGIs $75k-100k, 10.4% for AGIs $100k-200k, 10.4% for AGIs over 200k)
Charity contributions: $7,379 (reported on 9.7% of returns)
Here:
$7,379
State:
$6,808
(% of AGI for various income ranges: 0.3% for AGIs below $25k, 0.7% for AGIs $25k-50k, 1.4% for AGIs $50k-75k, 1.8% for AGIs $75k-100k, 2.7% for AGIs $100k-200k, 4.5% for AGIs over 200k)
Taxes paid: $5,005 (reported on 12.4% of returns)
75110:
$5,005
State:
$6,921
(% of AGI for various income ranges: 0.5% for AGIs below $25k, 0.9% for AGIs $25k-50k, 1.5% for AGIs $50k-75k, 1.7% for AGIs $75k-100k, 2.7% for AGIs $100k-200k, 2.4% for AGIs over 200k)
Earned income credit: $2,577 (reported on 30.5% of returns)
Here:
$2,577
State:
$2,570
(% of AGI for various income ranges: 9.8% for AGIs below $25k, 1.7% for AGIs $25k-50k)
Percentage of individuals using paid preparers for their 2012 taxes: 59.6%
Here:
60%
State:
51%
(% for various income ranges: 55.3% for AGIs below $25k, 63.2% for AGIs $25k-50k, 60.0% for AGIs $50k-75k, 62.9% for AGIs $75k-100k, 68.9% for AGIs $100k-200k, 83.3% for AGIs over 200k)
Averages for the 2004 tax year for zip code 75110, filed in 2005:
Average Adjusted Gross Income (AGI) in 2004: $32,717 (Individual Income Tax Returns)
Here:
$32,717
State:
$47,881
Salary/wage: $29,634 (reported on 86.7% of returns)
Here:
$29,634
State:
$41,947
(% of AGI for various income ranges: 151.7% for AGIs below $10k, 85.5% for AGIs $10k-25k, 84.8% for AGIs $25k-50k, 80.4% for AGIs $50k-75k, 76.2% for AGIs $75k-100k, 58.7% for AGIs over 100k)
Taxable interest for individuals: $3,177 (reported on 25.4% of returns)
This zip code:
$3,177
Texas:
$2,255
(% of AGI for various income ranges: 10.8% for AGIs below $10k, 1.8% for AGIs $10k-25k, 1.4% for AGIs $25k-50k, 1.4% for AGIs $50k-75k, 1.9% for AGIs $75k-100k, 4.8% for AGIs over 100k)
Taxable dividends: $4,497 (reported on 12.4% of returns)
Here:
$4,497
State:
$4,261
(% of AGI for various income ranges: 2.9% for AGIs below $10k, 0.6% for AGIs $10k-25k, 0.6% for AGIs $25k-50k, 0.9% for AGIs $50k-75k, 1.4% for AGIs $75k-100k, 4.6% for AGIs over 100k)
Net capital gain/loss: +$7,819 (reported on 11.2% of returns)
Here:
+$7,819
State:
+$16,110
(% of AGI for various income ranges: -0.2% for AGIs below $10k, 0.1% for AGIs $10k-25k, 0.5% for AGIs $25k-50k, 0.9% for AGIs $50k-75k, 1.3% for AGIs $75k-100k, 10.0% for AGIs over 100k)
Profit/loss from business: +$8,023 (reported on 15.1% of returns)
Here:
+$8,023
State:
+$11,013
(% of AGI for various income ranges: 4.7% for AGIs below $10k, 3.3% for AGIs $10k-25k, 2.8% for AGIs $25k-50k, 3.1% for AGIs $50k-75k, 2.3% for AGIs $75k-100k, 6.2% for AGIs over 100k)
IRA payment deduction: $2,886 (reported on 1.9% of returns)
75110:
$2,886
Texas:
$3,120
(% of AGI for various income ranges: 0.1% for AGIs $10k-25k, 0.2% for AGIs $25k-50k, 0.2% for AGIs $50k-75k, 0.1% for AGIs $75k-100k, 0.2% for AGIs over 100k)
Self-employed pension: $12,238 (reported on 0.2% of returns)
Here:
$12,238
Texas:
$16,401
Total itemized deductions: $18,120 (23% of AGI, reported on 14.0% of returns)
Here:
$18,120
State:
$19,631
Here:
22.7% of AGI
State:
18.9% of AGI
(% of AGI for various income ranges: 7.3% for AGIs below $10k, 4.0% for AGIs $10k-25k, 5.5% for AGIs $25k-50k, 7.9% for AGIs $50k-75k, 9.7% for AGIs $75k-100k, 12.3% for AGIs over 100k)
Charity contributions deductions: $5,451 (6% of AGI, reported on 11.6% of returns)
Here:
$5,451
State:
$4,753
Here:
6.4% of AGI
State:
4.2% of AGI
(% of AGI for various income ranges: 0.6% for AGIs below $10k, 0.5% for AGIs $10k-25k, 1.0% for AGIs $25k-50k, 1.7% for AGIs $50k-75k, 2.4% for AGIs $75k-100k, 4.2% for AGIs over 100k)
Total tax: $4,892 (reported on 60.3% of returns)
75110:
$4,892
State:
$9,058
(% of AGI for various income ranges: 4.4% for AGIs below $10k, 2.6% for AGIs $10k-25k, 5.7% for AGIs $25k-50k, 8.8% for AGIs $50k-75k, 10.8% for AGIs $75k-100k, 17.6% for AGIs over 100k)
Earned income credit: $2,059 (reported on 29.8% of returns)
Here:
$2,059
State:
$2,024
Percentage of individuals using paid preparers for their 2004 taxes: 64.3%
Here:
64%
State:
57%
(% for various income ranges: 55.4% for AGIs below $10k, 66.8% for AGIs $10k-25k, 66.9% for AGIs $25k-50k, 65.2% for AGIs $50k-75k, 66.4% for AGIs $75k-100k, 73.6% for AGIs over 100k)
Likely homosexual households (counted as self-reported same-sex unmarried-partner households)
Lesbian couples: 0.2% of all households
Gay men: 0.2% of all households
Household received Food Stamps/SNAP in the past 12 months: 2,192 Household did not receive Food Stamps/SNAP in the past 12 months: 8,988
Women who had a birth in the past 12 months: 419 (181 now married, 232 unmarried) Women who did not have a birth in the past 12 months: 6,965 (3,100 now married, 3,864 unmarried)
Housing units in zip code 75110 with a mortgage: 3,079 (164 second mortgage, 134 both second mortgage and home equity loan) Houses without a mortgage: 29
Median monthly owner costs for units with a mortgage: $1,426 Median monthly owner costs for units without a mortgage: $565
Residents with income below the poverty level in 2022:
This zip code:
17.4%
Whole state:
14.0%
Residents with income below 50% of the poverty level in 2022:
This zip code:
11.2%
Whole state:
7.4%
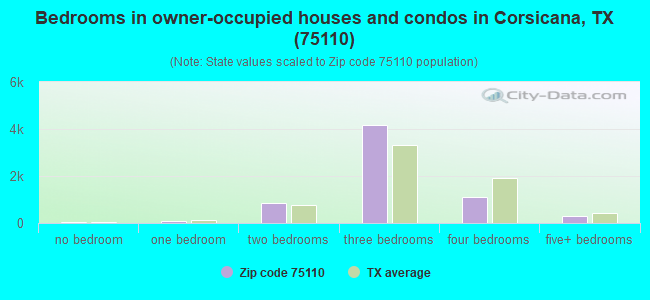
Median number of rooms in houses and condos:
Here:
6.0
State:
6.3
Median number of rooms in apartments:
Here:
4.5
State:
4.0
Notable locations in this zip code not listed on our city pages
Notable locations in zip code 75110: Corsicana Country Club (A), Fleming Boys Camp (B), West Side Historic District (C), Mills Place Historic District (D), Corsicana Commercial Historic District (E), Odd Fellows and Rebekah Home for Children (F), Navarro County Courthouse (G), Pioneer Village of Navarro County (H), Corsicana Fire Department Central Station (I), Corsicana Fire Department Station 2 (J), Corsicana Fire Department Station 3 (K), Corsicana Fire Department Station 4 (L), Retreat Volunteer Fire Department (M), Pearce Civil War Documents Collection (N), Robert S Reading Arrowhead and Indian Artifact Collection Museum (O), 3C - Capehart Communication Collection Building (P). Display/hide their locations on the map
Churches in zip code 75110 include: Pleasant Grove Church (A), Whites Chapel (B), Temple Beth-El (C), Second Avenue Baptist Church (D), Saint Johns Baptist Church (E), Providence Primitive Baptist Church (F), Pilgrim Rest Primitive Baptist Church (G), Mount Olive Missionary Baptist Church (H), Morning Star Baptist Church (I). Display/hide their locations on the map
Cemeteries: Woodland Cemetery (1), Black Hills Cemetery (2), Campbell Cemetery (3), Providence Cemetery (4), Cosgrove Cemetery (5), Oakwood Cemetery (6), Cunningham Cemetery (7). Display/hide their locations on the map
Reservoirs: Reservoir Number One Hundred Twentyfour (A), Reservoir Number One Hundred Twentyone (B), Magnolia Lake (C), Soil Conservation Service Site 139 Reservoir (D), Mobil Pipeline Lake (E), Soil Conservation Service Site 140 Reservoir (F), Soil Conservation Service Site 138 Reservoir (G), Soil Conservation Service Site 137a Reservoir (H). Display/hide their locations on the map
Parks in zip code 75110 include: Jester Park (1), Tiger Field (2), Natures Park (3), Tiger Field (4), Community Park (5), Bunert Park (6). Display/hide their locations on the map
4,255 married couples with children.
2,646 single-parent households (497 men, 2,149 women).
67.4% of residents of 75110 zip code speak English at home.
28.9% of residents speak Spanish at home (61% very well, 22% well, 13% not well, 4% not at all).
0.3% of residents speak other Indo-European language at home (73% very well, 18% well, 9% not well).
2.6% of residents speak Asian or Pacific Island language at home (47% very well, 25% well, 11% not well, 18% not at all).
0.1% of residents speak other language at home (100% very well).
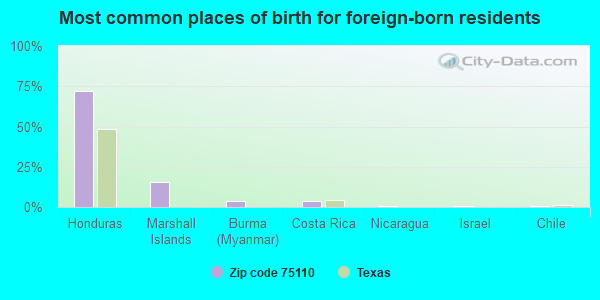
Foreign born population: 5,598 (17.6%) (35.0% of them are naturalized citizens)
This zip code:
17.6%
Whole state:
17.2%
72%Honduras
16%Marshall Islands
4%Burma (Myanmar)
4%Costa Rica
1%Nicaragua
1%Israel
1%Chile
6%American
5%Irish
5%English
2%German
1%British
1%French
1%Scottish
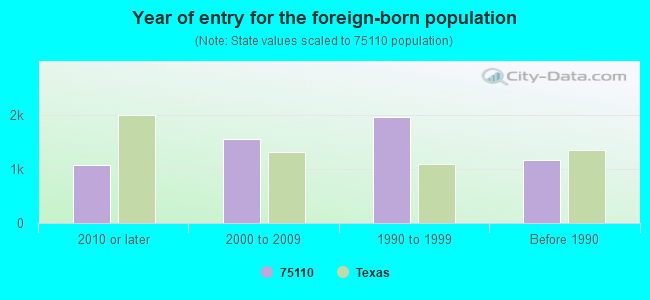
Year of entry for the foreign-born population
1,0692010 or later
1,5562000 to 2009
1,9561990 to 1999
1,171Before 1990
Facilities with environmental interests located in this zip code:
ANCHOR GLASS CONTAINER CORP., 02 PLANT (1901 S. HWY. 287 in CORSICANA, TX)
AIR MINOR (AIRS/AFS) COMPLIANCE ACTIVITY (Tracking inspections of insecticide, fungicide, and rodenticide, and toxic substances) (Resource Conservation and Recovery Act (tracking hazardous waste)) TRI REPORTER (Tracking of toxic chemicals releasing facilities) Business SIC classification: GLASS AND GLAZING WORK; FLAT GLASS; GLASS CONTAINERS; GLASS PRODUCTS, MADE OF PURCHASED GLASS Business NAICS classification: GLASS CONTAINER MANUFACTURING. Organizations: ANCHOR RESOLUTION CORPORATION (CONTACT/OPERATOR)
Alternative names: DIAMOND BATHURST GLASS CO
A-1 AUTO SALVAGE (3830 S IH-45 W in CORSICANA, TX)
(Integrated Compliance Information System) - ICIS-06-2000-0404, FORMAL ENFORCEMENT ACTION Business SIC classification: MOTOR VEHICLE PARTS, USED
A-1 AUTO SALVAGE (TXU010612) (1 MI S ON I-45 in CORSICANA, TX)
ABC RAIL PRODUCTS CORP (3601 E HIGHWAY 31 2 MI E OF in CORSICANA, TX)
(Resource Conservation and Recovery Act (tracking hazardous waste)) Alternative names: GE RAILCAR WHEEL PTS SVCS
AUTO TRUCK AND TRAILER (1800 PHIFE in CORSICANA, TX)
(Resource Conservation and Recovery Act (tracking hazardous waste)) Business NAICS classification: GENERAL AUTOMOTIVE REPAIR. Organizations: COVEREMMETT (CONTACT/OPERATOR)
Alternative names: AUTO TRUCK TRAILER SERVICE
A-1 AUTO SALVAGE (6158 S. I-45 WEST in CORSICANA, TX)
National Pollutant Discharge Elimination System NON-MAJOR (Tracking pollutant discharge elimination systems) - permit
A-1 AUTO SALVAGE (1 MI. S. ON I 45 in CORSICANNA, TX)
National Pollutant Discharge Elimination System NON-MAJOR (Tracking pollutant discharge elimination systems) - permit Alternative names: CHARLES S. MCKISSACK
BALLAST & LAMP RECYCLING INC (1217 OAK STREET in CORSICANA, TX)
(Resource Conservation and Recovery Act (tracking hazardous waste))
Housing units lacking complete plumbing facilities: 3.9% Housing units lacking complete kitchen facilities: 3.0%
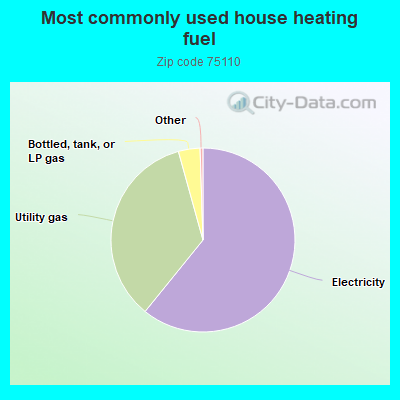
60.9%Electricity
34.9%Utility gas
3.8%Bottled, tank, or LP gas
Population in 1990: 28,003. Population change in the 1990s: +3,289 (+11.7%).
Place of birth for U.S.-born residents:
This state: 21,758
Northeast: 311
Midwest: 1,221
South: 1,165
West: 1,300
55% of the 75110 zip code residents lived in the same house 5 years ago. Out of people who lived in different houses, 61% lived in this county. Out of people who lived in different counties, 50% lived in Texas.
89% of the 75110 zip code residents lived in the same house 1 year ago. Out of people who lived in different houses, 55% moved from this county. Out of people who lived in different houses, 25% moved from different county within same state. Out of people who lived in different houses, 17% moved from different state. Out of people who lived in different houses, 2% moved from abroad.
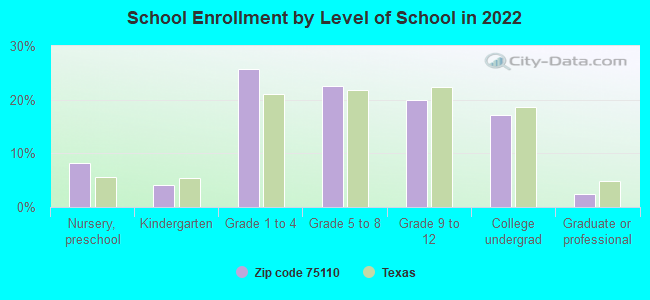
Private vs. public school enrollment:
Students in private schools in grades 1 to 8 (elementary and middle school): 162
Here:
4.1%
Texas:
8.8%
Students in private schools in grades 9 to 12 (high school): 109
Here:
6.7%
Texas:
8.0%
Students in private undergraduate colleges: 223
Here:
15.8%
Texas:
16.2%
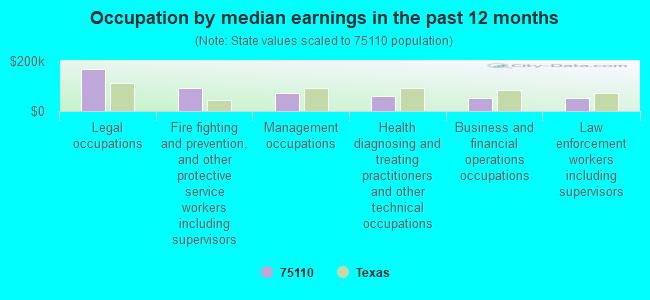
Occupation by median earnings in the past 12 months ($)
169,707Legal occupations
91,494Fire fighting and prevention, and other protective service workers including supervisors
72,486Management occupations
61,729Health diagnosing and treating practitioners and other technical occupations
51,407Business and financial operations occupations
50,162Law enforcement workers including supervisors
Companies with federal contracts located in this zip code (CORSICANA, TX):
FARMER, BRAD (1209 W ELMWOOD CR; small business) : $367,773 in 37 contractsfrom 2002 to 2006
Contracts for Landscaping/Groundskeeping Services by Army, U.S. Army Corps of Engineers - civil program financing only Signed by year:2000: $0; 2001: $0; 2002: $0; 2003: $8,946; 2004: $91,907; 2005: $234,256; 2006: $32,664.
Biggest contracts:
$78,965 with Army for Landscaping/Groundskeeping Services. Signed on 2005-02-25. Completion date: 2005-02-28.
$78,965 with U.S. Army Corps of Engineers - civil program financing only for Landscaping/Groundskeeping Services. Signed on 2005-02-25. Completion date: 2005-02-28.
$16,263 with Army for Landscaping/Groundskeeping Services. Signed on 2006-05-04. Completion date: 2006-06-30.
$10,756 with U.S. Army Corps of Engineers - civil program financing only for Landscaping/Groundskeeping Services. Signed on 2005-06-17. Completion date: 2005-09-30.
AL DYER (3209 W PARK ROW; small business) : $135,056 in 24 contractsfrom 2003 to 2006
Contracts for Landscaping/Groundskeeping Services by Army, U.S. Army Corps of Engineers - civil program financing only Signed by year:2000: $0; 2001: $0; 2002: $0; 2003: $8,395; 2004: $53,070; 2005: $62,081; 2006: $11,510.
Biggest contracts:
$11,510 with Army for Landscaping/Groundskeeping Services. Signed on 2006-06-27. Completion date: 2006-07-10.
$10,005, same as above.Signed on 2005-08-05. Completion date: 2005-09-02.
$10,005, same as above.Signed on 2004-12-03. Completion date: 2004-12-23.
$10,005, same as above.Signed on 2005-05-12. Completion date: 2005-05-27.
CORSICANA GERANIUM GARDEN (W HWY 31; small business)
$57,441 with Navy for Landscaping/Groundskeeping Services. Signed on 2005-09-28. Completion date: 2005-11-30.
HINTZ, MARC (1001 OAK ST; small business) : $35,906 in 4 contractsfrom 2004 to 2005
$12,245 with Army for Recreational and Gymnastic Equipment. Signed on 2005-01-24. Completion date: 2005-02-15.
$11,360, same as above.Signed on 2004-06-16. Completion date: 2004-06-21.
$7,900 with Army for Athletic and Sporting Equipment. Signed on 2004-04-21. Completion date: 2004-05-07.
$4,401, same as above.Signed on 2004-06-21. Completion date: 2004-06-25.
TAYLOR, DEBBIE (130 E DRANE AVENUE) : $17,336 in 9 contractsfrom 2003 to 2005
Contracts for Custodial Janitorial Services by Army, U.S. Army Corps of Engineers - civil program financing only Signed by year:2000: $0; 2001: $0; 2002: $0; 2003: $2,625; 2004: $6,925; 2005: $7,786; 2006: $0.
Biggest contracts:
$6,925 with Army for Custodial Janitorial Services. Signed on 2004-02-05. Completion date: 2004-09-30.
$2,375 with U.S. Army Corps of Engineers - civil program financing only for Custodial Janitorial Services. Signed on 2005-02-23. Completion date: 2004-09-30.
$2,375 with Army for Custodial Janitorial Services. Signed on 2005-02-23. Completion date: 2004-09-30.
$1,518 with U.S. Army Corps of Engineers - civil program financing only for Custodial Janitorial Services. Signed on 2005-01-11. Completion date: 2004-09-30.
$8,220 with Army for Custodial Janitorial Services. Signed on 2004-10-07. Completion date: 2005-09-30.
$8,220 with U.S. Army Corps of Engineers - civil program financing only for Custodial Janitorial Services. Signed on 2004-10-07. Completion date: 2005-09-30.
Top industries in this zip code by the number of employees in 2005:
Administrative and Support and Waste Management and Remediation Services: Temporary Help Services (250-499 employees: 1 establishment, 100-249 employees: 2 establishments, 5-9 employees: 1 establishment, 1-4 employees: 1 establishment)
Health Care and Social Assistance: Nursing Care Facilities (100-249: 2, 50-99: 2)
Health Care and Social Assistance: Residential Mental Retardation Facilities (100-249: 1, 20-49: 1, 10-19: 5, 1-4: 5)
People in group quarters in 2010:
277 people in nursing facilities/skilled-nursing facilities
179 people in local jails and other municipal confinement facilities
122 people in correctional facilities intended for juveniles
44 people in group homes intended for adults
23 people in college/university student housing
12 people in workers' group living quarters and job corps centers
12 people in other noninstitutional facilities
3 people in emergency and transitional shelters (with sleeping facilities) for people experiencing homelessness
People in group quarters in 2000:
623 people in college dormitories (includes college quarters off campus)
299 people in nursing homes
157 people in local jails and other confinement facilities (including police lockups)
120 people in other noninstitutional group quarters
106 people in other nonhousehold living situations
44 people in schools, hospitals, or wards for the intellectually disabled
24 people in homes for the mentally retarded
18 people in homes for the mentally ill
Fatal accident statistics in 2014:
Fatal accident count: 3
Vehicles involved in fatal accidents: 4
Fatal accidents caused by drunken drivers: 1
Fatalities: 3
Persons involved in fatal accidents: 8
Pedestrians involved in fatal accidents: 1
Fatal accident statistics in 2013:
Fatal accident count: 7
Vehicles involved in fatal accidents: 9
Fatal accidents caused by drunken drivers: 1
Fatalities: 9
Persons involved in fatal accidents: 20
Pedestrians involved in fatal accidents: 0
2002 - 2018 National Fire Incident Reporting System (NFIRS) incidents
According to the data from the years 2002 - 2018 the average number of fire incidents per year is 195. The highest number of fires - 271 took place in 2008, and the least - 136 in 2016. The data has a decreasing trend.
When looking into fire subcategories, the most incidents belonged to: Outside Fires (48.9%), and Structure Fires (32.0%).
Fire incident types reported to NFIRS in Zip Code 75110


 Nearest zip codes: 75102, 75155, 76679, 75109, 76626, 75153.


 According to the data from the years 2002 - 2018 the average number of fire incidents per year is 195. The highest number of fires - 271 took place in 2008, and the least - 136 in 2016. The data has a decreasing trend.
 When looking into fire subcategories, the most incidents belonged to: Outside Fires (48.9%), and Structure Fires (32.0%).