Estimated zip code population in 2022: 24,975 Zip code population in 2010: 12,672 Zip code population in 2000: 5,403
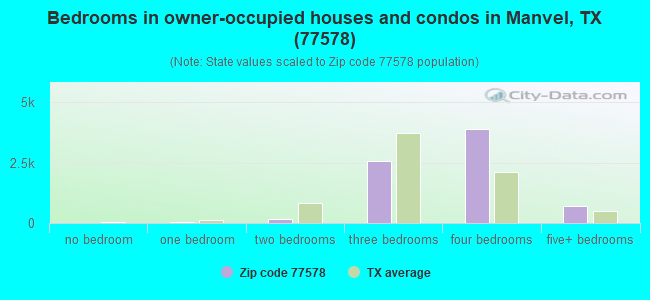
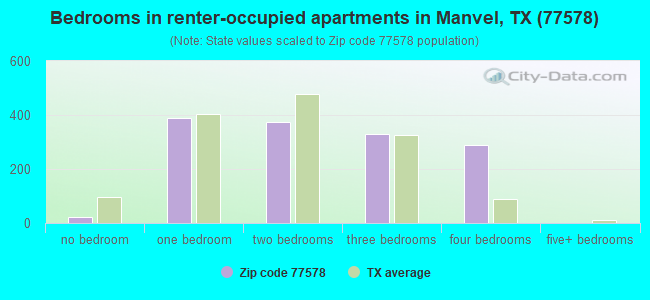
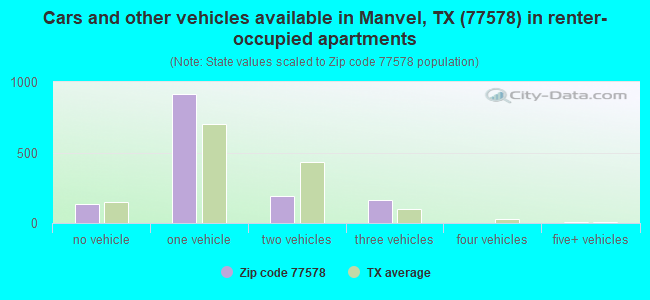
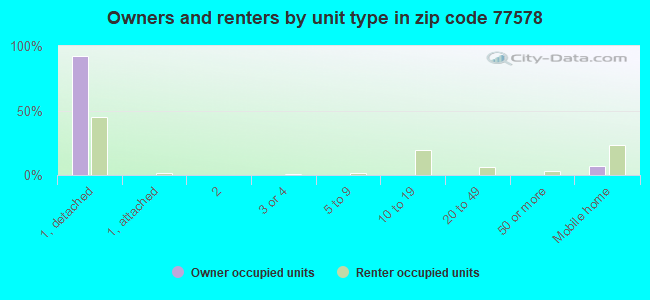
Houses and condos: 9,515 Renter-occupied apartments: 1,413
% of renters here:
16%
State:
38%
March 2022 cost of living index in zip code 77578: 92.4 (less than average, U.S. average is 100)
Land area: 37.3 sq. mi. Water area: 0.1 sq. mi.
Population density: 670 people per square mile
(low).
OSM Map
General Map
Google Map
MSN Map
OSM Map
General Map
Google Map
MSN Map
OSM Map
General Map
Google Map
MSN Map
OSM Map
General Map
Google Map
MSN Map
Please wait while loading the map...
Real estate property taxes paid for housing units in 2022:
This zip code:
2.1% ($8,347)
Texas:
1.5% ($4,050)
Median real estate property taxes paid for housing units with mortgages in 2022: $9,029 (2.3%) Median real estate property taxes paid for housing units with no mortgage in 2022: $4,887 (1.4%)
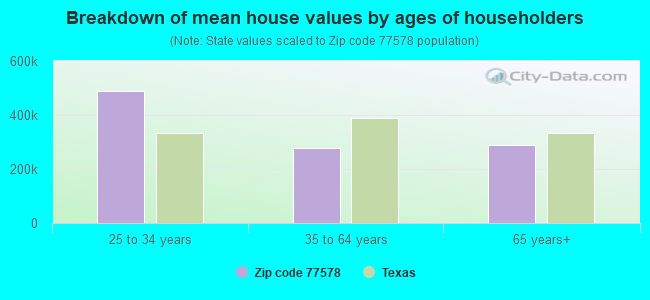
Estimated median house/condo value in 2022: $392,966
77578:
$392,966
Texas:
$275,400
According to our research of Texas and other state lists, there were 31 registered sex offenders living in 77578 zip code as of May 28, 2024. The ratio of all residents to sex offenders in zip code 77578 is 568 to 1. The ratio of registered sex offenders to all residents in this zip code is lower than the state average.
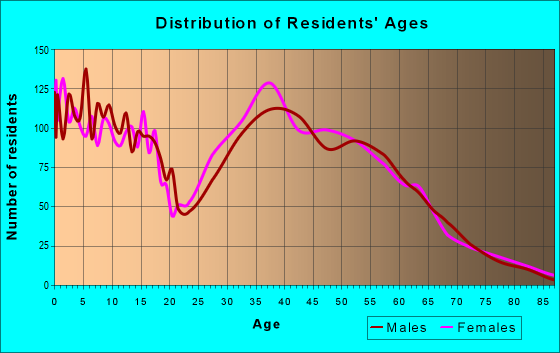
Median resident age:
This zip code:
37.9 years
Texas median age:
35.6 years
Average household size:
This zip code:
2.8 people
Texas:
2.6 people
Averages for the 2020 tax year for zip code 77578, filed in 2021:
Average Adjusted Gross Income (AGI) in 2020: $97,130 (Individual Income Tax Returns)
Here:
$97,130
State:
$77,054
Salary/wage: $90,964 (reported on 86.3% of returns)
Here:
$90,964
State:
$62,766
(% of AGI for various income ranges: 1203.6% for AGIs below $25k, 3686.4% for AGIs $25k-50k, 6838.3% for AGIs $50k-75k, 9935.3% for AGIs $75k-100k, 18807.4% for AGIs $100k-200k, 61128.7% for AGIs over 200k)
Taxable interest for individuals: $1,663 (reported on 25.6% of returns)
This zip code:
$1,663
Texas:
$2,665
(% of AGI for various income ranges: 9.4% for AGIs below $25k, 18.5% for AGIs $25k-50k, 16.5% for AGIs $50k-75k, 39.1% for AGIs $75k-100k, 66.6% for AGIs $100k-200k, 530.2% for AGIs over 200k)
Ordinary dividends: $4,102 (reported on 17.8% of returns)
Here:
$4,102
State:
$10,044
(% of AGI for various income ranges: 11.3% for AGIs below $25k, 20.9% for AGIs $25k-50k, 31.4% for AGIs $50k-75k, 43.1% for AGIs $75k-100k, 113.2% for AGIs $100k-200k, 1011.9% for AGIs over 200k)
Net capital gain/loss in AGI: +$13,860 (reported on 17.4% of returns)
Here:
+$13,860
State:
+$39,590
(% of AGI for various income ranges: 9.9% for AGIs below $25k, 23.7% for AGIs $25k-50k, 58.4% for AGIs $50k-75k, 93.9% for AGIs $75k-100k, 243.1% for AGIs $100k-200k, 4294.0% for AGIs over 200k)
Profit/loss from business: +$4,197 (reported on 24.3% of returns)
Here:
+$4,197
State:
+$10,888
(% of AGI for various income ranges: 32.9% for AGIs below $25k, 61.5% for AGIs $75k-100k, 175.3% for AGIs $100k-200k, 1631.7% for AGIs over 200k)
Taxable individual retirement arrangement distribution: $26,033 (reported on 6.4% of returns)
77578:
$26,033
Texas:
$24,740
(% of AGI for various income ranges: 41.8% for AGIs below $25k, 80.1% for AGIs $25k-50k, 139.5% for AGIs $50k-75k, 195.8% for AGIs $75k-100k, 397.8% for AGIs $100k-200k, 1288.3% for AGIs over 200k)
Self-employed (Keogh) retirement plans: $23,240 (reported on 0.4% of returns)
77578:
$23,240
Texas:
$29,298
(% of AGI for various income ranges: 223.5% for AGIs over 200k)
Total itemized deductions: $33,355 (reported on 16.7% of returns)
Here:
$33,355
State:
$40,428
(% of AGI for various income ranges: 65.6% for AGIs below $25k, 217.0% for AGIs $25k-50k, 568.3% for AGIs $50k-75k, 874.5% for AGIs $75k-100k, 1392.8% for AGIs $100k-200k, 3824.6% for AGIs over 200k)
Charity contributions: $11,630 (reported on 13.7% of returns)
Here:
$11,630
State:
$18,201
(% of AGI for various income ranges: 8.3% for AGIs below $25k, 41.3% for AGIs $25k-50k, 107.5% for AGIs $50k-75k, 235.1% for AGIs $75k-100k, 371.1% for AGIs $100k-200k, 1480.4% for AGIs over 200k)
Taxes paid: $8,758 (reported on 15.9% of returns)
77578:
$8,758
State:
$7,821
(% of AGI for various income ranges: 17.9% for AGIs below $25k, 46.4% for AGIs $25k-50k, 140.2% for AGIs $50k-75k, 229.3% for AGIs $75k-100k, 377.7% for AGIs $100k-200k, 865.4% for AGIs over 200k)
Earned income credit: $2,363 (reported on 13.3% of returns)
Here:
$2,363
State:
$2,584
(% of AGI for various income ranges: 104.4% for AGIs below $25k, 78.1% for AGIs $25k-50k, 1.6% for AGIs $50k-75k)
Percentage of individuals using paid preparers for their 2020 taxes: 92.3%
Here:
92%
State:
92%
(% for various income ranges: 91.8% for AGIs below $25k, 93.5% for AGIs $25k-50k, 92.6% for AGIs $50k-75k, 93.0% for AGIs $75k-100k, 91.8% for AGIs $100k-200k, 91.6% for AGIs over 200k)
Averages for the 2012 tax year for zip code 77578, filed in 2013:
Average Adjusted Gross Income (AGI) in 2012: $83,991 (Individual Income Tax Returns)
Here:
$83,991
State:
$65,384
Salary/wage: $75,958 (reported on 88.3% of returns)
Here:
$75,958
State:
$52,524
(% of AGI for various income ranges: 80.9% for AGIs below $25k, 87.6% for AGIs $25k-50k, 86.2% for AGIs $50k-75k, 86.9% for AGIs $75k-100k, 87.8% for AGIs $100k-200k, 63.9% for AGIs over 200k)
Taxable interest for individuals: $1,514 (reported on 33.0% of returns)
This zip code:
$1,514
Texas:
$2,372
(% of AGI for various income ranges: 0.7% for AGIs below $25k, 0.6% for AGIs $25k-50k, 0.4% for AGIs $50k-75k, 0.4% for AGIs $75k-100k, 0.4% for AGIs $100k-200k, 1.0% for AGIs over 200k)
Ordinary dividends: $3,928 (reported on 17.2% of returns)
Here:
$3,928
State:
$9,721
(% of AGI for various income ranges: 1.0% for AGIs below $25k, 0.5% for AGIs $25k-50k, 0.3% for AGIs $50k-75k, 0.4% for AGIs $75k-100k, 0.4% for AGIs $100k-200k, 1.6% for AGIs over 200k)
Net capital gain/loss in AGI: +$6,225 (reported on 14.6% of returns)
Here:
+$6,225
State:
+$35,319
(% of AGI for various income ranges: 0.2% for AGIs $25k-50k, 0.3% for AGIs $50k-75k, 0.4% for AGIs $75k-100k, 0.5% for AGIs $100k-200k, 2.6% for AGIs over 200k)
Profit/loss from business: +$13,716 (reported on 20.0% of returns)
Here:
+$13,716
State:
+$13,732
(% of AGI for various income ranges: 9.0% for AGIs below $25k, 2.1% for AGIs $25k-50k, 3.0% for AGIs $50k-75k, 1.5% for AGIs $75k-100k, 2.9% for AGIs $100k-200k, 4.1% for AGIs over 200k)
Taxable individual retirement arrangement distribution: $18,404 (reported on 7.4% of returns)
77578:
$18,404
Texas:
$19,511
(% of AGI for various income ranges: 3.2% for AGIs below $25k, 2.1% for AGIs $25k-50k, 1.5% for AGIs $50k-75k, 2.0% for AGIs $75k-100k, 1.8% for AGIs $100k-200k, 1.0% for AGIs over 200k)
Self-employment retirement plans: $16,000 (reported on 0.7% of returns)
77578:
$16,000
Texas:
$23,938
(% of AGI for various income ranges: 0.4% for AGIs $100k-200k)
Total itemized deductions: $22,080 (16% of AGI, reported on 42.1% of returns)
Here:
$22,080
State:
$24,724
Here:
15.9% of AGI
State:
15.9% of AGI
(% of AGI for various income ranges: 10.5% for AGIs below $25k, 11.8% for AGIs $25k-50k, 14.0% for AGIs $50k-75k, 14.8% for AGIs $75k-100k, 12.6% for AGIs $100k-200k, 6.8% for AGIs over 200k)
Charity contributions: $4,727 (reported on 32.6% of returns)
Here:
$4,727
State:
$6,808
(% of AGI for various income ranges: 1.0% for AGIs below $25k, 1.5% for AGIs $25k-50k, 1.9% for AGIs $50k-75k, 1.9% for AGIs $75k-100k, 2.2% for AGIs $100k-200k, 1.6% for AGIs over 200k)
Taxes paid: $7,296 (reported on 41.5% of returns)
77578:
$7,296
State:
$6,921
(% of AGI for various income ranges: 2.3% for AGIs below $25k, 3.0% for AGIs $25k-50k, 4.2% for AGIs $50k-75k, 4.5% for AGIs $75k-100k, 4.3% for AGIs $100k-200k, 2.6% for AGIs over 200k)
Earned income credit: $2,347 (reported on 13.3% of returns)
Here:
$2,347
State:
$2,570
(% of AGI for various income ranges: 7.4% for AGIs below $25k, 1.0% for AGIs $25k-50k)
Percentage of individuals using paid preparers for their 2012 taxes: 47.9%
Here:
48%
State:
51%
(% for various income ranges: 46.1% for AGIs below $25k, 48.1% for AGIs $25k-50k, 50.0% for AGIs $50k-75k, 44.7% for AGIs $75k-100k, 46.9% for AGIs $100k-200k, 60.0% for AGIs over 200k)
Averages for the 2004 tax year for zip code 77578, filed in 2005:
Average Adjusted Gross Income (AGI) in 2004: $60,072 (Individual Income Tax Returns)
Here:
$60,072
State:
$47,881
Salary/wage: $59,376 (reported on 88.4% of returns)
Here:
$59,376
State:
$41,947
(% of AGI for various income ranges: 137.9% for AGIs below $10k, 79.3% for AGIs $10k-25k, 86.2% for AGIs $25k-50k, 88.0% for AGIs $50k-75k, 91.5% for AGIs $75k-100k, 86.0% for AGIs over 100k)
Taxable interest for individuals: $942 (reported on 44.1% of returns)
This zip code:
$942
Texas:
$2,255
(% of AGI for various income ranges: 6.9% for AGIs below $10k, 1.5% for AGIs $10k-25k, 1.0% for AGIs $25k-50k, 0.7% for AGIs $50k-75k, 0.4% for AGIs $75k-100k, 0.5% for AGIs over 100k)
Taxable dividends: $1,708 (reported on 20.8% of returns)
Here:
$1,708
State:
$4,261
(% of AGI for various income ranges: 3.4% for AGIs below $10k, 0.7% for AGIs $10k-25k, 0.4% for AGIs $25k-50k, 0.6% for AGIs $50k-75k, 0.3% for AGIs $75k-100k, 0.7% for AGIs over 100k)
Net capital gain/loss: +$5,201 (reported on 17.5% of returns)
Here:
+$5,201
State:
+$16,110
(% of AGI for various income ranges: -1.5% for AGIs below $10k, 0.2% for AGIs $10k-25k, -0.3% for AGIs $25k-50k, 0.4% for AGIs $50k-75k, 0.2% for AGIs $75k-100k, 3.1% for AGIs over 100k)
Profit/loss from business: +$8,708 (reported on 20.9% of returns)
Here:
+$8,708
State:
+$11,013
(% of AGI for various income ranges: 9.0% for AGIs below $10k, 6.3% for AGIs $10k-25k, 4.7% for AGIs $25k-50k, 2.2% for AGIs $50k-75k, 2.4% for AGIs $75k-100k, 2.6% for AGIs over 100k)
IRA payment deduction: $3,414 (reported on 2.5% of returns)
77578:
$3,414
Texas:
$3,120
(% of AGI for various income ranges: 0.3% for AGIs $25k-50k, 0.2% for AGIs $50k-75k, 0.2% for AGIs $75k-100k, 0.1% for AGIs over 100k)
Self-employed pension: $9,211 (reported on 0.5% of returns)
Here:
$9,211
Texas:
$16,401
Total itemized deductions: $18,803 (19% of AGI, reported on 40.1% of returns)
Here:
$18,803
State:
$19,631
Here:
19.3% of AGI
State:
18.9% of AGI
(% of AGI for various income ranges: 16.2% for AGIs below $10k, 8.8% for AGIs $10k-25k, 10.6% for AGIs $25k-50k, 13.6% for AGIs $50k-75k, 15.0% for AGIs $75k-100k, 12.1% for AGIs over 100k)
Charity contributions deductions: $3,501 (3% of AGI, reported on 32.5% of returns)
Here:
$3,501
State:
$4,753
Here:
3.4% of AGI
State:
4.2% of AGI
(% of AGI for various income ranges: 0.7% for AGIs below $10k, 0.7% for AGIs $10k-25k, 1.5% for AGIs $25k-50k, 1.7% for AGIs $50k-75k, 1.9% for AGIs $75k-100k, 2.2% for AGIs over 100k)
Total tax: $9,577 (reported on 80.4% of returns)
77578:
$9,577
State:
$9,058
(% of AGI for various income ranges: 4.7% for AGIs below $10k, 4.0% for AGIs $10k-25k, 7.1% for AGIs $25k-50k, 9.0% for AGIs $50k-75k, 10.8% for AGIs $75k-100k, 17.6% for AGIs over 100k)
Earned income credit: $1,806 (reported on 13.4% of returns)
Here:
$1,806
State:
$2,024
Percentage of individuals using paid preparers for their 2004 taxes: 51.4%
Here:
51%
State:
57%
(% for various income ranges: 48.6% for AGIs below $10k, 53.8% for AGIs $10k-25k, 53.7% for AGIs $25k-50k, 53.4% for AGIs $50k-75k, 45.0% for AGIs $75k-100k, 51.6% for AGIs over 100k)
Household received Food Stamps/SNAP in the past 12 months: 347 Household did not receive Food Stamps/SNAP in the past 12 months: 8,387
Women who had a birth in the past 12 months: 217 (219 now married, 1 unmarried) Women who did not have a birth in the past 12 months: 6,340 (3,666 now married, 2,645 unmarried)
Housing units in zip code 77578 with a mortgage: 5,792 (78 second mortgage, 28 both second mortgage and home equity loan) Houses without a mortgage: 27
Median monthly owner costs for units with a mortgage: $2,570 Median monthly owner costs for units without a mortgage: $809
Residents with income below the poverty level in 2022:
This zip code:
5.7%
Whole state:
14.0%
Residents with income below 50% of the poverty level in 2022:
This zip code:
4.5%
Whole state:
7.4%
Median number of rooms in houses and condos:
Here:
7.2
State:
6.3
Median number of rooms in apartments:
Here:
4.2
State:
4.0
Notable locations in this zip code not listed on our city pages
Churches in zip code 77578 include: Manvel Bible Chapel Church (A), Manvel Church of Christ (B), Primera Iglesia Bautista de Manvel Church (C). Display/hide their locations on the map
In group quarters: 72 (-1 institutionalized population)
Size of family households: 2,723 2-persons, 1,898 3-persons, 1,284 4-persons, 537 5-persons, 327 6-persons, 127 7-or-more-persons
Size of nonfamily households: 1,747 1-person, 58 2-persons, 26 3-persons
4,659 married couples with children.
844 single-parent households (378 men, 466 women).
78.3% of residents of 77578 zip code speak English at home.
13.1% of residents speak Spanish at home (75% very well, 11% well, 9% not well, 5% not at all).
2.4% of residents speak other Indo-European language at home (75% very well, 21% well, 4% not at all).
5.8% of residents speak Asian or Pacific Island language at home (76% very well, 20% well, 4% not well).
0.6% of residents speak other language at home (100% very well).
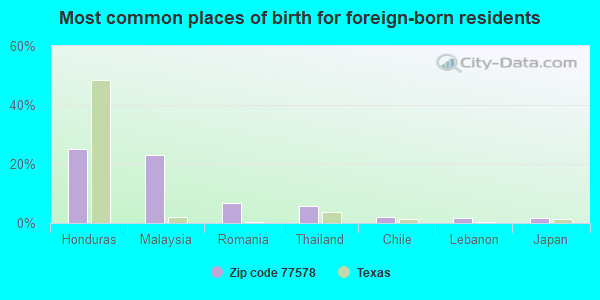
Foreign born population: 3,474 (13.9%) (71.4% of them are naturalized citizens)
This zip code:
13.9%
Whole state:
17.2%
25%Honduras
23%Malaysia
7%Romania
6%Thailand
2%Chile
2%Lebanon
2%Japan
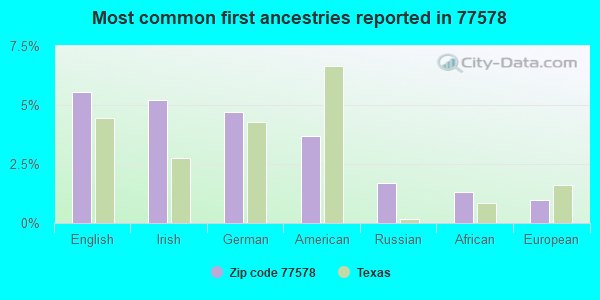
6%English
5%Irish
5%German
4%American
2%Russian
1%African
1%European
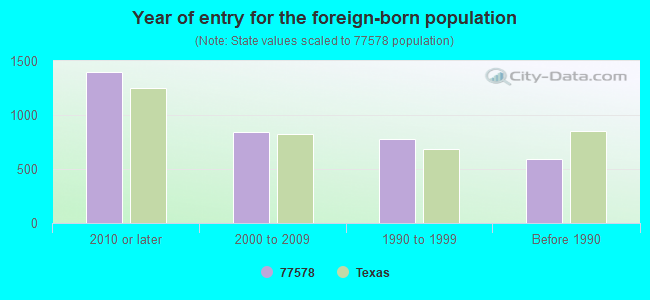
Year of entry for the foreign-born population
1,3972010 or later
8392000 to 2009
7751990 to 1999
592Before 1990
Facilities with environmental interests located in this zip code:
188 COMPRESSOR STATION 812 (9315 UZZELL in MANVEL, TX)
Small Quantity Generators, between 100 kg and 1000 kg of hazardous waste/month (Resource Conservation and Recovery Act (tracking hazardous waste)) HAZARDOUS WASTE BIENNIAL REPORTER (Resource Conservation and Recovery Act (tracking hazardous waste)) Large Quantity Generators, more that 1000 kg of hazardous waste/month (Resource Conservation and Recovery Act (tracking hazardous waste)) Organizations: ENTERPRISE PRODUCTS OPERATING LP (CONTACT/OPERATOR)
Alternative names: CHANNEL INDUSTRIES GAS STA 812
Housing units lacking complete plumbing facilities: 1.8% Housing units lacking complete kitchen facilities: 3.1%
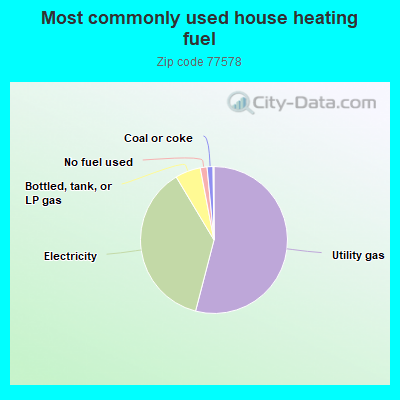
54.1%Utility gas
37.4%Electricity
5.6%Bottled, tank, or LP gas
1.5%No fuel used
1.3%Coal or coke
Population in 1990: 4,754. Population change in the 1990s: +649 (+13.7%).
Place of birth for U.S.-born residents:
This state: 15,206
Northeast: 997
Midwest: 1,200
South: 1,962
West: 2,057
65% of the 77578 zip code residents lived in the same house 5 years ago. Out of people who lived in different houses, 39% lived in this county. Out of people who lived in different counties, 50% lived in Texas.
87% of the 77578 zip code residents lived in the same house 1 year ago. Out of people who lived in different houses, 31% moved from this county. Out of people who lived in different houses, 43% moved from different county within same state. Out of people who lived in different houses, 27% moved from different state. Out of people who lived in different houses, 2% moved from abroad.
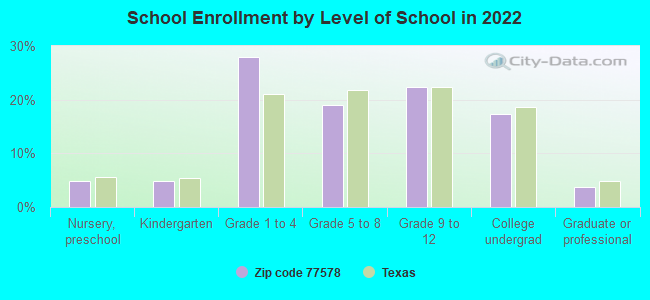
Private vs. public school enrollment:
Students in private schools in grades 1 to 8 (elementary and middle school): 429
Here:
12.7%
Texas:
8.8%
Students in private schools in grades 9 to 12 (high school): 276
Here:
17.2%
Texas:
8.0%
Students in private undergraduate colleges: 169
Here:
13.8%
Texas:
16.2%
Occupation by median earnings in the past 12 months ($)
148,317Legal occupations
129,057Management occupations
103,696Community and social service occupations
102,285Life, physical, and social science occupations
97,661Architecture and engineering occupations
96,142Computer and mathematical occupations
Top industries in this zip code by the number of employees in 2005:
Health Care and Social Assistance: Residential Mental Health and Substance Abuse Facilities (50-99 employees: 1 establishment)
Construction: Commercial and Institutional Building Construction (20-49: 1, 1-4: 3)
Professional, Scientific, and Technical Services: All Other Professional, Scientific, and Technical Services (20-49: 1)
Construction: Other Heavy and Civil Engineering Construction (20-49: 1)
People in group quarters in 2010:
21 people in residential treatment centers for juveniles (non-correctional)
20 people in group homes for juveniles (non-correctional)
8 people in group homes intended for adults
People in group quarters in 2000:
6 people in homes for the mentally retarded
Fatal accident statistics in 2014:
Fatal accident count: 1
Vehicles involved in fatal accidents: 1
Fatal accidents caused by drunken drivers: 0
Fatalities: 1
Persons involved in fatal accidents: 1
Pedestrians involved in fatal accidents: 0
Fatal accident statistics in 2013:
Fatal accident count: 1
Vehicles involved in fatal accidents: 2
Fatal accidents caused by drunken drivers: 0
Fatalities: 1
Persons involved in fatal accidents: 2
Pedestrians involved in fatal accidents: 0
Home Mortgage Disclosure Act Aggregated Statistics For Year 2009 (Based on 8 partial tracts)
A) FHA, FSA/RHS & VA Home Purchase Loans
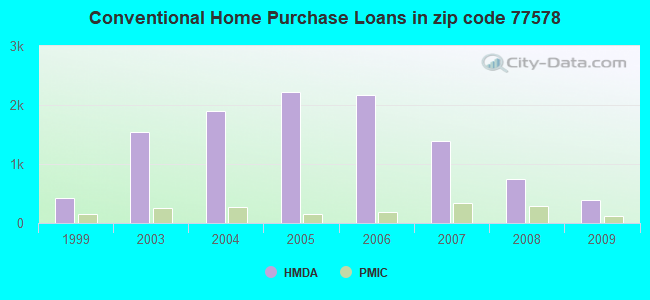
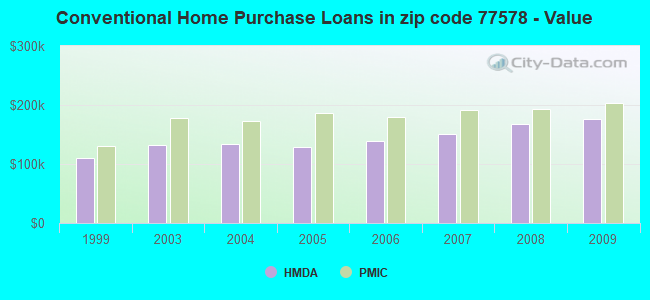
B) Conventional Home Purchase Loans
C) Refinancings
D) Home Improvement Loans
F) Non-occupant Loans on < 5 Family Dwellings (A B C & D)
G) Loans On Manufactured Home Dwelling (A B C & D)
Number
Average Value
Number
Average Value
Number
Average Value
Number
Average Value
Number
Average Value
Number
Average Value
LOANS ORIGINATED
352
$171,057
391
$175,447
920
$174,312
51
$50,417
31
$141,564
18
$83,331
APPLICATIONS APPROVED, NOT ACCEPTED
19
$196,162
43
$136,599
99
$163,174
9
$44,906
2
$150,135
7
$63,241
APPLICATIONS DENIED
73
$176,415
69
$154,116
329
$179,375
64
$26,944
16
$115,901
17
$68,818
APPLICATIONS WITHDRAWN
40
$178,432
65
$166,764
227
$168,085
19
$48,707
10
$171,091
3
$76,900
FILES CLOSED FOR INCOMPLETENESS
6
$132,828
13
$162,339
54
$158,947
5
$112,566
2
$129,840
4
$50,718
Aggregated Statistics For Year 2008 (Based on 8 partial tracts)
A) FHA, FSA/RHS & VA Home Purchase Loans
B) Conventional Home Purchase Loans
C) Refinancings
D) Home Improvement Loans
F) Non-occupant Loans on < 5 Family Dwellings (A B C & D)
G) Loans On Manufactured Home Dwelling (A B C & D)
Number
Average Value
Number
Average Value
Number
Average Value
Number
Average Value
Number
Average Value
Number
Average Value
LOANS ORIGINATED
274
$173,190
741
$167,812
371
$165,061
101
$40,929
52
$156,160
22
$51,111
APPLICATIONS APPROVED, NOT ACCEPTED
12
$154,207
82
$138,156
71
$148,910
27
$44,910
11
$87,590
18
$51,158
APPLICATIONS DENIED
81
$170,677
150
$166,824
352
$164,058
148
$45,604
24
$139,437
25
$79,774
APPLICATIONS WITHDRAWN
43
$185,441
130
$149,678
167
$170,062
10
$83,367
12
$131,898
3
$115,870
FILES CLOSED FOR INCOMPLETENESS
8
$126,908
18
$186,776
37
$182,982
8
$53,792
2
$125,375
1
$6,640
Aggregated Statistics For Year 2007 (Based on 8 partial tracts)
A) FHA, FSA/RHS & VA Home Purchase Loans
B) Conventional Home Purchase Loans
C) Refinancings
D) Home Improvement Loans
F) Non-occupant Loans on < 5 Family Dwellings (A B C & D)
G) Loans On Manufactured Home Dwelling (A B C & D)
Number
Average Value
Number
Average Value
Number
Average Value
Number
Average Value
Number
Average Value
Number
Average Value
LOANS ORIGINATED
101
$162,965
1,390
$150,971
376
$155,676
136
$50,987
79
$139,419
23
$60,438
APPLICATIONS APPROVED, NOT ACCEPTED
6
$148,388
228
$152,670
114
$148,154
38
$51,158
18
$150,731
15
$57,831
APPLICATIONS DENIED
37
$144,121
300
$153,240
461
$156,725
155
$47,745
32
$140,642
49
$62,030
APPLICATIONS WITHDRAWN
21
$165,425
207
$149,365
215
$150,143
23
$52,190
12
$139,587
6
$75,475
FILES CLOSED FOR INCOMPLETENESS
0
$0
51
$181,534
72
$184,165
2
$62,385
2
$141,340
0
$0
Aggregated Statistics For Year 2006 (Based on 8 partial tracts)
A) FHA, FSA/RHS & VA Home Purchase Loans
B) Conventional Home Purchase Loans
C) Refinancings
D) Home Improvement Loans
F) Non-occupant Loans on < 5 Family Dwellings (A B C & D)
G) Loans On Manufactured Home Dwelling (A B C & D)
Number
Average Value
Number
Average Value
Number
Average Value
Number
Average Value
Number
Average Value
Number
Average Value
LOANS ORIGINATED
101
$159,515
2,166
$138,215
393
$145,424
130
$41,269
169
$125,743
55
$77,991
APPLICATIONS APPROVED, NOT ACCEPTED
7
$138,871
427
$123,674
123
$136,419
20
$50,410
44
$122,632
29
$51,517
APPLICATIONS DENIED
15
$134,128
619
$139,532
433
$152,055
154
$49,472
77
$142,639
66
$60,435
APPLICATIONS WITHDRAWN
13
$169,726
298
$142,896
272
$145,688
20
$46,684
27
$127,574
5
$51,306
FILES CLOSED FOR INCOMPLETENESS
2
$92,215
85
$164,362
85
$165,756
9
$56,151
4
$151,030
3
$61,047
Aggregated Statistics For Year 2005 (Based on 8 partial tracts)
A) FHA, FSA/RHS & VA Home Purchase Loans
B) Conventional Home Purchase Loans
C) Refinancings
D) Home Improvement Loans
E) Loans on Dwellings For 5+ Families
F) Non-occupant Loans on < 5 Family Dwellings (A B C & D)
G) Loans On Manufactured Home Dwelling (A B C & D)
Number
Average Value
Number
Average Value
Number
Average Value
Number
Average Value
Number
Average Value
Number
Average Value
Number
Average Value
LOANS ORIGINATED
92
$157,849
2,214
$128,276
623
$136,111
131
$72,097
1
$30,092,720
134
$117,641
52
$71,691
APPLICATIONS APPROVED, NOT ACCEPTED
17
$135,970
401
$114,407
111
$150,154
29
$86,035
0
$0
9
$139,596
45
$50,734
APPLICATIONS DENIED
25
$125,716
487
$119,251
568
$140,839
132
$44,997
0
$0
45
$97,688
112
$51,916
APPLICATIONS WITHDRAWN
7
$179,459
377
$136,431
294
$178,193
57
$211,470
0
$0
39
$138,094
13
$74,499
FILES CLOSED FOR INCOMPLETENESS
4
$188,425
82
$160,040
124
$161,104
4
$71,595
0
$0
3
$114,883
1
$82,330
Aggregated Statistics For Year 2004 (Based on 8 partial tracts)
A) FHA, FSA/RHS & VA Home Purchase Loans
B) Conventional Home Purchase Loans
C) Refinancings
D) Home Improvement Loans
E) Loans on Dwellings For 5+ Families
F) Non-occupant Loans on < 5 Family Dwellings (A B C & D)
G) Loans On Manufactured Home Dwelling (A B C & D)
Number
Average Value
Number
Average Value
Number
Average Value
Number
Average Value
Number
Average Value
Number
Average Value
Number
Average Value
LOANS ORIGINATED
73
$148,676
1,903
$133,098
908
$136,681
128
$52,427
1
$24,018,960
77
$101,387
53
$66,579
APPLICATIONS APPROVED, NOT ACCEPTED
8
$156,636
356
$123,334
201
$138,487
28
$60,041
0
$0
14
$121,108
34
$43,724
APPLICATIONS DENIED
9
$150,088
366
$119,887
616
$138,369
111
$42,458
0
$0
25
$101,204
73
$54,107
APPLICATIONS WITHDRAWN
12
$141,237
208
$148,590
318
$136,831
15
$61,201
0
$0
15
$140,064
6
$102,455
FILES CLOSED FOR INCOMPLETENESS
0
$0
56
$172,460
122
$154,435
5
$37,752
0
$0
2
$83,770
0
$0
Aggregated Statistics For Year 2003 (Based on 8 partial tracts)
A) FHA, FSA/RHS & VA Home Purchase Loans
B) Conventional Home Purchase Loans
C) Refinancings
D) Home Improvement Loans
E) Loans on Dwellings For 5+ Families
F) Non-occupant Loans on < 5 Family Dwellings (A B C & D)
Number
Average Value
Number
Average Value
Number
Average Value
Number
Average Value
Number
Average Value
Number
Average Value
LOANS ORIGINATED
111
$142,196
1,544
$132,588
2,412
$137,799
109
$42,310
2
$991,565
63
$103,476
APPLICATIONS APPROVED, NOT ACCEPTED
12
$128,424
223
$117,304
306
$145,391
39
$38,111
0
$0
14
$151,036
APPLICATIONS DENIED
14
$137,342
242
$114,543
897
$127,796
80
$30,073
0
$0
20
$104,555
APPLICATIONS WITHDRAWN
19
$137,749
164
$142,269
480
$137,150
8
$28,756
0
$0
6
$70,103
FILES CLOSED FOR INCOMPLETENESS
1
$97,250
31
$174,516
69
$160,491
2
$35,385
0
$0
2
$181,260
Aggregated Statistics For Year 1999 (Based on 4 partial tracts)
A) FHA, FSA/RHS & VA Home Purchase Loans
B) Conventional Home Purchase Loans
C) Refinancings
D) Home Improvement Loans
F) Non-occupant Loans on < 5 Family Dwellings (A B C & D)
2002 - 2018 National Fire Incident Reporting System (NFIRS) incidents
Based on the data from the years 2002 - 2018 the average number of fires per year is 34. The highest number of reported fire incidents - 56 took place in 2009, and the least - 15 in 2002. The data has a rising trend.
When looking into fire subcategories, the most incidents belonged to: Outside Fires (47.0%), and Structure Fires (26.0%).
Fire incident types reported to NFIRS in Zip Code 77578
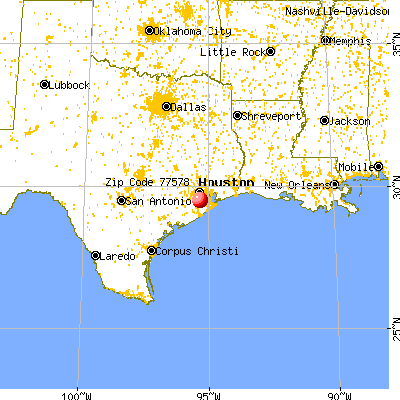


 Nearest zip codes: 77584, 77581, 77545, 77047, 77048, 77053.


 Based on the data from the years 2002 - 2018 the average number of fires per year is 34. The highest number of reported fire incidents - 56 took place in 2009, and the least - 15 in 2002. The data has a rising trend.
 When looking into fire subcategories, the most incidents belonged to: Outside Fires (47.0%), and Structure Fires (26.0%).