Estimated zip code population in 2022: 43,010
Zip code population in 2010: 38,158
Zip code population in 2000: 25,359
Houses and condos: 11,435
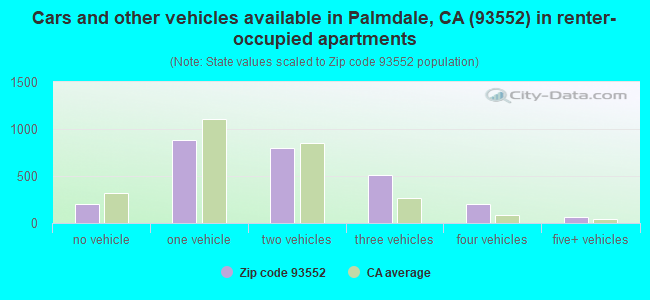
Renter-occupied apartments: 2,668
% of renters here:
24%State:
44%
March 2022 cost of living index in zip code 93552: 128.6
(high, U.S. average is 100)
Land area: 48.5
sq. mi.
Water area: 0.2
sq. mi.
Population density: 887 people per square mile (low).
OSM Map
General Map
Google Map
MSN Map
OSM Map
General Map
Google Map
MSN Map
OSM Map
General Map
Google Map
MSN Map
OSM Map
General Map
Google Map
MSN Map
Please wait while loading the map...
Real estate property taxes paid for housing units in 2022:
This zip code:
1.0% ($4,109)California:
0.7% ($4,831)
Median real estate property taxes paid for housing units with mortgages in 2022: $4,188 (1.0%)
Median real estate property taxes paid for housing units with no mortgage in 2022: $3,899 (1.0%)
Profiles of local businesses
Business Search - 14 Million verified businesses
Males: 22,118 Females: 20,891
For population 25 years and over in 93552:
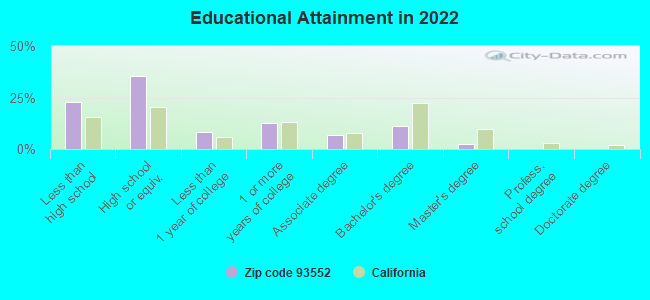
High school or higher: 76.2%Bachelor's degree or higher: 13.9%Graduate or professional degree: 2.8%Unemployed: 5.7%Mean travel time to work (commute): 44.7 minutes
For population 15 years and over in 93552:
Never married: 42.3%Now married: 46.7%Separated: 1.7%Widowed: 3.1%Divorced: 6.1%
Zip code 93552 compared to state average:
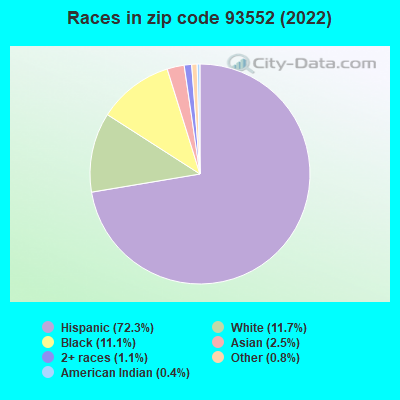
Median house value below state average. Black race population percentage above state average. Hispanic race population percentage above state average. Median age below state average. Renting percentage below state average. Length of stay since moving in above state average. Number of rooms per house above state average. House age below state average. Percentage of population with a bachelor's degree or higher significantly below state average. 31,114 72.3% Hispanic or Latino 5,042 11.7% White 4,788 11.1% Black 1,091 2.5% Asian 464 1.1% Two or more races 327 0.8% Some other race 163 0.4% American Indian 17 0.04% Native Hawaiian and Other
Data:
Median household income ($)
Median household income (% change since 2000)
Household income diversity
Ratio of average income to average house value (%)
Ratio of average income to average rent
Median household income ($) - White
Median household income ($) - Black or African American
Median household income ($) - Asian
Median household income ($) - Hispanic or Latino
Median household income ($) - American Indian and Alaska Native
Median household income ($) - Multirace
Median household income ($) - Other Race
Median household income for houses/condos with a mortgage ($)
Median household income for apartments without a mortgage ($)
Races - White alone (%)
Races - White alone (% change since 2000)
Races - Black alone (%)
Races - Black alone (% change since 2000)
Races - American Indian alone (%)
Races - American Indian alone (% change since 2000)
Races - Asian alone (%)
Races - Asian alone (% change since 2000)
Races - Hispanic (%)
Races - Hispanic (% change since 2000)
Races - Native Hawaiian and Other Pacific Islander alone (%)
Races - Native Hawaiian and Other Pacific Islander alone (% change since 2000)
Races - Two or more races (%)
Races - Two or more races (% change since 2000)
Races - Other race alone (%)
Races - Other race alone (% change since 2000)
Racial diversity
Unemployment (%)
Unemployment (% change since 2000)
Unemployment (%) - White
Unemployment (%) - Black or African American
Unemployment (%) - Asian
Unemployment (%) - Hispanic or Latino
Unemployment (%) - American Indian and Alaska Native
Unemployment (%) - Multirace
Unemployment (%) - Other Race
Population density (people per square mile)
Population - Males (%)
Population - Females (%)
Population - Males (%) - White
Population - Males (%) - Black or African American
Population - Males (%) - Asian
Population - Males (%) - Hispanic or Latino
Population - Males (%) - American Indian and Alaska Native
Population - Males (%) - Multirace
Population - Males (%) - Other Race
Population - Females (%) - White
Population - Females (%) - Black or African American
Population - Females (%) - Asian
Population - Females (%) - Hispanic or Latino
Population - Females (%) - American Indian and Alaska Native
Population - Females (%) - Multirace
Population - Females (%) - Other Race
Coronavirus confirmed cases (Jun 10, 2024)
Deaths caused by coronavirus (Jun 10, 2024)
Coronavirus confirmed cases (per 100k population) (Jun 10, 2024)
Deaths caused by coronavirus (per 100k population) (Jun 10, 2024)
Daily increase in number of cases (Jun 10, 2024)
Weekly increase in number of cases (Jun 10, 2024)
Cases doubled (in days) (Jun 10, 2024)
Hospitalized patients (Apr 18, 2022)
Negative test results (Apr 18, 2022)
Total test results (Apr 18, 2022)
COVID Vaccine doses distributed (per 100k population) (Sep 19, 2023)
COVID Vaccine doses administered (per 100k population) (Sep 19, 2023)
COVID Vaccine doses distributed (Sep 19, 2023)
COVID Vaccine doses administered (Sep 19, 2023)
Likely homosexual households (%)
Likely homosexual households (% change since 2000)
Likely homosexual households - Lesbian couples (%)
Likely homosexual households - Lesbian couples (% change since 2000)
Likely homosexual households - Gay men (%)
Likely homosexual households - Gay men (% change since 2000)
Cost of living index
Median gross rent ($)
Median contract rent ($)
Median monthly housing costs ($)
Median house or condo value ($)
Median house or condo value ($ change since 2000)
Mean house or condo value by units in structure - 1, detached ($)
Mean house or condo value by units in structure - 1, attached ($)
Mean house or condo value by units in structure - 2 ($)
Mean house or condo value by units in structure by units in structure - 3 or 4 ($)
Mean house or condo value by units in structure - 5 or more ($)
Mean house or condo value by units in structure - Boat, RV, van, etc. ($)
Mean house or condo value by units in structure - Mobile home ($)
Median house or condo value ($) - White
Median house or condo value ($) - Black or African American
Median house or condo value ($) - Asian
Median house or condo value ($) - Hispanic or Latino
Median house or condo value ($) - American Indian and Alaska Native
Median house or condo value ($) - Multirace
Median house or condo value ($) - Other Race
Median resident age
Resident age diversity
Median resident age - Males
Median resident age - Females
Median resident age - White
Median resident age - Black or African American
Median resident age - Asian
Median resident age - Hispanic or Latino
Median resident age - American Indian and Alaska Native
Median resident age - Multirace
Median resident age - Other Race
Median resident age - Males - White
Median resident age - Males - Black or African American
Median resident age - Males - Asian
Median resident age - Males - Hispanic or Latino
Median resident age - Males - American Indian and Alaska Native
Median resident age - Males - Multirace
Median resident age - Males - Other Race
Median resident age - Females - White
Median resident age - Females - Black or African American
Median resident age - Females - Asian
Median resident age - Females - Hispanic or Latino
Median resident age - Females - American Indian and Alaska Native
Median resident age - Females - Multirace
Median resident age - Females - Other Race
Commute - mean travel time to work (minutes)
Travel time to work - Less than 5 minutes (%)
Travel time to work - Less than 5 minutes (% change since 2000)
Travel time to work - 5 to 9 minutes (%)
Travel time to work - 5 to 9 minutes (% change since 2000)
Travel time to work - 10 to 19 minutes (%)
Travel time to work - 10 to 19 minutes (% change since 2000)
Travel time to work - 20 to 29 minutes (%)
Travel time to work - 20 to 29 minutes (% change since 2000)
Travel time to work - 30 to 39 minutes (%)
Travel time to work - 30 to 39 minutes (% change since 2000)
Travel time to work - 40 to 59 minutes (%)
Travel time to work - 40 to 59 minutes (% change since 2000)
Travel time to work - 60 to 89 minutes (%)
Travel time to work - 60 to 89 minutes (% change since 2000)
Travel time to work - 90 or more minutes (%)
Travel time to work - 90 or more minutes (% change since 2000)
Marital status - Never married (%)
Marital status - Now married (%)
Marital status - Separated (%)
Marital status - Widowed (%)
Marital status - Divorced (%)
Median family income ($)
Median family income (% change since 2000)
Median non-family income ($)
Median non-family income (% change since 2000)
Median per capita income ($)
Median per capita income (% change since 2000)
Median family income ($) - White
Median family income ($) - Black or African American
Median family income ($) - Asian
Median family income ($) - Hispanic or Latino
Median family income ($) - American Indian and Alaska Native
Median family income ($) - Multirace
Median family income ($) - Other Race
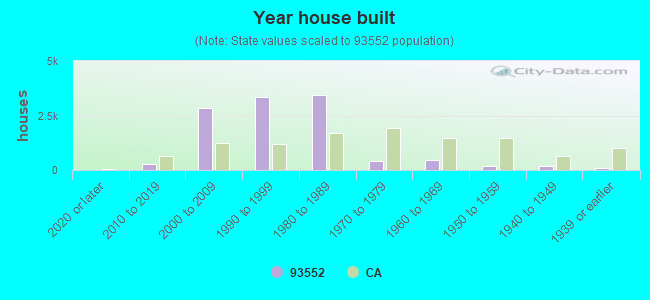
Median year house/condo built
Median year apartment built
Year house built - Built 2005 or later (%)
Year house built - Built 2000 to 2004 (%)
Year house built - Built 1990 to 1999 (%)
Year house built - Built 1980 to 1989 (%)
Year house built - Built 1970 to 1979 (%)
Year house built - Built 1960 to 1969 (%)
Year house built - Built 1950 to 1959 (%)
Year house built - Built 1940 to 1949 (%)
Year house built - Built 1939 or earlier (%)
Average household size
Household density (households per square mile)
Average household size - White
Average household size - Black or African American
Average household size - Asian
Average household size - Hispanic or Latino
Average household size - American Indian and Alaska Native
Average household size - Multirace
Average household size - Other Race
Occupied housing units (%)
Vacant housing units (%)
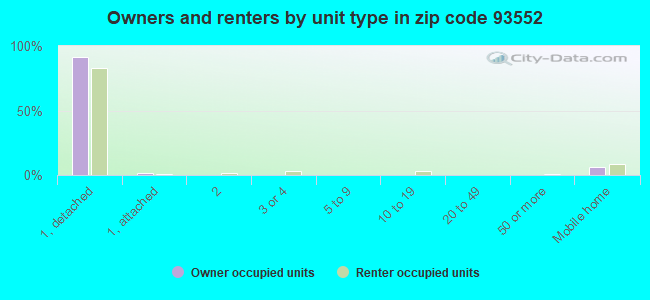
Owner occupied housing units (%)
Renter occupied housing units (%)
Vacancy status - For rent (%)
Vacancy status - For sale only (%)
Vacancy status - Rented or sold, not occupied (%)
Vacancy status - For seasonal, recreational, or occasional use (%)
Vacancy status - For migrant workers (%)
Vacancy status - Other vacant (%)
Residents with income below the poverty level (%)
Residents with income below 50% of the poverty level (%)
Children below poverty level (%)
Poor families by family type - Married-couple family (%)
Poor families by family type - Male, no wife present (%)
Poor families by family type - Female, no husband present (%)
Poverty status for native-born residents (%)
Poverty status for foreign-born residents (%)
Poverty among high school graduates not in families (%)
Poverty among people who did not graduate high school not in families (%)
Residents with income below the poverty level (%) - White
Residents with income below the poverty level (%) - Black or African American
Residents with income below the poverty level (%) - Asian
Residents with income below the poverty level (%) - Hispanic or Latino
Residents with income below the poverty level (%) - American Indian and Alaska Native
Residents with income below the poverty level (%) - Multirace
Residents with income below the poverty level (%) - Other Race
Air pollution - Air Quality Index (AQI)
Air pollution - CO
Air pollution - NO2
Air pollution - SO2
Air pollution - Ozone
Air pollution - PM10
Air pollution - PM25
Air pollution - Pb
Crime - Murders per 100,000 population
Crime - Rapes per 100,000 population
Crime - Robberies per 100,000 population
Crime - Assaults per 100,000 population
Crime - Burglaries per 100,000 population
Crime - Thefts per 100,000 population
Crime - Auto thefts per 100,000 population
Crime - Arson per 100,000 population
Crime - City-data.com crime index
Crime - Violent crime index
Crime - Property crime index
Crime - Murders per 100,000 population (5 year average)
Crime - Rapes per 100,000 population (5 year average)
Crime - Robberies per 100,000 population (5 year average)
Crime - Assaults per 100,000 population (5 year average)
Crime - Burglaries per 100,000 population (5 year average)
Crime - Thefts per 100,000 population (5 year average)
Crime - Auto thefts per 100,000 population (5 year average)
Crime - Arson per 100,000 population (5 year average)
Crime - City-data.com crime index (5 year average)
Crime - Violent crime index (5 year average)
Crime - Property crime index (5 year average)
1996 Presidential Elections Results (%) - Democratic Party (Clinton)
1996 Presidential Elections Results (%) - Republican Party (Dole)
1996 Presidential Elections Results (%) - Other
2000 Presidential Elections Results (%) - Democratic Party (Gore)
2000 Presidential Elections Results (%) - Republican Party (Bush)
2000 Presidential Elections Results (%) - Other
2004 Presidential Elections Results (%) - Democratic Party (Kerry)
2004 Presidential Elections Results (%) - Republican Party (Bush)
2004 Presidential Elections Results (%) - Other
2008 Presidential Elections Results (%) - Democratic Party (Obama)
2008 Presidential Elections Results (%) - Republican Party (McCain)
2008 Presidential Elections Results (%) - Other
2012 Presidential Elections Results (%) - Democratic Party (Obama)
2012 Presidential Elections Results (%) - Republican Party (Romney)
2012 Presidential Elections Results (%) - Other
2016 Presidential Elections Results (%) - Democratic Party (Clinton)
2016 Presidential Elections Results (%) - Republican Party (Trump)
2016 Presidential Elections Results (%) - Other
2020 Presidential Elections Results (%) - Democratic Party (Biden)
2020 Presidential Elections Results (%) - Republican Party (Trump)
2020 Presidential Elections Results (%) - Other
Ancestries Reported - Arab (%)
Ancestries Reported - Czech (%)
Ancestries Reported - Danish (%)
Ancestries Reported - Dutch (%)
Ancestries Reported - English (%)
Ancestries Reported - French (%)
Ancestries Reported - French Canadian (%)
Ancestries Reported - German (%)
Ancestries Reported - Greek (%)
Ancestries Reported - Hungarian (%)
Ancestries Reported - Irish (%)
Ancestries Reported - Italian (%)
Ancestries Reported - Lithuanian (%)
Ancestries Reported - Norwegian (%)
Ancestries Reported - Polish (%)
Ancestries Reported - Portuguese (%)
Ancestries Reported - Russian (%)
Ancestries Reported - Scotch-Irish (%)
Ancestries Reported - Scottish (%)
Ancestries Reported - Slovak (%)
Ancestries Reported - Subsaharan African (%)
Ancestries Reported - Swedish (%)
Ancestries Reported - Swiss (%)
Ancestries Reported - Ukrainian (%)
Ancestries Reported - United States (%)
Ancestries Reported - Welsh (%)
Ancestries Reported - West Indian (%)
Ancestries Reported - Other (%)
Educational Attainment - No schooling completed (%)
Educational Attainment - Less than high school (%)
Educational Attainment - High school or equivalent (%)
Educational Attainment - Less than 1 year of college (%)
Educational Attainment - 1 or more years of college (%)
Educational Attainment - Associate degree (%)
Educational Attainment - Bachelor's degree (%)
Educational Attainment - Master's degree (%)
Educational Attainment - Professional school degree (%)
Educational Attainment - Doctorate degree (%)
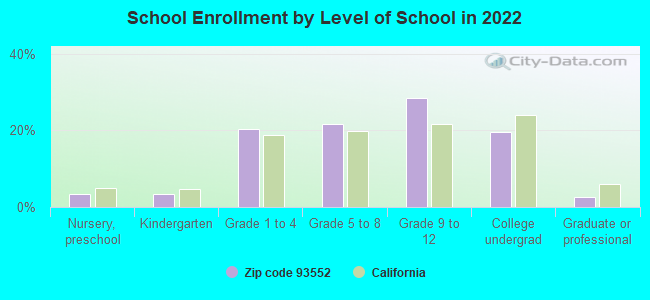
School Enrollment - Nursery, preschool (%)
School Enrollment - Kindergarten (%)
School Enrollment - Grade 1 to 4 (%)
School Enrollment - Grade 5 to 8 (%)
School Enrollment - Grade 9 to 12 (%)
School Enrollment - College undergrad (%)
School Enrollment - Graduate or professional (%)
School Enrollment - Not enrolled in school (%)
School enrollment - Public schools (%)
School enrollment - Private schools (%)
School enrollment - Not enrolled (%)
Median number of rooms in houses and condos
Median number of rooms in apartments
Housing units lacking complete plumbing facilities (%)
Housing units lacking complete kitchen facilities (%)
Density of houses
Urban houses (%)
Rural houses (%)
Households with people 60 years and over (%)
Households with people 65 years and over (%)
Households with people 75 years and over (%)
Households with one or more nonrelatives (%)
Households with no nonrelatives (%)
Population in households (%)
Family households (%)
Nonfamily households (%)
Population in families (%)
Family households with own children (%)
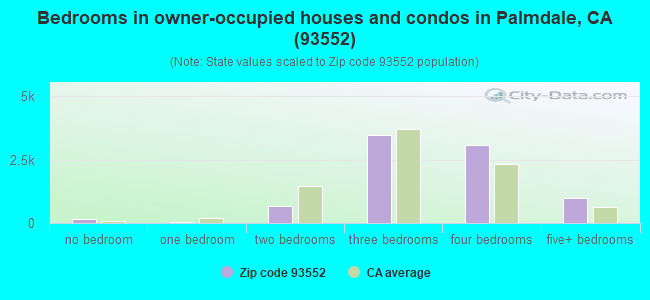
Median number of bedrooms in owner occupied houses
Mean number of bedrooms in owner occupied houses
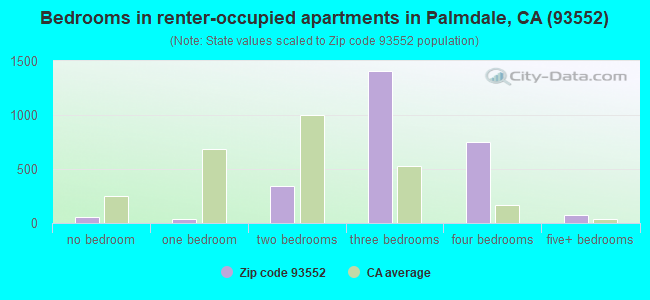
Median number of bedrooms in renter occupied houses
Mean number of bedrooms in renter occupied houses
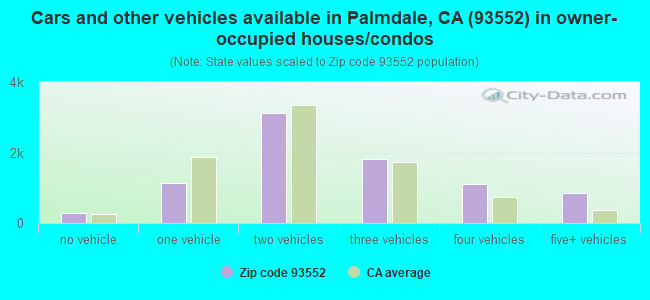
Median number of vehichles in owner occupied houses
Mean number of vehichles in owner occupied houses
Median number of vehichles in renter occupied houses
Mean number of vehichles in renter occupied houses
Mortgage status - with mortgage (%)
Mortgage status - with second mortgage (%)
Mortgage status - with home equity loan (%)
Mortgage status - with both second mortgage and home equity loan (%)
Mortgage status - without a mortgage (%)
Average family size
Average family size - White
Average family size - Black or African American
Average family size - Asian
Average family size - Hispanic or Latino
Average family size - American Indian and Alaska Native
Average family size - Multirace
Average family size - Other Race
Geographical mobility - Same house 1 year ago (%)
Geographical mobility - Moved within same county (%)
Geographical mobility - Moved from different county within same state (%)
Geographical mobility - Moved from different state (%)
Geographical mobility - Moved from abroad (%)
Place of birth - Born in state of residence (%)
Place of birth - Born in other state (%)
Place of birth - Native, outside of US (%)
Place of birth - Foreign born (%)
Housing units in structures - 1, detached (%)
Housing units in structures - 1, attached (%)
Housing units in structures - 2 (%)
Housing units in structures - 3 or 4 (%)
Housing units in structures - 5 to 9 (%)
Housing units in structures - 10 to 19 (%)
Housing units in structures - 20 to 49 (%)
Housing units in structures - 50 or more (%)
Housing units in structures - Mobile home (%)
Housing units in structures - Boat, RV, van, etc. (%)
House/condo owner moved in on average (years ago)
Renter moved in on average (years ago)
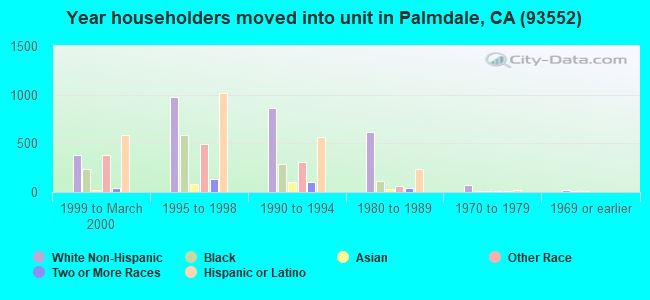
Year householder moved into unit - Moved in 1999 to March 2000 (%)
Year householder moved into unit - Moved in 1995 to 1998 (%)
Year householder moved into unit - Moved in 1990 to 1994 (%)
Year householder moved into unit - Moved in 1980 to 1989 (%)
Year householder moved into unit - Moved in 1970 to 1979 (%)
Year householder moved into unit - Moved in 1969 or earlier (%)
Means of transportation to work - Drove car alone (%)
Means of transportation to work - Carpooled (%)
Means of transportation to work - Public transportation (%)
Means of transportation to work - Bus or trolley bus (%)
Means of transportation to work - Streetcar or trolley car (%)
Means of transportation to work - Subway or elevated (%)
Means of transportation to work - Railroad (%)
Means of transportation to work - Ferryboat (%)
Means of transportation to work - Taxicab (%)
Means of transportation to work - Motorcycle (%)
Means of transportation to work - Bicycle (%)
Means of transportation to work - Walked (%)
Means of transportation to work - Other means (%)
Working at home (%)
Industry diversity
Most Common Industries - Agriculture, forestry, fishing and hunting, and mining (%)
Most Common Industries - Agriculture, forestry, fishing and hunting (%)
Most Common Industries - Mining, quarrying, and oil and gas extraction (%)
Most Common Industries - Construction (%)
Most Common Industries - Manufacturing (%)
Most Common Industries - Wholesale trade (%)
Most Common Industries - Retail trade (%)
Most Common Industries - Transportation and warehousing, and utilities (%)
Most Common Industries - Transportation and warehousing (%)
Most Common Industries - Utilities (%)
Most Common Industries - Information (%)
Most Common Industries - Finance and insurance, and real estate and rental and leasing (%)
Most Common Industries - Finance and insurance (%)
Most Common Industries - Real estate and rental and leasing (%)
Most Common Industries - Professional, scientific, and management, and administrative and waste management services (%)
Most Common Industries - Professional, scientific, and technical services (%)
Most Common Industries - Management of companies and enterprises (%)
Most Common Industries - Administrative and support and waste management services (%)
Most Common Industries - Educational services, and health care and social assistance (%)
Most Common Industries - Educational services (%)
Most Common Industries - Health care and social assistance (%)
Most Common Industries - Arts, entertainment, and recreation, and accommodation and food services (%)
Most Common Industries - Arts, entertainment, and recreation (%)
Most Common Industries - Accommodation and food services (%)
Most Common Industries - Other services, except public administration (%)
Most Common Industries - Public administration (%)
Occupation diversity
Most Common Occupations - Management, business, science, and arts occupations (%)
Most Common Occupations - Management, business, and financial occupations (%)
Most Common Occupations - Management occupations (%)
Most Common Occupations - Business and financial operations occupations (%)
Most Common Occupations - Computer, engineering, and science occupations (%)
Most Common Occupations - Computer and mathematical occupations (%)
Most Common Occupations - Architecture and engineering occupations (%)
Most Common Occupations - Life, physical, and social science occupations (%)
Most Common Occupations - Education, legal, community service, arts, and media occupations (%)
Most Common Occupations - Community and social service occupations (%)
Most Common Occupations - Legal occupations (%)
Most Common Occupations - Education, training, and library occupations (%)
Most Common Occupations - Arts, design, entertainment, sports, and media occupations (%)
Most Common Occupations - Healthcare practitioners and technical occupations (%)
Most Common Occupations - Health diagnosing and treating practitioners and other technical occupations (%)
Most Common Occupations - Health technologists and technicians (%)
Most Common Occupations - Service occupations (%)
Most Common Occupations - Healthcare support occupations (%)
Most Common Occupations - Protective service occupations (%)
Most Common Occupations - Fire fighting and prevention, and other protective service workers including supervisors (%)
Most Common Occupations - Law enforcement workers including supervisors (%)
Most Common Occupations - Food preparation and serving related occupations (%)
Most Common Occupations - Building and grounds cleaning and maintenance occupations (%)
Most Common Occupations - Personal care and service occupations (%)
Most Common Occupations - Sales and office occupations (%)
Most Common Occupations - Sales and related occupations (%)
Most Common Occupations - Office and administrative support occupations (%)
Most Common Occupations - Natural resources, construction, and maintenance occupations (%)
Most Common Occupations - Farming, fishing, and forestry occupations (%)
Most Common Occupations - Construction and extraction occupations (%)
Most Common Occupations - Installation, maintenance, and repair occupations (%)
Most Common Occupations - Production, transportation, and material moving occupations (%)
Most Common Occupations - Production occupations (%)
Most Common Occupations - Transportation occupations (%)
Most Common Occupations - Material moving occupations (%)
People in Group quarters - Institutionalized population (%)
People in Group quarters - Correctional institutions (%)
People in Group quarters - Federal prisons and detention centers (%)
People in Group quarters - Halfway houses (%)
People in Group quarters - Local jails and other confinement facilities (including police lockups) (%)
People in Group quarters - Military disciplinary barracks (%)
People in Group quarters - State prisons (%)
People in Group quarters - Other types of correctional institutions (%)
People in Group quarters - Nursing homes (%)
People in Group quarters - Hospitals/wards, hospices, and schools for the handicapped (%)
People in Group quarters - Hospitals/wards and hospices for chronically ill (%)
People in Group quarters - Hospices or homes for chronically ill (%)
People in Group quarters - Military hospitals or wards for chronically ill (%)
People in Group quarters - Other hospitals or wards for chronically ill (%)
People in Group quarters - Hospitals or wards for drug/alcohol abuse (%)
People in Group quarters - Mental (Psychiatric) hospitals or wards (%)
People in Group quarters - Schools, hospitals, or wards for the mentally retarded (%)
People in Group quarters - Schools, hospitals, or wards for the physically handicapped (%)
People in Group quarters - Institutions for the deaf (%)
People in Group quarters - Institutions for the blind (%)
People in Group quarters - Orthopedic wards and institutions for the physically handicapped (%)
People in Group quarters - Wards in general hospitals for patients who have no usual home elsewhere (%)
People in Group quarters - Wards in military hospitals for patients who have no usual home elsewhere (%)
People in Group quarters - Juvenile institutions (%)
People in Group quarters - Long-term care (%)
People in Group quarters - Homes for abused, dependent, and neglected children (%)
People in Group quarters - Residential treatment centers for emotionally disturbed children (%)
People in Group quarters - Training schools for juvenile delinquents (%)
People in Group quarters - Short-term care, detention or diagnostic centers for delinquent children (%)
People in Group quarters - Type of juvenile institution unknown (%)
People in Group quarters - Noninstitutionalized population (%)
People in Group quarters - College dormitories (includes college quarters off campus) (%)
People in Group quarters - Military quarters (%)
People in Group quarters - On base (%)
People in Group quarters - Barracks, unaccompanied personnel housing (UPH), (Enlisted/Officer), ;and similar group living quarters for military personnel (%)
People in Group quarters - Transient quarters for temporary residents (%)
People in Group quarters - Military ships (%)
People in Group quarters - Group homes (%)
People in Group quarters - Homes or halfway houses for drug/alcohol abuse (%)
People in Group quarters - Homes for the mentally ill (%)
People in Group quarters - Homes for the mentally retarded (%)
People in Group quarters - Homes for the physically handicapped (%)
People in Group quarters - Other group homes (%)
People in Group quarters - Religious group quarters (%)
People in Group quarters - Dormitories (%)
People in Group quarters - Agriculture workers' dormitories on farms (%)
People in Group quarters - Job Corps and vocational training facilities (%)
People in Group quarters - Other workers' dormitories (%)
People in Group quarters - Crews of maritime vessels (%)
People in Group quarters - Other nonhousehold living situations (%)
People in Group quarters - Other noninstitutional group quarters (%)
Residents speaking English at home (%)
Residents speaking English at home - Born in the United States (%)
Residents speaking English at home - Native, born elsewhere (%)
Residents speaking English at home - Foreign born (%)
Residents speaking Spanish at home (%)
Residents speaking Spanish at home - Born in the United States (%)
Residents speaking Spanish at home - Native, born elsewhere (%)
Residents speaking Spanish at home - Foreign born (%)
Residents speaking other language at home (%)
Residents speaking other language at home - Born in the United States (%)
Residents speaking other language at home - Native, born elsewhere (%)
Residents speaking other language at home - Foreign born (%)
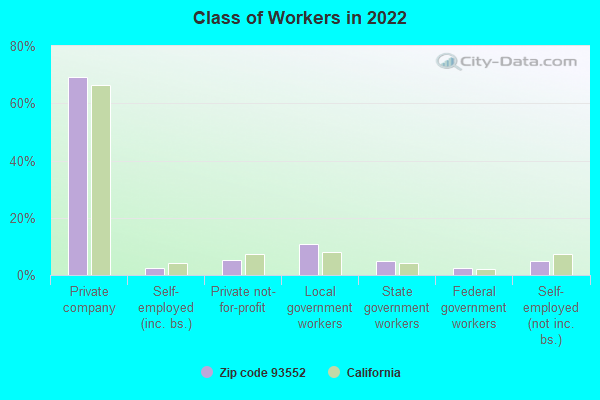
Class of Workers - Employee of private company (%)
Class of Workers - Self-employed in own incorporated business (%)
Class of Workers - Private not-for-profit wage and salary workers (%)
Class of Workers - Local government workers (%)
Class of Workers - State government workers (%)
Class of Workers - Federal government workers (%)
Class of Workers - Self-employed workers in own not incorporated business and Unpaid family workers (%)
House heating fuel used in houses and condos - Utility gas (%)
House heating fuel used in houses and condos - Bottled, tank, or LP gas (%)
House heating fuel used in houses and condos - Electricity (%)
House heating fuel used in houses and condos - Fuel oil, kerosene, etc. (%)
House heating fuel used in houses and condos - Coal or coke (%)
House heating fuel used in houses and condos - Wood (%)
House heating fuel used in houses and condos - Solar energy (%)
House heating fuel used in houses and condos - Other fuel (%)
House heating fuel used in houses and condos - No fuel used (%)
House heating fuel used in apartments - Utility gas (%)
House heating fuel used in apartments - Bottled, tank, or LP gas (%)
House heating fuel used in apartments - Electricity (%)
House heating fuel used in apartments - Fuel oil, kerosene, etc. (%)
House heating fuel used in apartments - Coal or coke (%)
House heating fuel used in apartments - Wood (%)
House heating fuel used in apartments - Solar energy (%)
House heating fuel used in apartments - Other fuel (%)
House heating fuel used in apartments - No fuel used (%)
Armed forces status - In Armed Forces (%)
Armed forces status - Civilian (%)
Armed forces status - Civilian - Veteran (%)
Armed forces status - Civilian - Nonveteran (%)
Fatal accidents locations in years 2005-2021
Fatal accidents locations in 2005
Fatal accidents locations in 2006
Fatal accidents locations in 2007
Fatal accidents locations in 2008
Fatal accidents locations in 2009
Fatal accidents locations in 2010
Fatal accidents locations in 2011
Fatal accidents locations in 2012
Fatal accidents locations in 2013
Fatal accidents locations in 2014
Fatal accidents locations in 2015
Fatal accidents locations in 2016
Fatal accidents locations in 2017
Fatal accidents locations in 2018
Fatal accidents locations in 2019
Fatal accidents locations in 2020
Fatal accidents locations in 2021
Alcohol use - People drinking some alcohol every month (%)
Alcohol use - People not drinking at all (%)
Alcohol use - Average days/month drinking alcohol
Alcohol use - Average drinks/week
Alcohol use - Average days/year people drink much
Audiometry - Average condition of hearing (%)
Audiometry - People that can hear a whisper from across a quiet room (%)
Audiometry - People that can hear normal voice from across a quiet room (%)
Audiometry - Ears ringing, roaring, buzzing (%)
Audiometry - Had a job exposure to loud noise (%)
Audiometry - Had off-work exposure to loud noise (%)
Blood Pressure & Cholesterol - Has high blood pressure (%)
Blood Pressure & Cholesterol - Checking blood pressure at home (%)
Blood Pressure & Cholesterol - Frequently checking blood cholesterol (%)
Blood Pressure & Cholesterol - Has high cholesterol level (%)
Consumer Behavior - Money monthly spent on food at supermarket/grocery store
Consumer Behavior - Money monthly spent on food at other stores
Consumer Behavior - Money monthly spent on eating out
Consumer Behavior - Money monthly spent on carryout/delivered foods
Consumer Behavior - Income spent on food at supermarket/grocery store (%)
Consumer Behavior - Income spent on food at other stores (%)
Consumer Behavior - Income spent on eating out (%)
Consumer Behavior - Income spent on carryout/delivered foods (%)
Current Health Status - General health condition (%)
Current Health Status - Blood donors (%)
Current Health Status - Has blood ever tested for HIV virus (%)
Current Health Status - Left-handed people (%)
Dermatology - People using sunscreen (%)
Diabetes - Diabetics (%)
Diabetes - Had a blood test for high blood sugar (%)
Diabetes - People taking insulin (%)
Diet Behavior & Nutrition - Diet health (%)
Diet Behavior & Nutrition - Milk product consumption (# of products/month)
Diet Behavior & Nutrition - Meals not home prepared (#/week)
Diet Behavior & Nutrition - Meals from fast food or pizza place (#/week)
Diet Behavior & Nutrition - Ready-to-eat foods (#/month)
Diet Behavior & Nutrition - Frozen meals/pizza (#/month)
Drug Use - People that ever used marijuana or hashish (%)
Drug Use - Ever used hard drugs (%)
Drug Use - Ever used any form of cocaine (%)
Drug Use - Ever used heroin (%)
Drug Use - Ever used methamphetamine (%)
Health Insurance - People covered by health insurance (%)
Kidney Conditions-Urology - Avg. # of times urinating at night
Medical Conditions - People with asthma (%)
Medical Conditions - People with anemia (%)
Medical Conditions - People with psoriasis (%)
Medical Conditions - People with overweight (%)
Medical Conditions - Elderly people having difficulties in thinking or remembering (%)
Medical Conditions - People who ever received blood transfusion (%)
Medical Conditions - People having trouble seeing even with glass/contacts (%)
Medical Conditions - People with arthritis (%)
Medical Conditions - People with gout (%)
Medical Conditions - People with congestive heart failure (%)
Medical Conditions - People with coronary heart disease (%)
Medical Conditions - People with angina pectoris (%)
Medical Conditions - People who ever had heart attack (%)
Medical Conditions - People who ever had stroke (%)
Medical Conditions - People with emphysema (%)
Medical Conditions - People with thyroid problem (%)
Medical Conditions - People with chronic bronchitis (%)
Medical Conditions - People with any liver condition (%)
Medical Conditions - People who ever had cancer or malignancy (%)
Mental Health - People who have little interest in doing things (%)
Mental Health - People feeling down, depressed, or hopeless (%)
Mental Health - People who have trouble sleeping or sleeping too much (%)
Mental Health - People feeling tired or having little energy (%)
Mental Health - People with poor appetite or overeating (%)
Mental Health - People feeling bad about themself (%)
Mental Health - People who have trouble concentrating on things (%)
Mental Health - People moving or speaking slowly or too fast (%)
Mental Health - People having thoughts they would be better off dead (%)
Oral Health - Average years since last visit a dentist
Oral Health - People embarrassed because of mouth (%)
Oral Health - People with gum disease (%)
Oral Health - General health of teeth and gums (%)
Oral Health - Average days a week using dental floss/device
Oral Health - Average days a week using mouthwash for dental problem
Oral Health - Average number of teeth
Pesticide Use - Households using pesticides to control insects (%)
Pesticide Use - Households using pesticides to kill weeds (%)
Physical Activity - People doing vigorous-intensity work activities (%)
Physical Activity - People doing moderate-intensity work activities (%)
Physical Activity - People walking or bicycling (%)
Physical Activity - People doing vigorous-intensity recreational activities (%)
Physical Activity - People doing moderate-intensity recreational activities (%)
Physical Activity - Average hours a day doing sedentary activities
Physical Activity - Average hours a day watching TV or videos
Physical Activity - Average hours a day using computer
Physical Functioning - People having limitations keeping them from working (%)
Physical Functioning - People limited in amount of work they can do (%)
Physical Functioning - People that need special equipment to walk (%)
Physical Functioning - People experiencing confusion/memory problems (%)
Physical Functioning - People requiring special healthcare equipment (%)
Prescription Medications - Average number of prescription medicines taking
Preventive Aspirin Use - Adults 40+ taking low-dose aspirin (%)
Reproductive Health - Vaginal deliveries (%)
Reproductive Health - Cesarean deliveries (%)
Reproductive Health - Deliveries resulted in a live birth (%)
Reproductive Health - Pregnancies resulted in a delivery (%)
Reproductive Health - Women breastfeeding newborns (%)
Reproductive Health - Women that had a hysterectomy (%)
Reproductive Health - Women that had both ovaries removed (%)
Reproductive Health - Women that have ever taken birth control pills (%)
Reproductive Health - Women taking birth control pills (%)
Reproductive Health - Women that have ever used Depo-Provera or injectables (%)
Reproductive Health - Women that have ever used female hormones (%)
Sexual Behavior - People 18+ that ever had sex (vaginal, anal, or oral) (%)
Sexual Behavior - Males 18+ that ever had vaginal sex with a woman (%)
Sexual Behavior - Males 18+ that ever performed oral sex on a woman (%)
Sexual Behavior - Males 18+ that ever had anal sex with a woman (%)
Sexual Behavior - Males 18+ that ever had any sex with a man (%)
Sexual Behavior - Females 18+ that ever had vaginal sex with a man (%)
Sexual Behavior - Females 18+ that ever performed oral sex on a man (%)
Sexual Behavior - Females 18+ that ever had anal sex with a man (%)
Sexual Behavior - Females 18+ that ever had any kind of sex with a woman (%)
Sexual Behavior - Average age people first had sex
Sexual Behavior - Average number of female sex partners in lifetime (males 18+)
Sexual Behavior - Average number of female vaginal sex partners in lifetime (males 18+)
Sexual Behavior - Average age people first performed oral sex on a woman (18+)
Sexual Behavior - Average number of woman performed oral sex on in lifetime (18+)
Sexual Behavior - Average number of male sex partners in lifetime (males 18+)
Sexual Behavior - Average number of male anal sex partners in lifetime (males 18+)
Sexual Behavior - Average age people first performed oral sex on a man (18+)
Sexual Behavior - Average number of male oral sex partners in lifetime (18+)
Sexual Behavior - People using protection when performing oral sex (%)
Sexual Behavior - Average number of times people have vaginal or anal sex a year
Sexual Behavior - People having sex without condom (%)
Sexual Behavior - Average number of male sex partners in lifetime (females 18+)
Sexual Behavior - Average number of male vaginal sex partners in lifetime (females 18+)
Sexual Behavior - Average number of female sex partners in lifetime (females 18+)
Sexual Behavior - Circumcised males 18+ (%)
Sleep Disorders - Average hours sleeping at night
Sleep Disorders - People that has trouble sleeping (%)
Smoking-Cigarette Use - People smoking cigarettes (%)
Taste & Smell - People 40+ having problems with smell (%)
Taste & Smell - People 40+ having problems with taste (%)
Taste & Smell - People 40+ that ever had wisdom teeth removed (%)
Taste & Smell - People 40+ that ever had tonsils teeth removed (%)
Taste & Smell - People 40+ that ever had a loss of consciousness because of a head injury (%)
Taste & Smell - People 40+ that ever had a broken nose or other serious injury to face or skull (%)
Taste & Smell - People 40+ that ever had two or more sinus infections (%)
Weight - Average height (inches)
Weight - Average weight (pounds)
Weight - Average BMI
Weight - People that are obese (%)
Weight - People that ever were obese (%)
Weight - People trying to lose weight (%)
Urban population: 42,947
Rural population: 62
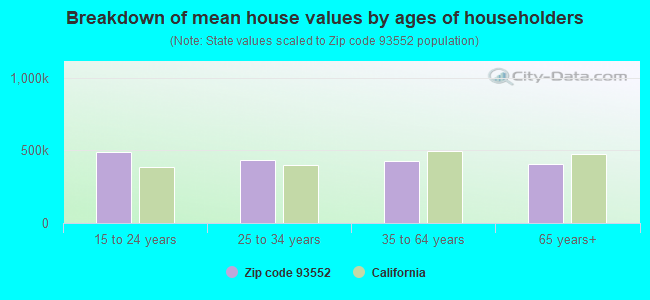
Estimated median house/condo value in 2022: $416,206
93552:
$416,206California:
$715,900
According to our research of California and other state lists, there were 43 registered sex offenders living in 93552 zip code as of June 10, 2024 . The ratio of all residents to sex offenders in zip code 93552 is 970 to 1.The ratio of registered sex offenders to all residents in this zip code is lower than the state average.
Median resident age: This zip code:
33.3 yearsCalifornia median age:
37.9 years
Average household size: This zip code:
3.9 peopleCalifornia:
2.8 people
Averages for the 2020 tax year for zip code 93552, filed in 2021:
Average Adjusted Gross Income (AGI) in 2020: $45,483 (Individual Income Tax Returns) Here:
$45,483State:
$95,910
Salary/wage: $43,865 (reported on 84.2% of returns )Here:
$43,865State:
$77,331
(% of AGI for various income ranges: 1103.7% for AGIs below $25k , 3722.4% for AGIs $25k-50k , 7171.8% for AGIs $50k-75k , 10754.4% for AGIs $75k-100k , 18361.1% for AGIs $100k-200k , 59420.0% for AGIs over 200k ) Taxable interest for individuals: $175 (reported on 26.7% of returns )This zip code:
$175California:
$2,294
(% of AGI for various income ranges: 2.6% for AGIs below $25k , 4.4% for AGIs $25k-50k , 7.6% for AGIs $50k-75k , 11.0% for AGIs $75k-100k , 24.1% for AGIs $100k-200k , 90.0% for AGIs over 200k ) Ordinary dividends: $1,090 (reported on 4.2% of returns )(% of AGI for various income ranges: 1.6% for AGIs below $25k , 2.0% for AGIs $25k-50k , 5.5% for AGIs $50k-75k , 6.5% for AGIs $75k-100k , 47.8% for AGIs $100k-200k , 92.5% for AGIs over 200k ) Net capital gain/loss in AGI: +$5,224 (reported on 5.4% of returns )Here:
+$5,224State:
+$49,306
(% of AGI for various income ranges: 0.9% for AGIs below $25k , 2.4% for AGIs $25k-50k , 9.6% for AGIs $50k-75k , 46.5% for AGIs $75k-100k , 192.5% for AGIs $100k-200k , 6465.0% for AGIs over 200k ) Profit/loss from business: +$8,642 (reported on 19.3% of returns )Here:
+$8,642State:
+$15,671
(% of AGI for various income ranges: 221.7% for AGIs below $25k , 213.9% for AGIs $25k-50k , 208.8% for AGIs $50k-75k , 189.7% for AGIs $75k-100k , 352.4% for AGIs $100k-200k , 700.0% for AGIs over 200k ) Taxable individual retirement arrangement distribution: $14,768 (reported on 2.0% of returns )93552:
$14,768California:
$23,505
(% of AGI for various income ranges: 13.4% for AGIs below $25k , 13.7% for AGIs $25k-50k , 37.8% for AGIs $50k-75k , 79.8% for AGIs $75k-100k , 267.8% for AGIs $100k-200k ) Total itemized deductions: $26,627 (reported on 10.1% of returns )Here:
$26,627State:
$39,517
(% of AGI for various income ranges: 44.1% for AGIs below $25k , 183.9% for AGIs $25k-50k , 529.5% for AGIs $50k-75k , 888.4% for AGIs $75k-100k , 1659.5% for AGIs $100k-200k , 7552.5% for AGIs over 200k ) Charity contributions: $4,646 (reported on 7.8% of returns )(% of AGI for various income ranges: 2.5% for AGIs below $25k , 19.5% for AGIs $25k-50k , 62.2% for AGIs $50k-75k , 108.5% for AGIs $75k-100k , 292.6% for AGIs $100k-200k , 1165.0% for AGIs over 200k ) Taxes paid: $8,344 (reported on 10.1% of returns )(% of AGI for various income ranges: 12.1% for AGIs below $25k , 54.8% for AGIs $25k-50k , 174.6% for AGIs $50k-75k , 314.2% for AGIs $75k-100k , 525.3% for AGIs $100k-200k , 1302.5% for AGIs over 200k ) Earned income credit: $2,453 (reported on 24.4% of returns )(% of AGI for various income ranges: 129.5% for AGIs below $25k , 98.0% for AGIs $25k-50k , 1.8% for AGIs $50k-75k ) Percentage of individuals using paid preparers for their 2020 taxes: 93.4%(% for various income ranges: 92.3% for AGIs below $25k , 94.1% for AGIs $25k-50k , 94.4% for AGIs $50k-75k , 94.0% for AGIs $75k-100k , 94.4% for AGIs $100k-200k , 85.7% for AGIs over 200k )
Averages for the 2012 tax year for zip code 93552, filed in 2013:
Average Adjusted Gross Income (AGI) in 2012: $39,032 (Individual Income Tax Returns) Here:
$39,032State:
$72,726
Salary/wage: $38,828 (reported on 86.1% of returns )Here:
$38,828State:
$59,079
(% of AGI for various income ranges: 71.3% for AGIs below $25k , 87.7% for AGIs $25k-50k , 90.1% for AGIs $50k-75k , 88.3% for AGIs $75k-100k , 87.9% for AGIs $100k-200k , 67.9% for AGIs over 200k ) Taxable interest for individuals: $182 (reported on 26.1% of returns )This zip code:
$182California:
$2,146
(% of AGI for various income ranges: 0.2% for AGIs below $25k , 0.2% for AGIs $50k-75k ) Ordinary dividends: $1,092 (reported on 4.5% of returns )(% of AGI for various income ranges: 0.2% for AGIs below $25k , 0.2% for AGIs $75k-100k , 0.1% for AGIs $100k-200k ) Net capital gain/loss in AGI: +$246 (reported on 3.6% of returns )(% of AGI for various income ranges: 0.3% for AGIs $100k-200k ) Profit/loss from business: +$9,060 (reported on 19.2% of returns )Here:
+$9,060State:
+$17,064
(% of AGI for various income ranges: 19.2% for AGIs below $25k , 3.9% for AGIs $25k-50k , 1.3% for AGIs $50k-75k , 1.2% for AGIs $75k-100k , 0.8% for AGIs $100k-200k ) Taxable individual retirement arrangement distribution: $12,853 (reported on 2.9% of returns )93552:
$12,853California:
$19,557
(% of AGI for various income ranges: 0.7% for AGIs below $25k , 0.7% for AGIs $25k-50k , 0.7% for AGIs $50k-75k , 1.1% for AGIs $75k-100k , 1.8% for AGIs $100k-200k ) Total itemized deductions: $20,541 (32% of AGI, reported on 35.5% of returns )Here:
$20,541State:
$34,004
Here:
31.6% of AGIState:
22.7% of AGI
(% of AGI for various income ranges: 9.0% for AGIs below $25k , 18.0% for AGIs $25k-50k , 22.4% for AGIs $50k-75k , 21.6% for AGIs $75k-100k , 20.3% for AGIs $100k-200k , 17.6% for AGIs over 200k ) Charity contributions: $2,311 (reported on 27.9% of returns )(% of AGI for various income ranges: 0.5% for AGIs below $25k , 1.5% for AGIs $25k-50k , 2.0% for AGIs $50k-75k , 1.9% for AGIs $75k-100k , 2.1% for AGIs $100k-200k , 2.0% for AGIs over 200k ) Taxes paid: $6,002 (reported on 35.4% of returns )93552:
$6,002State:
$14,448
(% of AGI for various income ranges: 2.2% for AGIs below $25k , 4.6% for AGIs $25k-50k , 6.0% for AGIs $50k-75k , 6.6% for AGIs $75k-100k , 7.3% for AGIs $100k-200k , 6.7% for AGIs over 200k ) Earned income credit: $2,717 (reported on 33.2% of returns )(% of AGI for various income ranges: 12.1% for AGIs below $25k , 2.1% for AGIs $25k-50k ) Percentage of individuals using paid preparers for their 2012 taxes: 73.2%(% for various income ranges: 71.1% for AGIs below $25k , 75.4% for AGIs $25k-50k , 75.3% for AGIs $50k-75k , 74.5% for AGIs $75k-100k , 72.0% for AGIs $100k-200k , 75.0% for AGIs over 200k )
Averages for the 2004 tax year for zip code 93552, filed in 2005:
Average Adjusted Gross Income (AGI) in 2004: $38,265 (Individual Income Tax Returns) Here:
$38,265State:
$58,600
Salary/wage: $37,591 (reported on 90.4% of returns )Here:
$37,591State:
$49,455
(% of AGI for various income ranges: 91.8% for AGIs below $10k , 82.2% for AGIs $10k-25k , 90.2% for AGIs $25k-50k , 92.3% for AGIs $50k-75k , 91.2% for AGIs $75k-100k , 81.7% for AGIs over 100k ) Taxable interest for individuals: $369 (reported on 37.6% of returns )This zip code:
$369California:
$2,365
(% of AGI for various income ranges: 1.3% for AGIs below $10k , 0.4% for AGIs $10k-25k , 0.3% for AGIs $25k-50k , 0.3% for AGIs $50k-75k , 0.5% for AGIs $75k-100k , 0.3% for AGIs over 100k ) Taxable dividends: $703 (reported on 7.9% of returns )(% of AGI for various income ranges: 0.6% for AGIs below $10k , 0.1% for AGIs $10k-25k , 0.1% for AGIs $25k-50k , 0.1% for AGIs $50k-75k , 0.2% for AGIs $75k-100k , 0.1% for AGIs over 100k ) Net capital gain/loss: +$8,988 (reported on 6.4% of returns )Here:
+$8,988State:
+$23,418
(% of AGI for various income ranges: -0.3% for AGIs below $10k , -0.2% for AGIs $10k-25k , 0.1% for AGIs $25k-50k , 0.3% for AGIs $50k-75k , 0.9% for AGIs $75k-100k , 8.2% for AGIs over 100k ) Profit/loss from business: +$6,618 (reported on 15.9% of returns )Here:
+$6,618State:
+$16,826
(% of AGI for various income ranges: 8.3% for AGIs below $10k , 9.2% for AGIs $10k-25k , 3.2% for AGIs $25k-50k , 1.0% for AGIs $50k-75k , 0.9% for AGIs $75k-100k , 1.6% for AGIs over 100k ) IRA payment deduction: $2,468 (reported on 1.5% of returns )93552:
$2,468California:
$3,192
(% of AGI for various income ranges: 0.1% for AGIs $10k-25k , 0.1% for AGIs $25k-50k , 0.1% for AGIs $50k-75k , 0.1% for AGIs $75k-100k , 0.1% for AGIs over 100k ) Self-employed pension: $3,667 (reported on 0.1% of returns )Here:
$3,667California:
$17,688
Total itemized deductions: $19,237 (34% of AGI, reported on 49.6% of returns )Here:
$19,237State:
$28,113
Here:
33.7% of AGIState:
25.3% of AGI
(% of AGI for various income ranges: 17.2% for AGIs below $10k , 16.1% for AGIs $10k-25k , 28.0% for AGIs $25k-50k , 28.0% for AGIs $50k-75k , 25.4% for AGIs $75k-100k , 21.2% for AGIs over 100k ) Charity contributions deductions: $2,215 (4% of AGI, reported on 42.8% of returns )Here:
3.7% of AGIState:
3.3% of AGI
(% of AGI for various income ranges: 0.7% for AGIs below $10k , 1.1% for AGIs $10k-25k , 2.4% for AGIs $25k-50k , 2.9% for AGIs $50k-75k , 2.8% for AGIs $75k-100k , 2.7% for AGIs over 100k ) Total tax: $3,732 (reported on 64.7% of returns )93552:
$3,732State:
$10,761
(% of AGI for various income ranges: 3.4% for AGIs below $10k , 3.5% for AGIs $10k-25k , 3.8% for AGIs $25k-50k , 5.6% for AGIs $50k-75k , 7.9% for AGIs $75k-100k , 12.8% for AGIs over 100k ) Earned income credit: $2,029 (reported on 24.7% of returns )Percentage of individuals using paid preparers for their 2004 taxes: 75.6%(% for various income ranges: 66.5% for AGIs below $10k , 76.4% for AGIs $10k-25k , 79.6% for AGIs $25k-50k , 76.9% for AGIs $50k-75k , 75.5% for AGIs $75k-100k , 73.2% for AGIs over 100k )
Estimated median household income in 2022: This zip code:
$85,559California:
$91,551
Nearest zip codes: 93543 ,
93550 ,
93534 ,
93553 ,
93591 ,
93535 .
Sun Village Zip Code Map
Percentage of family households: This zip code:
62.0%California:
46.8%
Percentage of households with unmarried partners: This zip code:
6.9%California:
48.1%
Likely homosexual households (counted as self-reported same-sex unmarried-partner households)
Lesbian couples: 0.0% of all households Gay men: 0.1% of all households
Household received Food Stamps/SNAP in the past 12 months: 2,236Household did not receive Food Stamps/SNAP in the past 12 months: 8,957
Women who had a birth in the past 12 months: 667 (370 now married , 299 unmarried) Women who did not have a birth in the past 12 months: 9,895 (3,728 now married , 6,174 unmarried)
Housing units in zip code 93552 with a mortgage: 6,522 (576
second mortgage , 95
home equity loan , 294
both second mortgage and home equity loan )
Houses without a mortgage: 37
Median monthly owner costs for units with a mortgage: $2,067
Median monthly owner costs for units without a mortgage: $705
Residents with income below the poverty level in 2022:
This zip code:
12.8%Whole state:
12.2%
Residents with income below 50% of the poverty level in 2022:
This zip code:
6.1%Whole state:
6.2%
Median number of rooms in houses and condos: Median number of rooms in apartments:
Year house built (houses)
16 2020 or later294 2010 to 20192,862 2000 to 20093,355 1990 to 19993,433 1980 to 1989429 1970 to 1979441 1960 to 1969166 1950 to 1959205 1940 to 194969 1939 or earlier
Zip code 93552 household income distribution in 2022 329 Less than $10,000178 $10,000 to $14,999254 $15,000 to $19,999285 $20,000 to $24,999288 $25,000 to $29,999279 $30,000 to $34,999517 $35,000 to $39,999452 $40,000 to $44,999325 $45,000 to $49,999755 $50,000 to $59,9991,013 $60,000 to $74,9991,829 $75,000 to $99,9991,594 $100,000 to $124,9991,112 $125,000 to $149,9991,144 $150,000 to $199,999616 $200,000 or moreEstimate of home value of owner-occupied houses/condos in 2022 in zip code 93552 145 Less than $10,00018 $10,000 to $14,99961 $15,000 to $19,99913 $20,000 to $24,99927 $25,000 to $29,9995 $35,000 to $39,999133 $40,000 to $49,99945 $50,000 to $59,999100 $60,000 to $69,99954 $80,000 to $89,99932 $90,000 to $99,99922 $100,000 to $124,99937 $125,000 to $149,99935 $150,000 to $174,99956 $175,000 to $199,999156 $200,000 to $249,999417 $250,000 to $299,9992,507 $300,000 to $399,9992,041 $400,000 to $499,9991,151 $500,000 to $749,99977 $750,000 to $999,99915 $1,000,000 to $1,499,999108 $2,000,000 or moreRent paid by renters in 2022 in zip code 93552 10 $200 to $24993 $400 to $44923 $450 to $49929 $500 to $54943 $550 to $5995 $700 to $74936 $750 to $79949 $900 to $999655 $1,000 to $1,249146 $1,250 to $1,499926 $1,500 to $1,999366 $2,000 to $2,49926 $2,500 to $2,999248 No cash rent
Median gross rent in 2022: $1,811.
Median price asked for vacant for-sale houses and condos in 2022: $398,624.
Estimated median house (or condo) value in 2022 for: White Non-Hispanic householders: $425,497Black or African American householders: $448,727American Indian or Alaska Native householders: $1,619,137Asian householders: $456,471Some other race householders: $404,203Two or more races householders: $455,309Hispanic or Latino householders: $401,493Estimated median house or condo value in 2022: $416,206
93552:
$416,206California:
$715,900
Lower value quartile - upper value quartile: $347,782 - $509,553
Mean price in 2022: Detached houses: $386,770Here:
$386,770State:
$988,808
Townhouses or other attached units: $300,672Here:
$300,672State:
$838,546
Mobile homes: $49,918Here:
$49,918State:
$184,506
Housing units in structures:
One, detached: 10,223One, attached: 149Two: 433 or 4: 8110 to 19: 7220 to 49: 1450 or more: 43Mobile homes: 778Unemployment : 5.7%
Means of transportation to work in zip code 93552 71.0% 12,798 Drove a car alone15.6% 2,811 Carpooled0.8% 137 Bus or trolley bus0.1% 13 Railroad0.3% 47 Taxi0.7% 134 Walked2.6% 463 Other means7.7% 1,395 Worked at homeTravel time to work (commute) in zip code 93552 172 Less than 5 minutes684 5 to 9 minutes1,178 10 to 14 minutes2,478 15 to 19 minutes2,053 20 to 24 minutes414 25 to 29 minutes1,053 30 to 34 minutes138 35 to 39 minutes356 40 to 44 minutes1,580 45 to 59 minutes3,479 60 to 89 minutes2,637 90 or more minutes
Percentage of zip code residents living and working in this county: 97.6%
Household type by relationship:
Households: 43,010
Male householders: 6,213 (584 living alone ), Female householders: 4,793 (583 living alone )6,473 spouses (6,351 opposite-sex spouses ), 537 unmarried partners , (531 opposite-sex unmarried partners ), 16,782 children (15,950 natural , 198 adopted , 630 stepchildren ), 2,000 grandchildren , 673 brothers or sisters , 2,164 parents , 168 foster children , 1,755 other relatives , 1,077 non-relatives In group quarters: 68 (-1 institutionalized population )
Size of family households: 1,725 2-persons , 2,271 3-persons , 1,870 4-persons , 1,445 5-persons , 1,074 6-persons , 984 7-or-more-persons
Size of nonfamily households: 1,165 1-person , 197 2-persons , 131 3-persons , 18 5-persons , 14 6-persons
6,983 married couples with children. single-parent households (1,191 men , 1,727 women ).
41.7% of residents of 93552 zip code speak English at home. of residents speak Spanish at home (60% very well, 20% well, 15% not well, 5% not at all ).of residents speak other Indo-European language at home (75% very well, 22% well, 3% not well ).of residents speak Asian or Pacific Island language at home (73% very well, 22% well, 5% not well ).of residents speak other language at home (84% very well, 4% well, 12% not at all ).
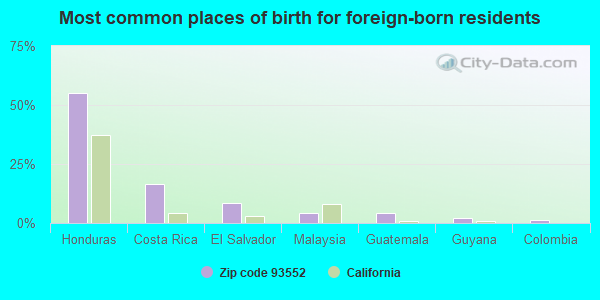
Foreign born population: 11,521 (26.8%)
(53.3%
of them are naturalized citizens )
This zip code:
26.8%Whole state:
26.7%
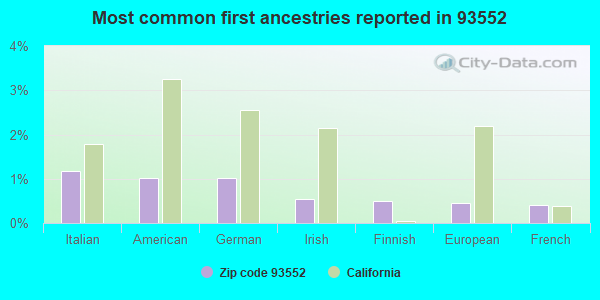
55% Honduras 17% Costa Rica 8% El Salvador 4% Malaysia 4% Guatemala 2% Guyana 1% Colombia 1% Italian 1% American 1% German 1% Irish 1% Finnish 0% European 0% French
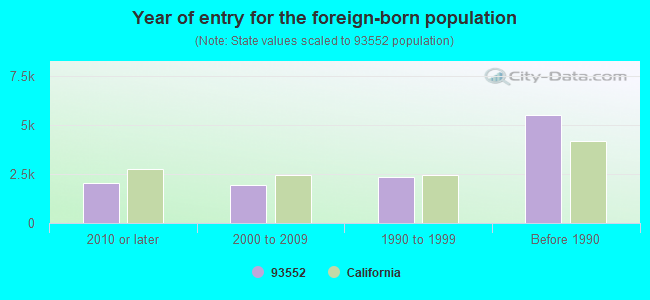
Year of entry for the foreign-born population
2,044 2010 or later 1,955 2000 to 2009 2,321 1990 to 1999 5,502 Before 1990
There are
30 Medical Specialists in Zip Code 93552 .
Facilities with environmental interests located in this zip code:
CHEVRON STATION NO 205671 (37217 47TH ST E in PALMDALE, CA)
STATE MASTER (California - Hazardous Waste Tracking) - HAZARDOU WASTE PROGRAM Small Quantity Generators, between 100 kg and 1000 kg of hazardous waste/month (Resource Conservation and Recovery Act (tracking hazardous waste)) - notification Organizations: CHEVRON PRODUCTS CO (CONTACT/OWNER)
CHAPARRAL ELEMENTARY (37500 - 50TH ST. EAST in PALMDALE, CA)
(National Center for Education Statistics) - STATE ID-6106900 Organizations: PALMDALE ELEMENTARY (SCHOOL DISTRICT)
Housing units lacking complete plumbing facilities: 0.0%
Housing units lacking complete kitchen facilities: 1.1%
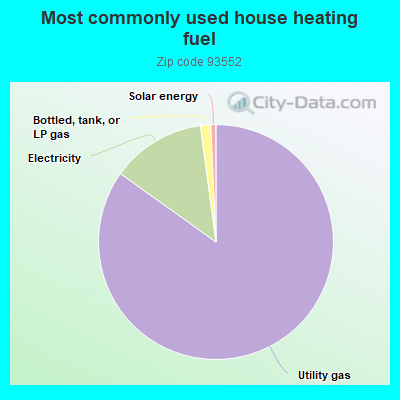
84.3% Utility gas 12.9% Electricity 1.4% Bottled, tank, or LP gas 0.7% Solar energy
Place of birth for U.S.-born residents:
This state: 28,567Northeast: 373Midwest: 582South: 1,093West: 550
50% of the 93552 zip code residents lived in the same house 5 years ago.
Out of people who lived in different houses, 84% lived in this county.
Out of people who lived in different counties, 50% lived in California.
94% of the 93552 zip code residents lived in the same house 1 year ago.
Out of people who lived in different houses, 72% moved from this county.
Out of people who lived in different houses, 2% moved from different county within same state.
Out of people who lived in different houses, 11% moved from different state.
Out of people who lived in different houses, 20% moved from abroad.
Private vs. public school enrollment:
Students in private schools in grades 1 to 8 (elementary and middle school): 233
Here:
4.0%California:
10.5%
Students in private schools in grades 9 to 12 (high school): 76
Students in private undergraduate colleges: 308
Here:
11.5%California:
15.9%
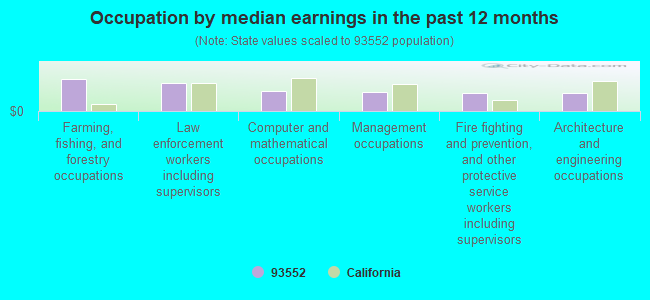
Occupation by median earnings in the past 12 months ($)
125,803 Farming, fishing, and forestry occupations 110,924 Law enforcement workers including supervisors 77,519 Computer and mathematical occupations 75,773 Management occupations 72,577 Fire fighting and prevention, and other protective service workers including supervisors 72,278 Architecture and engineering occupations
Companies with federal contracts located in this zip code:
GERARDO G MARTINEZ (4231 EAST AVENUE S-4 in PALMDALE, CA; small business) in 15 contracts from 2001 to 2006
Contracts for Other Medical Services by Air ForceSigned by year: 2000: $0; 2001: $85,075; 2002: $114,277; 2003: $347,679; 2004: $286,289; 2005: $59,519; 2006: $150,277.
Biggest contracts: with Air Force for Other Medical Services. Signed on 2004-12-01. Completion date: 2006-11-30.
, same as above. Signed on 2006-02-08. Completion date: 2006-11-30.
, same as above. Signed on 2003-01-10. Completion date: 2003-09-30.
, same as above. Signed on 2003-10-27. Completion date: 2004-09-30.
Top industries in this zip code by the number of employees in 2005:
Accommodation and Food Services: Limited-Service Restaurants (20-49 employees: 6 establishments, 5-9 employees: 1 establishment)Health Care and Social Assistance: Offices of Physicians (except Mental Health Specialists) (50-99: 1)Administrative and Support and Waste Management and Remediation Services: Landscaping Services (20-49: 1, 5-9: 1, 1-4: 3)Professional, Scientific, and Technical Services: Public Relations Agencies (20-49: 1)Construction: Plumbing, Heating, and Air-Conditioning Contractors (10-19: 1, 5-9: 1, 1-4: 2)Administrative and Support and Waste Management and Remediation Services: Janitorial Services (5-9: 3, 1-4: 2)Wholesale Trade: Wholesale Trade Agents and Brokers (10-19: 1, 1-4: 1)
People in group quarters in 2010:
26 people in group homes intended for adults
15 people in workers' group living quarters and job corps centers
10 people in residential treatment centers for juveniles (non-correctional)
People in group quarters in 2000:
46 people in other noninstitutional group quarters
6 people in other group homes
Fatal accident statistics in 2014:
Fatal accident count: 5Vehicles involved in fatal accidents: 8Fatal accidents caused by drunken drivers: 2Fatalities: 5Persons involved in fatal accidents: 8Pedestrians involved in fatal accidents: 3
Fatal accident statistics in 2013:
Fatal accident count: 1Vehicles involved in fatal accidents: 1Fatal accidents caused by drunken drivers: 0Fatalities: 1Persons involved in fatal accidents: 1Pedestrians involved in fatal accidents: 1
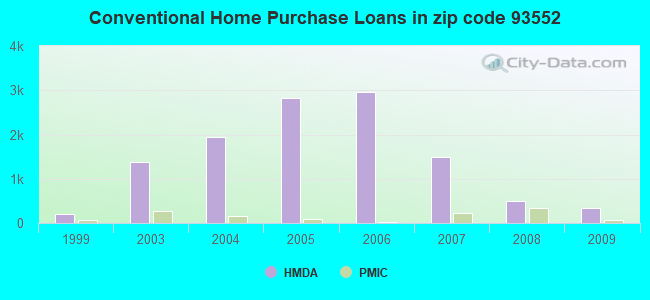
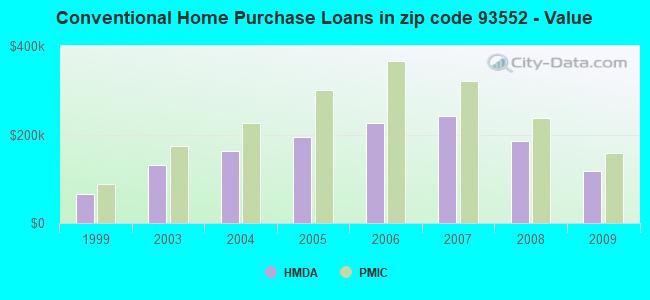
Home Mortgage Disclosure Act Aggregated Statistics For Year 2009(Based on 3 full and 6 partial tracts) A) FHA, FSA/RHS & VA B) Conventional C) Refinancings D) Home Improvement Loans F) Non-occupant Loans on G) Loans On Manufactured Number Average Value Number Average Value Number Average Value Number Average Value Number Average Value Number Average Value
LOANS ORIGINATED 935 $163,689 335 $118,418 311 $172,080 10 $36,839 150 $92,618 5 $83,780 APPLICATIONS APPROVED, NOT ACCEPTED 65 $150,369 60 $142,004 60 $154,968 3 $18,247 30 $127,265 4 $41,382 APPLICATIONS DENIED 208 $168,097 125 $128,477 243 $189,821 39 $66,597 57 $118,083 6 $87,417 APPLICATIONS WITHDRAWN 136 $170,762 80 $114,405 117 $194,512 11 $75,958 34 $102,504 1 $165,640 FILES CLOSED FOR INCOMPLETENESS 44 $167,325 15 $138,541 25 $184,443 3 $131,667 12 $124,604 0 $0
Aggregated Statistics For Year 2008(Based on 3 full and 6 partial tracts) A) FHA, FSA/RHS & VA B) Conventional C) Refinancings D) Home Improvement Loans F) Non-occupant Loans on G) Loans On Manufactured Number Average Value Number Average Value Number Average Value Number Average Value Number Average Value Number Average Value
LOANS ORIGINATED 555 $214,233 493 $185,589 289 $193,495 28 $77,761 113 $147,090 1 $45,450 APPLICATIONS APPROVED, NOT ACCEPTED 55 $233,903 164 $238,692 106 $229,227 14 $86,800 36 $153,089 6 $90,443 APPLICATIONS DENIED 192 $247,894 370 $219,235 580 $252,237 79 $90,045 91 $187,795 12 $89,960 APPLICATIONS WITHDRAWN 122 $245,698 141 $217,247 159 $226,453 9 $97,632 30 $158,628 3 $33,567 FILES CLOSED FOR INCOMPLETENESS 22 $206,453 57 $238,479 46 $240,095 3 $143,527 29 $211,414 2 $217,025
Aggregated Statistics For Year 2007(Based on 3 full and 6 partial tracts) A) FHA, FSA/RHS & VA B) Conventional C) Refinancings D) Home Improvement Loans F) Non-occupant Loans on G) Loans On Manufactured Number Average Value Number Average Value Number Average Value Number Average Value Number Average Value Number Average Value
LOANS ORIGINATED 60 $320,293 1,498 $242,423 1,545 $241,602 221 $157,201 146 $215,427 10 $187,731 APPLICATIONS APPROVED, NOT ACCEPTED 4 $249,000 366 $235,596 469 $266,781 77 $123,998 36 $226,600 14 $76,393 APPLICATIONS DENIED 22 $310,285 1,012 $261,723 1,822 $280,685 289 $136,250 111 $240,217 26 $79,135 APPLICATIONS WITHDRAWN 16 $313,552 530 $259,443 653 $277,118 97 $153,684 50 $223,877 1 $177,960 FILES CLOSED FOR INCOMPLETENESS 2 $319,460 102 $305,127 272 $299,563 22 $195,877 16 $248,526 0 $0
Aggregated Statistics For Year 2006(Based on 3 full and 6 partial tracts) A) FHA, FSA/RHS & VA B) Conventional C) Refinancings D) Home Improvement Loans F) Non-occupant Loans on G) Loans On Manufactured Number Average Value Number Average Value Number Average Value Number Average Value Number Average Value Number Average Value
LOANS ORIGINATED 5 $228,134 2,966 $225,325 2,809 $246,264 352 $154,461 260 $216,370 9 $131,681 APPLICATIONS APPROVED, NOT ACCEPTED 0 $0 646 $223,135 713 $242,773 112 $137,127 95 $218,766 22 $72,379 APPLICATIONS DENIED 8 $325,798 989 $229,072 1,856 $263,995 367 $139,415 134 $229,373 13 $75,825 APPLICATIONS WITHDRAWN 6 $261,848 695 $235,859 1,398 $260,586 126 $178,304 78 $224,880 0 $0 FILES CLOSED FOR INCOMPLETENESS 0 $0 134 $247,826 318 $269,946 17 $181,214 18 $305,882 2 $138,895
Aggregated Statistics For Year 2005(Based on 3 full and 6 partial tracts) A) FHA, FSA/RHS & VA B) Conventional C) Refinancings D) Home Improvement Loans F) Non-occupant Loans on G) Loans On Manufactured Number Average Value Number Average Value Number Average Value Number Average Value Number Average Value Number Average Value
LOANS ORIGINATED 11 $242,943 2,819 $194,579 3,320 $220,698 404 $149,104 345 $196,187 14 $118,769 APPLICATIONS APPROVED, NOT ACCEPTED 0 $0 500 $191,371 627 $221,105 88 $101,950 76 $194,767 22 $70,677 APPLICATIONS DENIED 6 $335,082 783 $193,106 1,594 $230,252 393 $94,648 126 $200,925 26 $59,480 APPLICATIONS WITHDRAWN 4 $255,985 586 $194,191 1,496 $224,438 187 $156,777 118 $182,059 2 $88,210 FILES CLOSED FOR INCOMPLETENESS 1 $257,000 110 $212,971 346 $216,713 23 $98,861 10 $213,425 1 $186,000
Aggregated Statistics For Year 2004(Based on 3 full and 6 partial tracts) A) FHA, FSA/RHS & VA B) Conventional C) Refinancings D) Home Improvement Loans F) Non-occupant Loans on G) Loans On Manufactured Number Average Value Number Average Value Number Average Value Number Average Value Number Average Value Number Average Value
LOANS ORIGINATED 45 $216,128 1,943 $162,216 3,485 $177,426 412 $111,778 288 $170,732 14 $85,247 APPLICATIONS APPROVED, NOT ACCEPTED 3 $158,847 334 $183,697 734 $178,950 109 $110,427 43 $190,964 2 $60,765 APPLICATIONS DENIED 11 $231,402 469 $158,539 1,505 $176,157 369 $71,811 101 $173,700 14 $86,597 APPLICATIONS WITHDRAWN 8 $230,316 289 $176,936 1,243 $174,428 150 $92,938 61 $154,859 2 $205,440 FILES CLOSED FOR INCOMPLETENESS 3 $103,550 70 $201,977 358 $182,023 28 $61,701 9 $174,971 0 $0
Aggregated Statistics For Year 2003(Based on 3 full and 6 partial tracts) A) FHA, FSA/RHS & VA B) Conventional C) Refinancings D) Home Improvement Loans F) Non-occupant Loans on Number Average Value Number Average Value Number Average Value Number Average Value Number Average Value
LOANS ORIGINATED 276 $175,328 1,372 $131,163 3,789 $130,858 118 $40,372 274 $121,041 APPLICATIONS APPROVED, NOT ACCEPTED 20 $154,722 231 $133,946 703 $132,294 73 $46,384 52 $118,898 APPLICATIONS DENIED 17 $170,006 379 $124,983 1,788 $131,088 217 $36,857 99 $112,065 APPLICATIONS WITHDRAWN 40 $159,960 160 $136,870 1,192 $131,743 51 $41,159 31 $135,402 FILES CLOSED FOR INCOMPLETENESS 11 $179,665 18 $171,000 221 $122,336 10 $54,080 17 $103,305
Aggregated Statistics For Year 1999(Based on 2 partial tracts) A) FHA, FSA/RHS & VA B) Conventional C) Refinancings D) Home Improvement Loans E) Loans on Dwellings For 5+ Families F) Non-occupant Loans on Number Average Value Number Average Value Number Average Value Number Average Value Number Average Value Number Average Value
LOANS ORIGINATED 297 $95,781 197 $65,872 214 $95,354 83 $31,133 5 $102,208 45 $59,846 APPLICATIONS APPROVED, NOT ACCEPTED 11 $94,618 28 $76,862 73 $94,474 55 $26,888 1 $64,380 11 $55,915 APPLICATIONS DENIED 27 $100,168 49 $71,529 218 $64,875 132 $22,765 3 $96,757 11 $67,379 APPLICATIONS WITHDRAWN 29 $104,831 40 $74,811 129 $87,682 8 $28,719 1 $132,510 7 $67,989 FILES CLOSED FOR INCOMPLETENESS 6 $126,702 6 $89,843 54 $93,005 2 $17,620 1 $49,480 4 $95,285
Private Mortgage Insurance Companies Aggregated Statistics For Year 2009(Based on 3 full and 6 partial tracts) A) Conventional B) Refinancings C) Non-occupant Loans on Number Average Value Number Average Value Number Average Value
LOANS ORIGINATED 59 $158,386 2 $87,680 2 $71,185 APPLICATIONS APPROVED, NOT ACCEPTED 52 $200,584 4 $270,788 1 $165,640 APPLICATIONS DENIED 9 $160,650 3 $262,303 0 $0 APPLICATIONS WITHDRAWN 2 $101,570 0 $0 0 $0 FILES CLOSED FOR INCOMPLETENESS 9 $188,667 2 $122,400 0 $0
Aggregated Statistics For Year 2008(Based on 3 full and 6 partial tracts) A) Conventional B) Refinancings C) Non-occupant Loans on Number Average Value Number Average Value Number Average Value
LOANS ORIGINATED 347 $237,824 36 $288,064 8 $214,818 APPLICATIONS APPROVED, NOT ACCEPTED 263 $299,751 68 $330,155 2 $323,000 APPLICATIONS DENIED 59 $223,153 7 $242,594 8 $223,818 APPLICATIONS WITHDRAWN 29 $241,902 6 $301,598 5 $220,688 FILES CLOSED FOR INCOMPLETENESS 13 $270,180 2 $390,645 0 $0
Aggregated Statistics For Year 2007(Based on 3 full and 6 partial tracts) A) Conventional B) Refinancings C) Non-occupant Loans on Number Average Value Number Average Value Number Average Value
LOANS ORIGINATED 222 $321,298 135 $334,123 9 $319,581 APPLICATIONS APPROVED, NOT ACCEPTED 34 $330,416 32 $338,570 6 $305,898 APPLICATIONS DENIED 15 $387,255 14 $423,299 3 $345,407 APPLICATIONS WITHDRAWN 9 $331,400 14 $362,656 2 $265,640 FILES CLOSED FOR INCOMPLETENESS 0 $0 5 $342,096 2 $302,965
Aggregated Statistics For Year 2006(Based on 3 full and 4 partial tracts) A) Conventional B) Refinancings C) Non-occupant Loans on Number Average Value Number Average Value Number Average Value
LOANS ORIGINATED 33 $366,902 60 $339,887 1 $347,000 APPLICATIONS APPROVED, NOT ACCEPTED 10 $396,479 16 $337,031 0 $0 APPLICATIONS DENIED 3 $398,773 4 $281,820 2 $265,640 APPLICATIONS WITHDRAWN 2 $289,945 4 $365,500 1 $347,000 FILES CLOSED FOR INCOMPLETENESS 0 $0 0 $0 0 $0
Aggregated Statistics For Year 2005(Based on 3 full and 6 partial tracts) A) Conventional B) Refinancings C) Non-occupant Loans on D) Loans On Manufactured Number Average Value Number Average Value Number Average Value Number Average Value
LOANS ORIGINATED 84 $300,642 72 $300,081 6 $246,873 1 $263,520 APPLICATIONS APPROVED, NOT ACCEPTED 10 $277,927 19 $264,727 1 $80,000 0 $0 APPLICATIONS DENIED 2 $315,000 2 $271,715 0 $0 0 $0 APPLICATIONS WITHDRAWN 5 $250,958 6 $291,875 1 $245,000 0 $0 FILES CLOSED FOR INCOMPLETENESS 2 $342,000 0 $0 0 $0 0 $0
Aggregated Statistics For Year 2004(Based on 3 full and 6 partial tracts) A) Conventional B) Refinancings C) Non-occupant Loans on D) Loans On Manufactured Number Average Value Number Average Value Number Average Value Number Average Value
LOANS ORIGINATED 149 $226,718 67 $195,487 11 $186,070 1 $175,320 APPLICATIONS APPROVED, NOT ACCEPTED 34 $217,149 33 $165,950 2 $204,005 0 $0 APPLICATIONS DENIED 4 $216,500 7 $219,583 0 $0 0 $0 APPLICATIONS WITHDRAWN 8 $203,642 8 $175,680 2 $178,000 0 $0 FILES CLOSED FOR INCOMPLETENESS 1 $180,000 2 $132,125 0 $0 0 $0
Aggregated Statistics For Year 2003(Based on 3 full and 6 partial tracts) A) Conventional B) Refinancings C) Non-occupant Loans on Number Average Value Number Average Value Number Average Value
LOANS ORIGINATED 269 $172,941 236 $145,366 34 $144,668 APPLICATIONS APPROVED, NOT ACCEPTED 50 $163,793 80 $147,022 16 $160,041 APPLICATIONS DENIED 5 $169,550 6 $144,533 5 $180,094 APPLICATIONS WITHDRAWN 7 $184,199 9 $150,243 0 $0 FILES CLOSED FOR INCOMPLETENESS 0 $0 0 $0 0 $0
Aggregated Statistics For Year 1999(Based on 2 partial tracts) A) Conventional B) Refinancings C) Non-occupant Loans on Number Average Value Number Average Value Number Average Value
LOANS ORIGINATED 67 $88,751 33 $114,524 6 $71,807 APPLICATIONS APPROVED, NOT ACCEPTED 8 $71,646 4 $119,712 1 $60,800 APPLICATIONS DENIED 8 $85,182 3 $91,437 1 $125,780 APPLICATIONS WITHDRAWN 2 $80,325 2 $77,190 0 $0 FILES CLOSED FOR INCOMPLETENESS 0 $0 0 $0 0 $0
Most common first names in zip code 93552 among deceased individuals Name Count Lived (average)
James 28 68.2 years William 22 74.0 years Mary 20 73.9 years Charles 20 75.1 years Robert 18 71.4 years John 18 72.2 years Maria 15 78.3 years George 15 71.0 years Richard 13 67.4 years Betty 11 71.5 years
Most common last names in zip code 93552 among deceased individuals Last name Count Lived (average)
Smith 14 76.5 years Brown 12 71.4 years Wilson 9 72.9 years Johnson 9 74.6 years Martin 7 76.0 years Martinez 7 64.0 years Jones 6 67.8 years Garcia 6 79.3 years Scott 6 75.5 years Ramirez 6 75.5 years
Businesses in zip code 93552
Name Count Name Count
AT&T 2 Panera Bread 1 AutoZone 1 Payless 1 Bath & Body Works 1 PetSmart 1 Burger King 1 Pizza Hut 1 Dennys 1 RadioShack 1 El Pollo Loco 1 Rite Aid 1 Famous Footwear 1 Staples 1 FedEx 1 Starbucks 2 GameStop 2 Subway 1 H&R Block 2 T-Mobile 3 Home Depot 1 Taco Bell 1 Jack In The Box 1 Target 1 Lowe's 1 U-Haul 1 MasterBrand Cabinets 2 UPS 2 McDonald's 1 Walgreens 1 Panda Express 2 Walmart 1


 Nearest zip codes: 93543, 93550, 93534, 93553, 93591, 93535.