Please register to participate in our discussions with 2 million other members - it's free and quick! Some forums can only be seen by registered members. After you create your account, you'll be able to customize options and access all our 15,000 new posts/day with fewer ads.
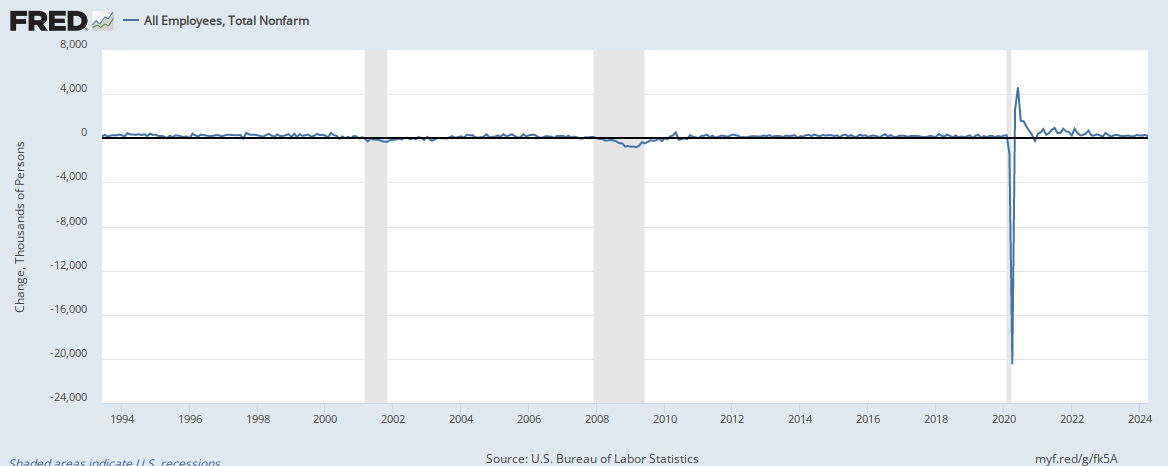
Nonfarm payroll employment decreased by 33k in September. That is the first decrease since September of 2010. Furthermore the probability that a recession is on the horizon has increased(see second chart).
A recession is always on the horizon, the only question is where is that horizon? It's an easy trade to ply making prediction with a nonspecific time frame. By the way here is you from 2016:
Quote:
Originally Posted by Irco
Below are a few charts on the Unemployment rate and Initial Claims. The Unemployment ticked up to 5% in September from 4.9% in August. It appears the Unemployment rate is going to start surging higher.
The unemployment rate is 4.2%, so it seems your powers of prognostication via charts is a bit lacking.
You can't read much into one month of data. The headline numbers are heavily massaged since the raw data exhibits a large amount of fluctuation. The raw figures for gains in jobs were 340K for business survey and over 900K for households.
With the actual volatility in the data, there shouldn't be as much drama about a mere 10K or 30K variance.
Please register to post and access all features of our very popular forum. It is free and quick. Over $68,000 in prizes has already been given out to active posters on our forum. Additional giveaways are planned.
Detailed information about all U.S. cities, counties, and zip codes on our site: City-data.com.

 Please register to participate in our discussions with 2 million other members - it's free and quick! Some forums can only be seen by registered members. After you create your account, you'll be able to customize options and access all our 15,000 new posts/day with fewer ads.