02-07-2016, 09:35 AM
Location: Grand Rapids Metro
8,882 posts, read
19,856,367 times
Reputation: 3920
Quote:
Originally Posted by
sammy87
Thats good to know. I really like MTN biking. Its probably my fav outdoor activity. Skiing is great, but in CO weekend traffic is a nightmare. I only get up maybe 5-8 times a yr. Issue with MTN biking is the foothill trails that are close are packed and biking in the high country is difficult. I shouldn't be complaining, CO is great. But I see us needing a bigger house soon and theres nothing to upgrade to. Even the $800k homes have tiny lots and packed together.
Most of the townships around here are 27 - 30 mills, which you use to multiply times your assessed value (half your market value, approximately). So a $500,000 house would be close to $250,000 taxable value x .027 = $6750/year. That's in school districts like Forest Hills, Rockford, Lowell, Caledonia.
There are a couple of builders in that price range that really shouldn't be building in that price range but most of the rest are pretty good.
You should definitely check out fat biking then, if you make the move. You can use them on mountain biking trails in the summer and I know people who have ridden up to 50 miles along Lake Michigan right on the beach (below the high water mark on the Great Lakes is publicly owned). They have a lot of great trails up by Traverse City, including a huge new trail network by Bellaire called Glacial Hills.
https://www.google.com/search?q=fat+...UIDCgA&dpr=1.5
Let me know if you need any other help.
02-10-2016, 06:09 PM
1,996 posts, read
3,161,988 times
Reputation: 2302
Quote:
Originally Posted by
magellan
No threadjack at all. But actually:
Property taxes are considerably higher on average in Southeast Michigan. You have to go to South Lyon and parts of Northville to come close to the low millage rates in much of West Michigan. We pay 27 mills and live in one of the best school districts in the State (Forest Hills). That's hard to find in SE Michigan.
8 facts about property assessments and tax rates in Michigan | MLive.com
The good school districts in the Detroit area require quite a bit more household income to afford than housing here. You can get into quite a few Grand Rapids area districts that rate very highly, for quite a bit less housing cost (ie for instance you can buy a new home in Byron Center School district for mid $200's.)
The number of trails and greenways in West and Southwest Michigan way outnumbers SE Michigan. SE Michigan is not even a close second. Plus, most of WM is just a few minutes from these recreational areas. I'm not even including the lakeshore and all of the dunes and state parks.
West Michigan Trails and Greenways Coalition > Trail Maps
Crime is mostly a perception issue. Hard to argue one way or the other. But Grand Rapids, the largest city in West Michigan, only had 6 murders last year, with a population of 200,000 people.
Recreation is more than just paved bike trails - it’s camping, it’s swimming on a beach on the lake, it's canoeing in a scenic river, it’s hiking in woods, it’s fishing, it’s disc golf
Below: list of large parks plus other notable parks within AN HOUR of downtown Detroit. We are not lacking for recreation . It may take longer to get to these places than in West Michigan if you live in certain parts of the metro area. Also, Lake Michigan is unmatched around here.
WAYNE COUNTY
Lower Huron Metropark – 1,258 acres - mature woodlands, grassy meadows and Huron River
Detroit River International Wildlife Refuge, Humbug Unit – 410 acres – last mile of natural shoreline of Detroit River, 2 short trails
Lake Erie Metropark – 1,607 acres - 3 miles of Lake Erie Shoreline
Oakwoods Metropark – 1,756 acres - scenic woods and picturesque Huron River
Willow Metropark – 1,531 acres - mature woodlands, Washago Pond and the Huron River
Maybury State Park – 944 acres – trails, horseback riding, working educational farm
Belle Isle State Park (city of Detroit) – 987 acres – largest urban island park in the U.S.
Palmer Park and Golf Course (city of Detroit) – 296 acres – woodlands, lawns, small lake, historic log cabin
River Rouge Park (city of Detroit) - 1,184 acres – Largest park in the city of Detroit, trails, forests
Eliza Howell Park (city of Detroit) – 250 acres – unarguably the saddest park in America
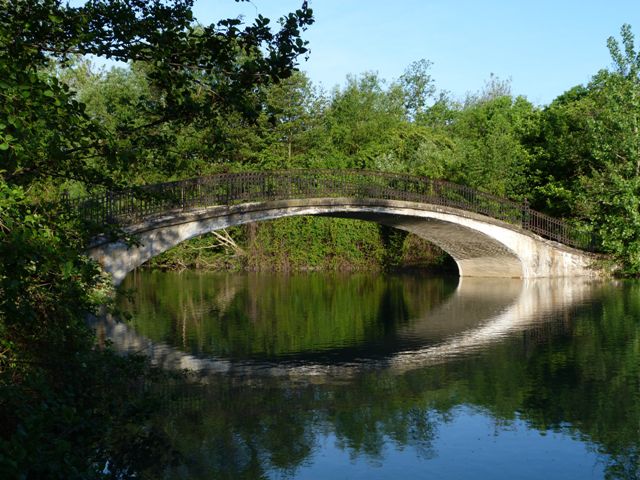
Elizabeth Park – 162 acres – Quarter-mile long Detroit River coastline, 1st county park in Michigan
Bridge at Elizabeth Park, Trenton, MI
Pointe Mouillee State Game Area – 4,040 acres – trails galore with open water all around you
Holiday Forestry & Wildlife Preserve – linear park, 550 acres along the valley of Tonquish Creek
Crosswinds Marsh – 1,050 acres of reclaimed wetlands near the Metro Airport
Notable Trails
Hines Drive/Parkway – 17.2 miles long spanning 6 cities. Along the parkway are over 20 different parks/playgrounds/ golf courses
Trail connecting Lower Huron, Willow, and Oakwoods Metropark – 15 miles long
Dequindre Cut – urban recreational path known for its artwork and graffiti– 1.2 miles + a 1 mile extension is almost complete
Detroit Riverwalk – 3.5 miles are complete, 5.5 miles are planned
OAKLAND COUNTY
Highland State Recreation Area – 5,900 acres of lakes, fishing, beach, miles of trails, kayak, campgrounds
Pontiac Lake State Recreation Area – 3,800 acres of rolling woodlands, beach, boating, picnic areas
Bald Mountain State Recreation Area – 4,637 acres spread over 2 nearby units. Some of the most rugged and steepest hills of Southeast Michigan
Ortonville State Recreation Area – 5,400 acres, wooded hills, lakes, trails, camping
Holly Recreation Area – 7,817 acres, rolling woodlands, open fields, 17 lakes, 30 miles of trails
Proud Lake State Recreation Area - 4,700 acres, 2 lakes, pine tree forests, 20 miles of trails
Seven Lakes State Park – 1,434 acres, 7 lakes, 7 miles of trails along the lakes and forest
Indian Springs Metropark – 2,215 acres – woodland hills, golf course, underwater aquatic center, 12 miles of trails, sledding hills
Kensington Metropark – 4,486 acres – wooded hills, 2 beaches, a golf course & nature center with exhibits & guided hikes
Highland Oaks County Park – 302 acres of rolling hills, wetlands, 2.5 miles trails, equestrian
Addison Oaks County Park – 1,174 acres - 174 campsites, 7.5 miles of trails, disc golf course, waterslide
Groveland Oaks County Park – 362 acres – beach, waterslide, camping, 18-hole mini-golf course
Orion Oaks County Park – 916 acres - lakes, fishing, 10 miles trails, dog park
Waterford Oaks County Park – 185 acres – waterpark, motocross, 3 miles of trails
Independence Oaks County Park – 1,276 acres - 12 miles of trails, Crooked Lake, swimming, boating
Lyon Oaks County Park – 1,041 acres – wetlands, dog park, 6 miles of trails, golf course
Rose Oaks County Park – 640 acres - wooded uplands, gently rolling open meadows, wetlands, small lakes, 4 miles of trails
Red Oaks County Park – 163 acres – dog park, golf course, nature center, waterpark
Wixom Habitat (city of Wixom) – 292 acre nature preserve , ½ mile walking path, interactive nature center
Bloomer Park (city of Rochester Hills) – 200 acres – sledding hills, hiking trails, fishing in Clinton River
Downhill Skiing
Mt Holly Ski and Snowboard Resort – 100 skiable acres
Alpine Valley Ski Area – largest ski area in southern Michigan; 25 runs
Pine Knob Ski Resort - 300 feet of vertical skiing on 17 runs
Notable Trails
Clinton River Trail – 16 miles through Sylvan Lake, Pontiac, Auburn Hills, Rochester Hills and Rochester
Paint Creek Trail – Michigan’s oldest rails-to-trail, 9 miles long; wildlife, historical sites, picnic tables and a lovely creek filled with jumping trout
Polly Ann Trail – 34 mile long connects Orion, Oxford, and Addison and goes into Lapeer County
MACOMB COUNTY
Lake St. Clair Metropark – 770 acres – trails, swimming beach, boardwark along Lake St. Clair
Wilcott Mills Metropark – 2,625 acres - historic grist mill, working farms, trails along Clinton River
Stoney Creek Metropak – 4,461 acres – swimming, boating, hiking
Wetzel State Recreation Area – 900 acres – undeveloped park, hiking, hunting, snowmobiling and cross-country skiing
River Bends Park &
Hollands Ponds (Shelby Township) – 1038 total acres – 6 miles of the Clinton River, hiking trails, archery range, woods; wildlife preserve; contains portion of never completed CLINTON-KALAMAZOO CANAL
Clinton River Park System of City of Sterling Heights - 314 acres – trails, playgrounds, canoes/kayak, athletic fields along Clinton River
Notable Trails
Macomb Orchard Trail – 23.5 miles longs across northern portion of Macomb County
Metro Parkway Trail –11 miles long, definitely NOT a scenic route
Clinton River Park Trail – 4.5 miles along the Clinton River connects 3 scenic parks in Sterling Heights and Utica
ST. CLAIR COUNTY
Algonac State Park – 1,450 acres –2 campgrounds and ½ mile long St. Clair River frontage
Notable Trails
Bridge to Bay Trail - extends from village of Lake Port on Lake Huron south to Algonac on the St. Clair River – 37.5 miles long currently, 54 miles planned
LIVINGSTON COUNTY
Island Lake State Recreation Area – 4,000 acres – shooting range, canoeing, beaches, camping
Sand Dune at Island Lake State Recreation Area
Brighton Recreation Area – 4,947 acres – camping, lakes, 39 miles of trails for mountain biking, hiking, skiing and horse riding
Huron Meadows Metropark – 1,540 acres – oak-hickory forest, cross-country skiing, golf
Manly Bennett Park (Hamburg Township) – 384 acres – athletic fields & courts, hiking trails, fishing dock
Downhill Skiing
Mt. Brighton Ski Area - 26 trails spread over 130 acres of skiable terrain
WASHTENAW COUNTY
Pinckey State Recreation Area – 11,000 acres - Several fishing lakes, 25 miles of biking & hiking trails, 4 campgrounds, 2 beaches
Waterloo State Recreation Area – 20,000 acres – 4 campgrounds, 47 miles of hiking trails, a beach, boating, fishing
Chelsea State Game Area - 799 acres around Fourmile Lake. Shore fishing, waterfowl hunting, small-boat launch, several unpaved trails
Hudson Mills Metropark – 1,549 acres – Huron River rapids, canoe, fishing, golf, 7 miles of trails
Dexter-Huron Metropark – 122 acres – Huron River, fishing, canoeing, woodlands, ballfields
Independence Lake County Park – 360 acres – lake, prairie, waterslide, fishing trails
Rolling Hills County Park – 363 acres – woods, trails, disc golf, sledding, cross-country skiing, fishing
Park Lyndon (County Park) – 335 acres – lake, steep hills, woods, trails, wetlands
Nichols Arboretum (University of Michigan) – 123 acres – native and exotic trees and shrubs, scenic river, hilly topography, trails
Gallup Park (city of Ann Arbor) – 69 acres – 3 miles of trails, canoe/kayak the Huron River, scenic walkways that traverse small islands
Bird Hills Nature Area (city of Ann Arbor) - 161 acres - The city's largest park, hilly green space, unpaved woodland hiking trails.
Notable Trails
Border to Border Trail - This route is 20 miles long, 35 miles are planned, runs along the edge of the Huron River.
Waterloo-Pinckey Trail – 35 miles long connects the 2 state recreation areas; passes pine plantations, open meadows, marshes, kettle bogs, forests, and 14 lakes
Potawatomi Trail – 17 Mile loop is hilly and picturesque for hiking and mountain biking
MONROE COUNTY
Sterling State Park – 1,300 acres – over 1 mile of Lake Erie beach, boating, fishing, camping
Petersburg State Game Area – 484 acres – managed game area, native wet-sand prairie habitat. Open for walking, dog runs.
Notable Trails
Sterling-River Raisin Heritage Trail – 8 miles long; provides access to historic sites, additional local parks and detours to downtown Monroe
ESSEX COUNTY (ONTARIO, YES CANADA)
Ojibway Prairie Complex – 834 acres spread across 5 adjacent parks 10 minutes from downtown Windsor - Wetlands, forest, savanna and prairie, trails
Point Pelee National Park - 3,860 acres - marsh and woodland habitats, tapers to a sharp point as it extends into Lake Erie, swimming beach, spectacular waterviews, hiking, canoeing
Point Pelee National Park
Hillman Marsh Conservation Area – 850 acres – marshland habitat, 5 km of nature trails, beach along Lake Erie, canoeing
Wheatley Provincial Park – 596 acres - Carolinian forest, a number of creekside campsites, 2 km of sandy Lake Erie beaches, trails
Notable Trails
Riverfront Trail (City of Windsor) - 5.17 km long - Scenic views of the Detroit River extending from Ambassador Park to Centennial Park into Dieppe Gardens
Ganatchio Trail – 6.2 km long – located where the Detroit River meets Lake St. Clair
02-12-2016, 10:56 AM
1,185 posts, read
1,503,692 times
Reputation: 2297
Quote:
Originally Posted by
magellan
That pretty much settles it for me.
5.6% increase in sales price.
13.1% increase in pending sale prices.
GR is a great city, but unfortunately, just priced itself out of the market.
Price increase has been too much, too fast. Don't want to be left holding the bag if the market slides.
02-12-2016, 11:34 AM
Location: Grand Rapids Metro
8,882 posts, read
19,856,367 times
Reputation: 3920
Quote:
Originally Posted by
Lockdev
That pretty much settles it for me.
I don't believe that to be true but if you have to check it off your list, I totally get it.
The average "sale price" is still $183,000 which is well below the national average of $224,000. And that's home sale price, not average home value. There's over 350,000 housing units in the metro area and only about 10,000 or so homes change hands (sell) every year.
When the sale price goes above the national average, I think it will start to affect home sales volume.
02-12-2016, 07:51 PM
1,185 posts, read
1,503,692 times
Reputation: 2297
Quote:
Originally Posted by
magellan
I don't believe that to be true but if you have to check it off your list, I totally get it.
I don't want to give up, but it's just like anything in business. If the price isn't right, it isn't right.
The average house price has been creeping up for the past 5 years. This past year has been insane.
Has there been a comparable increase in the average wage in GR?
If the answer is no to that last one, I feel that GR is moving in the wrong direction.
If the income percentage spent on a persons house is starting to creep up, it may put a damper on the local economy. More money spent on a mortgages equates to less money spent in the local economy.
02-13-2016, 07:21 AM
Location: Grand Rapids Metro
8,882 posts, read
19,856,367 times
Reputation: 3920
Quote:
Originally Posted by
Lockdev
I don't want to give up, but it's just like anything in business. If the price isn't right, it isn't right.
I don't know if you can compare the "average wage" to the average home sales price increase. If 500 or 1000 professionals move to the Grand Rapids metro area in a year, all making twice the "average wage," it's not really going to markedly change the average wage in the area for the other 550,000 people in the labor force. Or if 1000 recent college grads from GVSU land jobs in the area every year, and their wages are above the mean, they too won't move the needle that much. But they could all potentially afford the housing sales price increase.
Plus the percentage of people with college degrees has skyrocketed in the last 5 years, telling me there's an influx of college educated folks. It's pretty hard to increase that percentage of the existing population.
But you're right, if you're looking merely at it as an "investment," then most of the "profit" has been taken out of the market since the economy fully recovered a few years ago. If you bought 13 - 15 years ago in most of the good areas, you're looking pretty good right now. If you bought 7 or 8 years ago, you're not in as good of shape. If you bought 2 or 3 years ago, you're looking pretty good. Trying to time the housing market like it's the stock market though is not something I'd ever advise someone to do. And Grand Rapids has traditionally been a good "buy and hold" market, not a good short-term flippers market.
02-17-2016, 08:37 PM
Location: Grand Rapids
284 posts, read
1,016,841 times
Reputation: 224
Well, we have lived here about a year and bought our first home in December. I had been monitoring the market for about a year and half and can say the prices are steadily increasing, but we happened to land an incredible deal. Our home is worth quite a bit more than we paid, so I feel grateful, especially if home prices continue to go up. I figured, no time like the present to invest in this growing region! Forbes just confirmed that.
02-19-2016, 06:02 PM
Location: Grand Rapids Metro
8,882 posts, read
19,856,367 times
Reputation: 3920
02-22-2016, 11:06 AM
14,022 posts, read
15,028,594 times
Reputation: 10466
Quote:
Originally Posted by
Lockdev
That pretty much settles it for me.
If your interesting in living somewhere the market doesn't really matter, unless you think its going to be 2007.
Chances are even if the bubble is a little inflated now, in 10 years, the house will be worth more than it is now. Most places have nearly fully recovered or even better from the 06/07 prices, so unless you want to flip, don't worry about it, home values don't matter if your not selling.
Please register City-data.com
Data:
Median household income ($)
Median household income (% change since 2000)
Household income diversity
Ratio of average income to average house value (%)
Ratio of average income to average rent
Median household income ($) - White
Median household income ($) - Black or African American
Median household income ($) - Asian
Median household income ($) - Hispanic or Latino
Median household income ($) - American Indian and Alaska Native
Median household income ($) - Multirace
Median household income ($) - Other Race
Median household income for houses/condos with a mortgage ($)
Median household income for apartments without a mortgage ($)
Races - White alone (%)
Races - White alone (% change since 2000)
Races - Black alone (%)
Races - Black alone (% change since 2000)
Races - American Indian alone (%)
Races - American Indian alone (% change since 2000)
Races - Asian alone (%)
Races - Asian alone (% change since 2000)
Races - Hispanic (%)
Races - Hispanic (% change since 2000)
Races - Native Hawaiian and Other Pacific Islander alone (%)
Races - Native Hawaiian and Other Pacific Islander alone (% change since 2000)
Races - Two or more races (%)
Races - Two or more races (% change since 2000)
Races - Other race alone (%)
Races - Other race alone (% change since 2000)
Racial diversity
Unemployment (%)
Unemployment (% change since 2000)
Unemployment (%) - White
Unemployment (%) - Black or African American
Unemployment (%) - Asian
Unemployment (%) - Hispanic or Latino
Unemployment (%) - American Indian and Alaska Native
Unemployment (%) - Multirace
Unemployment (%) - Other Race
Population density (people per square mile)
Population - Males (%)
Population - Females (%)
Population - Males (%) - White
Population - Males (%) - Black or African American
Population - Males (%) - Asian
Population - Males (%) - Hispanic or Latino
Population - Males (%) - American Indian and Alaska Native
Population - Males (%) - Multirace
Population - Males (%) - Other Race
Population - Females (%) - White
Population - Females (%) - Black or African American
Population - Females (%) - Asian
Population - Females (%) - Hispanic or Latino
Population - Females (%) - American Indian and Alaska Native
Population - Females (%) - Multirace
Population - Females (%) - Other Race
Coronavirus confirmed cases (Apr 26, 2024)
Deaths caused by coronavirus (Apr 26, 2024)
Coronavirus confirmed cases (per 100k population) (Apr 26, 2024)
Deaths caused by coronavirus (per 100k population) (Apr 26, 2024)
Daily increase in number of cases (Apr 26, 2024)
Weekly increase in number of cases (Apr 26, 2024)
Cases doubled (in days) (Apr 26, 2024)
Hospitalized patients (Apr 18, 2022)
Negative test results (Apr 18, 2022)
Total test results (Apr 18, 2022)
COVID Vaccine doses distributed (per 100k population) (Sep 19, 2023)
COVID Vaccine doses administered (per 100k population) (Sep 19, 2023)
COVID Vaccine doses distributed (Sep 19, 2023)
COVID Vaccine doses administered (Sep 19, 2023)
Likely homosexual households (%)
Likely homosexual households (% change since 2000)
Likely homosexual households - Lesbian couples (%)
Likely homosexual households - Lesbian couples (% change since 2000)
Likely homosexual households - Gay men (%)
Likely homosexual households - Gay men (% change since 2000)
Cost of living index
Median gross rent ($)
Median contract rent ($)
Median monthly housing costs ($)
Median house or condo value ($)
Median house or condo value ($ change since 2000)
Mean house or condo value by units in structure - 1, detached ($)
Mean house or condo value by units in structure - 1, attached ($)
Mean house or condo value by units in structure - 2 ($)
Mean house or condo value by units in structure by units in structure - 3 or 4 ($)
Mean house or condo value by units in structure - 5 or more ($)
Mean house or condo value by units in structure - Boat, RV, van, etc. ($)
Mean house or condo value by units in structure - Mobile home ($)
Median house or condo value ($) - White
Median house or condo value ($) - Black or African American
Median house or condo value ($) - Asian
Median house or condo value ($) - Hispanic or Latino
Median house or condo value ($) - American Indian and Alaska Native
Median house or condo value ($) - Multirace
Median house or condo value ($) - Other Race
Median resident age
Resident age diversity
Median resident age - Males
Median resident age - Females
Median resident age - White
Median resident age - Black or African American
Median resident age - Asian
Median resident age - Hispanic or Latino
Median resident age - American Indian and Alaska Native
Median resident age - Multirace
Median resident age - Other Race
Median resident age - Males - White
Median resident age - Males - Black or African American
Median resident age - Males - Asian
Median resident age - Males - Hispanic or Latino
Median resident age - Males - American Indian and Alaska Native
Median resident age - Males - Multirace
Median resident age - Males - Other Race
Median resident age - Females - White
Median resident age - Females - Black or African American
Median resident age - Females - Asian
Median resident age - Females - Hispanic or Latino
Median resident age - Females - American Indian and Alaska Native
Median resident age - Females - Multirace
Median resident age - Females - Other Race
Commute - mean travel time to work (minutes)
Travel time to work - Less than 5 minutes (%)
Travel time to work - Less than 5 minutes (% change since 2000)
Travel time to work - 5 to 9 minutes (%)
Travel time to work - 5 to 9 minutes (% change since 2000)
Travel time to work - 10 to 19 minutes (%)
Travel time to work - 10 to 19 minutes (% change since 2000)
Travel time to work - 20 to 29 minutes (%)
Travel time to work - 20 to 29 minutes (% change since 2000)
Travel time to work - 30 to 39 minutes (%)
Travel time to work - 30 to 39 minutes (% change since 2000)
Travel time to work - 40 to 59 minutes (%)
Travel time to work - 40 to 59 minutes (% change since 2000)
Travel time to work - 60 to 89 minutes (%)
Travel time to work - 60 to 89 minutes (% change since 2000)
Travel time to work - 90 or more minutes (%)
Travel time to work - 90 or more minutes (% change since 2000)
Marital status - Never married (%)
Marital status - Now married (%)
Marital status - Separated (%)
Marital status - Widowed (%)
Marital status - Divorced (%)
Median family income ($)
Median family income (% change since 2000)
Median non-family income ($)
Median non-family income (% change since 2000)
Median per capita income ($)
Median per capita income (% change since 2000)
Median family income ($) - White
Median family income ($) - Black or African American
Median family income ($) - Asian
Median family income ($) - Hispanic or Latino
Median family income ($) - American Indian and Alaska Native
Median family income ($) - Multirace
Median family income ($) - Other Race
Median year house/condo built
Median year apartment built
Year house built - Built 2005 or later (%)
Year house built - Built 2000 to 2004 (%)
Year house built - Built 1990 to 1999 (%)
Year house built - Built 1980 to 1989 (%)
Year house built - Built 1970 to 1979 (%)
Year house built - Built 1960 to 1969 (%)
Year house built - Built 1950 to 1959 (%)
Year house built - Built 1940 to 1949 (%)
Year house built - Built 1939 or earlier (%)
Average household size
Household density (households per square mile)
Average household size - White
Average household size - Black or African American
Average household size - Asian
Average household size - Hispanic or Latino
Average household size - American Indian and Alaska Native
Average household size - Multirace
Average household size - Other Race
Occupied housing units (%)
Vacant housing units (%)
Owner occupied housing units (%)
Renter occupied housing units (%)
Vacancy status - For rent (%)
Vacancy status - For sale only (%)
Vacancy status - Rented or sold, not occupied (%)
Vacancy status - For seasonal, recreational, or occasional use (%)
Vacancy status - For migrant workers (%)
Vacancy status - Other vacant (%)
Residents with income below the poverty level (%)
Residents with income below 50% of the poverty level (%)
Children below poverty level (%)
Poor families by family type - Married-couple family (%)
Poor families by family type - Male, no wife present (%)
Poor families by family type - Female, no husband present (%)
Poverty status for native-born residents (%)
Poverty status for foreign-born residents (%)
Poverty among high school graduates not in families (%)
Poverty among people who did not graduate high school not in families (%)
Residents with income below the poverty level (%) - White
Residents with income below the poverty level (%) - Black or African American
Residents with income below the poverty level (%) - Asian
Residents with income below the poverty level (%) - Hispanic or Latino
Residents with income below the poverty level (%) - American Indian and Alaska Native
Residents with income below the poverty level (%) - Multirace
Residents with income below the poverty level (%) - Other Race
Air pollution - Air Quality Index (AQI)
Air pollution - CO
Air pollution - NO2
Air pollution - SO2
Air pollution - Ozone
Air pollution - PM10
Air pollution - PM25
Air pollution - Pb
Crime - Murders per 100,000 population
Crime - Rapes per 100,000 population
Crime - Robberies per 100,000 population
Crime - Assaults per 100,000 population
Crime - Burglaries per 100,000 population
Crime - Thefts per 100,000 population
Crime - Auto thefts per 100,000 population
Crime - Arson per 100,000 population
Crime - City-data.com crime index
Crime - Violent crime index
Crime - Property crime index
Crime - Murders per 100,000 population (5 year average)
Crime - Rapes per 100,000 population (5 year average)
Crime - Robberies per 100,000 population (5 year average)
Crime - Assaults per 100,000 population (5 year average)
Crime - Burglaries per 100,000 population (5 year average)
Crime - Thefts per 100,000 population (5 year average)
Crime - Auto thefts per 100,000 population (5 year average)
Crime - Arson per 100,000 population (5 year average)
Crime - City-data.com crime index (5 year average)
Crime - Violent crime index (5 year average)
Crime - Property crime index (5 year average)
1996 Presidential Elections Results (%) - Democratic Party (Clinton)
1996 Presidential Elections Results (%) - Republican Party (Dole)
1996 Presidential Elections Results (%) - Other
2000 Presidential Elections Results (%) - Democratic Party (Gore)
2000 Presidential Elections Results (%) - Republican Party (Bush)
2000 Presidential Elections Results (%) - Other
2004 Presidential Elections Results (%) - Democratic Party (Kerry)
2004 Presidential Elections Results (%) - Republican Party (Bush)
2004 Presidential Elections Results (%) - Other
2008 Presidential Elections Results (%) - Democratic Party (Obama)
2008 Presidential Elections Results (%) - Republican Party (McCain)
2008 Presidential Elections Results (%) - Other
2012 Presidential Elections Results (%) - Democratic Party (Obama)
2012 Presidential Elections Results (%) - Republican Party (Romney)
2012 Presidential Elections Results (%) - Other
2016 Presidential Elections Results (%) - Democratic Party (Clinton)
2016 Presidential Elections Results (%) - Republican Party (Trump)
2016 Presidential Elections Results (%) - Other
2020 Presidential Elections Results (%) - Democratic Party (Biden)
2020 Presidential Elections Results (%) - Republican Party (Trump)
2020 Presidential Elections Results (%) - Other
Ancestries Reported - Arab (%)
Ancestries Reported - Czech (%)
Ancestries Reported - Danish (%)
Ancestries Reported - Dutch (%)
Ancestries Reported - English (%)
Ancestries Reported - French (%)
Ancestries Reported - French Canadian (%)
Ancestries Reported - German (%)
Ancestries Reported - Greek (%)
Ancestries Reported - Hungarian (%)
Ancestries Reported - Irish (%)
Ancestries Reported - Italian (%)
Ancestries Reported - Lithuanian (%)
Ancestries Reported - Norwegian (%)
Ancestries Reported - Polish (%)
Ancestries Reported - Portuguese (%)
Ancestries Reported - Russian (%)
Ancestries Reported - Scotch-Irish (%)
Ancestries Reported - Scottish (%)
Ancestries Reported - Slovak (%)
Ancestries Reported - Subsaharan African (%)
Ancestries Reported - Swedish (%)
Ancestries Reported - Swiss (%)
Ancestries Reported - Ukrainian (%)
Ancestries Reported - United States (%)
Ancestries Reported - Welsh (%)
Ancestries Reported - West Indian (%)
Ancestries Reported - Other (%)
Educational Attainment - No schooling completed (%)
Educational Attainment - Less than high school (%)
Educational Attainment - High school or equivalent (%)
Educational Attainment - Less than 1 year of college (%)
Educational Attainment - 1 or more years of college (%)
Educational Attainment - Associate degree (%)
Educational Attainment - Bachelor's degree (%)
Educational Attainment - Master's degree (%)
Educational Attainment - Professional school degree (%)
Educational Attainment - Doctorate degree (%)
School Enrollment - Nursery, preschool (%)
School Enrollment - Kindergarten (%)
School Enrollment - Grade 1 to 4 (%)
School Enrollment - Grade 5 to 8 (%)
School Enrollment - Grade 9 to 12 (%)
School Enrollment - College undergrad (%)
School Enrollment - Graduate or professional (%)
School Enrollment - Not enrolled in school (%)
School enrollment - Public schools (%)
School enrollment - Private schools (%)
School enrollment - Not enrolled (%)
Median number of rooms in houses and condos
Median number of rooms in apartments
Housing units lacking complete plumbing facilities (%)
Housing units lacking complete kitchen facilities (%)
Density of houses
Urban houses (%)
Rural houses (%)
Households with people 60 years and over (%)
Households with people 65 years and over (%)
Households with people 75 years and over (%)
Households with one or more nonrelatives (%)
Households with no nonrelatives (%)
Population in households (%)
Family households (%)
Nonfamily households (%)
Population in families (%)
Family households with own children (%)
Median number of bedrooms in owner occupied houses
Mean number of bedrooms in owner occupied houses
Median number of bedrooms in renter occupied houses
Mean number of bedrooms in renter occupied houses
Median number of vehichles in owner occupied houses
Mean number of vehichles in owner occupied houses
Median number of vehichles in renter occupied houses
Mean number of vehichles in renter occupied houses
Mortgage status - with mortgage (%)
Mortgage status - with second mortgage (%)
Mortgage status - with home equity loan (%)
Mortgage status - with both second mortgage and home equity loan (%)
Mortgage status - without a mortgage (%)
Average family size
Average family size - White
Average family size - Black or African American
Average family size - Asian
Average family size - Hispanic or Latino
Average family size - American Indian and Alaska Native
Average family size - Multirace
Average family size - Other Race
Geographical mobility - Same house 1 year ago (%)
Geographical mobility - Moved within same county (%)
Geographical mobility - Moved from different county within same state (%)
Geographical mobility - Moved from different state (%)
Geographical mobility - Moved from abroad (%)
Place of birth - Born in state of residence (%)
Place of birth - Born in other state (%)
Place of birth - Native, outside of US (%)
Place of birth - Foreign born (%)
Housing units in structures - 1, detached (%)
Housing units in structures - 1, attached (%)
Housing units in structures - 2 (%)
Housing units in structures - 3 or 4 (%)
Housing units in structures - 5 to 9 (%)
Housing units in structures - 10 to 19 (%)
Housing units in structures - 20 to 49 (%)
Housing units in structures - 50 or more (%)
Housing units in structures - Mobile home (%)
Housing units in structures - Boat, RV, van, etc. (%)
House/condo owner moved in on average (years ago)
Renter moved in on average (years ago)
Year householder moved into unit - Moved in 1999 to March 2000 (%)
Year householder moved into unit - Moved in 1995 to 1998 (%)
Year householder moved into unit - Moved in 1990 to 1994 (%)
Year householder moved into unit - Moved in 1980 to 1989 (%)
Year householder moved into unit - Moved in 1970 to 1979 (%)
Year householder moved into unit - Moved in 1969 or earlier (%)
Means of transportation to work - Drove car alone (%)
Means of transportation to work - Carpooled (%)
Means of transportation to work - Public transportation (%)
Means of transportation to work - Bus or trolley bus (%)
Means of transportation to work - Streetcar or trolley car (%)
Means of transportation to work - Subway or elevated (%)
Means of transportation to work - Railroad (%)
Means of transportation to work - Ferryboat (%)
Means of transportation to work - Taxicab (%)
Means of transportation to work - Motorcycle (%)
Means of transportation to work - Bicycle (%)
Means of transportation to work - Walked (%)
Means of transportation to work - Other means (%)
Working at home (%)
Industry diversity
Most Common Industries - Agriculture, forestry, fishing and hunting, and mining (%)
Most Common Industries - Agriculture, forestry, fishing and hunting (%)
Most Common Industries - Mining, quarrying, and oil and gas extraction (%)
Most Common Industries - Construction (%)
Most Common Industries - Manufacturing (%)
Most Common Industries - Wholesale trade (%)
Most Common Industries - Retail trade (%)
Most Common Industries - Transportation and warehousing, and utilities (%)
Most Common Industries - Transportation and warehousing (%)
Most Common Industries - Utilities (%)
Most Common Industries - Information (%)
Most Common Industries - Finance and insurance, and real estate and rental and leasing (%)
Most Common Industries - Finance and insurance (%)
Most Common Industries - Real estate and rental and leasing (%)
Most Common Industries - Professional, scientific, and management, and administrative and waste management services (%)
Most Common Industries - Professional, scientific, and technical services (%)
Most Common Industries - Management of companies and enterprises (%)
Most Common Industries - Administrative and support and waste management services (%)
Most Common Industries - Educational services, and health care and social assistance (%)
Most Common Industries - Educational services (%)
Most Common Industries - Health care and social assistance (%)
Most Common Industries - Arts, entertainment, and recreation, and accommodation and food services (%)
Most Common Industries - Arts, entertainment, and recreation (%)
Most Common Industries - Accommodation and food services (%)
Most Common Industries - Other services, except public administration (%)
Most Common Industries - Public administration (%)
Occupation diversity
Most Common Occupations - Management, business, science, and arts occupations (%)
Most Common Occupations - Management, business, and financial occupations (%)
Most Common Occupations - Management occupations (%)
Most Common Occupations - Business and financial operations occupations (%)
Most Common Occupations - Computer, engineering, and science occupations (%)
Most Common Occupations - Computer and mathematical occupations (%)
Most Common Occupations - Architecture and engineering occupations (%)
Most Common Occupations - Life, physical, and social science occupations (%)
Most Common Occupations - Education, legal, community service, arts, and media occupations (%)
Most Common Occupations - Community and social service occupations (%)
Most Common Occupations - Legal occupations (%)
Most Common Occupations - Education, training, and library occupations (%)
Most Common Occupations - Arts, design, entertainment, sports, and media occupations (%)
Most Common Occupations - Healthcare practitioners and technical occupations (%)
Most Common Occupations - Health diagnosing and treating practitioners and other technical occupations (%)
Most Common Occupations - Health technologists and technicians (%)
Most Common Occupations - Service occupations (%)
Most Common Occupations - Healthcare support occupations (%)
Most Common Occupations - Protective service occupations (%)
Most Common Occupations - Fire fighting and prevention, and other protective service workers including supervisors (%)
Most Common Occupations - Law enforcement workers including supervisors (%)
Most Common Occupations - Food preparation and serving related occupations (%)
Most Common Occupations - Building and grounds cleaning and maintenance occupations (%)
Most Common Occupations - Personal care and service occupations (%)
Most Common Occupations - Sales and office occupations (%)
Most Common Occupations - Sales and related occupations (%)
Most Common Occupations - Office and administrative support occupations (%)
Most Common Occupations - Natural resources, construction, and maintenance occupations (%)
Most Common Occupations - Farming, fishing, and forestry occupations (%)
Most Common Occupations - Construction and extraction occupations (%)
Most Common Occupations - Installation, maintenance, and repair occupations (%)
Most Common Occupations - Production, transportation, and material moving occupations (%)
Most Common Occupations - Production occupations (%)
Most Common Occupations - Transportation occupations (%)
Most Common Occupations - Material moving occupations (%)
People in Group quarters - Institutionalized population (%)
People in Group quarters - Correctional institutions (%)
People in Group quarters - Federal prisons and detention centers (%)
People in Group quarters - Halfway houses (%)
People in Group quarters - Local jails and other confinement facilities (including police lockups) (%)
People in Group quarters - Military disciplinary barracks (%)
People in Group quarters - State prisons (%)
People in Group quarters - Other types of correctional institutions (%)
People in Group quarters - Nursing homes (%)
People in Group quarters - Hospitals/wards, hospices, and schools for the handicapped (%)
People in Group quarters - Hospitals/wards and hospices for chronically ill (%)
People in Group quarters - Hospices or homes for chronically ill (%)
People in Group quarters - Military hospitals or wards for chronically ill (%)
People in Group quarters - Other hospitals or wards for chronically ill (%)
People in Group quarters - Hospitals or wards for drug/alcohol abuse (%)
People in Group quarters - Mental (Psychiatric) hospitals or wards (%)
People in Group quarters - Schools, hospitals, or wards for the mentally retarded (%)
People in Group quarters - Schools, hospitals, or wards for the physically handicapped (%)
People in Group quarters - Institutions for the deaf (%)
People in Group quarters - Institutions for the blind (%)
People in Group quarters - Orthopedic wards and institutions for the physically handicapped (%)
People in Group quarters - Wards in general hospitals for patients who have no usual home elsewhere (%)
People in Group quarters - Wards in military hospitals for patients who have no usual home elsewhere (%)
People in Group quarters - Juvenile institutions (%)
People in Group quarters - Long-term care (%)
People in Group quarters - Homes for abused, dependent, and neglected children (%)
People in Group quarters - Residential treatment centers for emotionally disturbed children (%)
People in Group quarters - Training schools for juvenile delinquents (%)
People in Group quarters - Short-term care, detention or diagnostic centers for delinquent children (%)
People in Group quarters - Type of juvenile institution unknown (%)
People in Group quarters - Noninstitutionalized population (%)
People in Group quarters - College dormitories (includes college quarters off campus) (%)
People in Group quarters - Military quarters (%)
People in Group quarters - On base (%)
People in Group quarters - Barracks, unaccompanied personnel housing (UPH), (Enlisted/Officer), ;and similar group living quarters for military personnel (%)
People in Group quarters - Transient quarters for temporary residents (%)
People in Group quarters - Military ships (%)
People in Group quarters - Group homes (%)
People in Group quarters - Homes or halfway houses for drug/alcohol abuse (%)
People in Group quarters - Homes for the mentally ill (%)
People in Group quarters - Homes for the mentally retarded (%)
People in Group quarters - Homes for the physically handicapped (%)
People in Group quarters - Other group homes (%)
People in Group quarters - Religious group quarters (%)
People in Group quarters - Dormitories (%)
People in Group quarters - Agriculture workers' dormitories on farms (%)
People in Group quarters - Job Corps and vocational training facilities (%)
People in Group quarters - Other workers' dormitories (%)
People in Group quarters - Crews of maritime vessels (%)
People in Group quarters - Other nonhousehold living situations (%)
People in Group quarters - Other noninstitutional group quarters (%)
Residents speaking English at home (%)
Residents speaking English at home - Born in the United States (%)
Residents speaking English at home - Native, born elsewhere (%)
Residents speaking English at home - Foreign born (%)
Residents speaking Spanish at home (%)
Residents speaking Spanish at home - Born in the United States (%)
Residents speaking Spanish at home - Native, born elsewhere (%)
Residents speaking Spanish at home - Foreign born (%)
Residents speaking other language at home (%)
Residents speaking other language at home - Born in the United States (%)
Residents speaking other language at home - Native, born elsewhere (%)
Residents speaking other language at home - Foreign born (%)
Class of Workers - Employee of private company (%)
Class of Workers - Self-employed in own incorporated business (%)
Class of Workers - Private not-for-profit wage and salary workers (%)
Class of Workers - Local government workers (%)
Class of Workers - State government workers (%)
Class of Workers - Federal government workers (%)
Class of Workers - Self-employed workers in own not incorporated business and Unpaid family workers (%)
House heating fuel used in houses and condos - Utility gas (%)
House heating fuel used in houses and condos - Bottled, tank, or LP gas (%)
House heating fuel used in houses and condos - Electricity (%)
House heating fuel used in houses and condos - Fuel oil, kerosene, etc. (%)
House heating fuel used in houses and condos - Coal or coke (%)
House heating fuel used in houses and condos - Wood (%)
House heating fuel used in houses and condos - Solar energy (%)
House heating fuel used in houses and condos - Other fuel (%)
House heating fuel used in houses and condos - No fuel used (%)
House heating fuel used in apartments - Utility gas (%)
House heating fuel used in apartments - Bottled, tank, or LP gas (%)
House heating fuel used in apartments - Electricity (%)
House heating fuel used in apartments - Fuel oil, kerosene, etc. (%)
House heating fuel used in apartments - Coal or coke (%)
House heating fuel used in apartments - Wood (%)
House heating fuel used in apartments - Solar energy (%)
House heating fuel used in apartments - Other fuel (%)
House heating fuel used in apartments - No fuel used (%)
Armed forces status - In Armed Forces (%)
Armed forces status - Civilian (%)
Armed forces status - Civilian - Veteran (%)
Armed forces status - Civilian - Nonveteran (%)
Fatal accidents locations in years 2005-2021
Fatal accidents locations in 2005
Fatal accidents locations in 2006
Fatal accidents locations in 2007
Fatal accidents locations in 2008
Fatal accidents locations in 2009
Fatal accidents locations in 2010
Fatal accidents locations in 2011
Fatal accidents locations in 2012
Fatal accidents locations in 2013
Fatal accidents locations in 2014
Fatal accidents locations in 2015
Fatal accidents locations in 2016
Fatal accidents locations in 2017
Fatal accidents locations in 2018
Fatal accidents locations in 2019
Fatal accidents locations in 2020
Fatal accidents locations in 2021
Alcohol use - People drinking some alcohol every month (%)
Alcohol use - People not drinking at all (%)
Alcohol use - Average days/month drinking alcohol
Alcohol use - Average drinks/week
Alcohol use - Average days/year people drink much
Audiometry - Average condition of hearing (%)
Audiometry - People that can hear a whisper from across a quiet room (%)
Audiometry - People that can hear normal voice from across a quiet room (%)
Audiometry - Ears ringing, roaring, buzzing (%)
Audiometry - Had a job exposure to loud noise (%)
Audiometry - Had off-work exposure to loud noise (%)
Blood Pressure & Cholesterol - Has high blood pressure (%)
Blood Pressure & Cholesterol - Checking blood pressure at home (%)
Blood Pressure & Cholesterol - Frequently checking blood cholesterol (%)
Blood Pressure & Cholesterol - Has high cholesterol level (%)
Consumer Behavior - Money monthly spent on food at supermarket/grocery store
Consumer Behavior - Money monthly spent on food at other stores
Consumer Behavior - Money monthly spent on eating out
Consumer Behavior - Money monthly spent on carryout/delivered foods
Consumer Behavior - Income spent on food at supermarket/grocery store (%)
Consumer Behavior - Income spent on food at other stores (%)
Consumer Behavior - Income spent on eating out (%)
Consumer Behavior - Income spent on carryout/delivered foods (%)
Current Health Status - General health condition (%)
Current Health Status - Blood donors (%)
Current Health Status - Has blood ever tested for HIV virus (%)
Current Health Status - Left-handed people (%)
Dermatology - People using sunscreen (%)
Diabetes - Diabetics (%)
Diabetes - Had a blood test for high blood sugar (%)
Diabetes - People taking insulin (%)
Diet Behavior & Nutrition - Diet health (%)
Diet Behavior & Nutrition - Milk product consumption (# of products/month)
Diet Behavior & Nutrition - Meals not home prepared (#/week)
Diet Behavior & Nutrition - Meals from fast food or pizza place (#/week)
Diet Behavior & Nutrition - Ready-to-eat foods (#/month)
Diet Behavior & Nutrition - Frozen meals/pizza (#/month)
Drug Use - People that ever used marijuana or hashish (%)
Drug Use - Ever used hard drugs (%)
Drug Use - Ever used any form of cocaine (%)
Drug Use - Ever used heroin (%)
Drug Use - Ever used methamphetamine (%)
Health Insurance - People covered by health insurance (%)
Kidney Conditions-Urology - Avg. # of times urinating at night
Medical Conditions - People with asthma (%)
Medical Conditions - People with anemia (%)
Medical Conditions - People with psoriasis (%)
Medical Conditions - People with overweight (%)
Medical Conditions - Elderly people having difficulties in thinking or remembering (%)
Medical Conditions - People who ever received blood transfusion (%)
Medical Conditions - People having trouble seeing even with glass/contacts (%)
Medical Conditions - People with arthritis (%)
Medical Conditions - People with gout (%)
Medical Conditions - People with congestive heart failure (%)
Medical Conditions - People with coronary heart disease (%)
Medical Conditions - People with angina pectoris (%)
Medical Conditions - People who ever had heart attack (%)
Medical Conditions - People who ever had stroke (%)
Medical Conditions - People with emphysema (%)
Medical Conditions - People with thyroid problem (%)
Medical Conditions - People with chronic bronchitis (%)
Medical Conditions - People with any liver condition (%)
Medical Conditions - People who ever had cancer or malignancy (%)
Mental Health - People who have little interest in doing things (%)
Mental Health - People feeling down, depressed, or hopeless (%)
Mental Health - People who have trouble sleeping or sleeping too much (%)
Mental Health - People feeling tired or having little energy (%)
Mental Health - People with poor appetite or overeating (%)
Mental Health - People feeling bad about themself (%)
Mental Health - People who have trouble concentrating on things (%)
Mental Health - People moving or speaking slowly or too fast (%)
Mental Health - People having thoughts they would be better off dead (%)
Oral Health - Average years since last visit a dentist
Oral Health - People embarrassed because of mouth (%)
Oral Health - People with gum disease (%)
Oral Health - General health of teeth and gums (%)
Oral Health - Average days a week using dental floss/device
Oral Health - Average days a week using mouthwash for dental problem
Oral Health - Average number of teeth
Pesticide Use - Households using pesticides to control insects (%)
Pesticide Use - Households using pesticides to kill weeds (%)
Physical Activity - People doing vigorous-intensity work activities (%)
Physical Activity - People doing moderate-intensity work activities (%)
Physical Activity - People walking or bicycling (%)
Physical Activity - People doing vigorous-intensity recreational activities (%)
Physical Activity - People doing moderate-intensity recreational activities (%)
Physical Activity - Average hours a day doing sedentary activities
Physical Activity - Average hours a day watching TV or videos
Physical Activity - Average hours a day using computer
Physical Functioning - People having limitations keeping them from working (%)
Physical Functioning - People limited in amount of work they can do (%)
Physical Functioning - People that need special equipment to walk (%)
Physical Functioning - People experiencing confusion/memory problems (%)
Physical Functioning - People requiring special healthcare equipment (%)
Prescription Medications - Average number of prescription medicines taking
Preventive Aspirin Use - Adults 40+ taking low-dose aspirin (%)
Reproductive Health - Vaginal deliveries (%)
Reproductive Health - Cesarean deliveries (%)
Reproductive Health - Deliveries resulted in a live birth (%)
Reproductive Health - Pregnancies resulted in a delivery (%)
Reproductive Health - Women breastfeeding newborns (%)
Reproductive Health - Women that had a hysterectomy (%)
Reproductive Health - Women that had both ovaries removed (%)
Reproductive Health - Women that have ever taken birth control pills (%)
Reproductive Health - Women taking birth control pills (%)
Reproductive Health - Women that have ever used Depo-Provera or injectables (%)
Reproductive Health - Women that have ever used female hormones (%)
Sexual Behavior - People 18+ that ever had sex (vaginal, anal, or oral) (%)
Sexual Behavior - Males 18+ that ever had vaginal sex with a woman (%)
Sexual Behavior - Males 18+ that ever performed oral sex on a woman (%)
Sexual Behavior - Males 18+ that ever had anal sex with a woman (%)
Sexual Behavior - Males 18+ that ever had any sex with a man (%)
Sexual Behavior - Females 18+ that ever had vaginal sex with a man (%)
Sexual Behavior - Females 18+ that ever performed oral sex on a man (%)
Sexual Behavior - Females 18+ that ever had anal sex with a man (%)
Sexual Behavior - Females 18+ that ever had any kind of sex with a woman (%)
Sexual Behavior - Average age people first had sex
Sexual Behavior - Average number of female sex partners in lifetime (males 18+)
Sexual Behavior - Average number of female vaginal sex partners in lifetime (males 18+)
Sexual Behavior - Average age people first performed oral sex on a woman (18+)
Sexual Behavior - Average number of woman performed oral sex on in lifetime (18+)
Sexual Behavior - Average number of male sex partners in lifetime (males 18+)
Sexual Behavior - Average number of male anal sex partners in lifetime (males 18+)
Sexual Behavior - Average age people first performed oral sex on a man (18+)
Sexual Behavior - Average number of male oral sex partners in lifetime (18+)
Sexual Behavior - People using protection when performing oral sex (%)
Sexual Behavior - Average number of times people have vaginal or anal sex a year
Sexual Behavior - People having sex without condom (%)
Sexual Behavior - Average number of male sex partners in lifetime (females 18+)
Sexual Behavior - Average number of male vaginal sex partners in lifetime (females 18+)
Sexual Behavior - Average number of female sex partners in lifetime (females 18+)
Sexual Behavior - Circumcised males 18+ (%)
Sleep Disorders - Average hours sleeping at night
Sleep Disorders - People that has trouble sleeping (%)
Smoking-Cigarette Use - People smoking cigarettes (%)
Taste & Smell - People 40+ having problems with smell (%)
Taste & Smell - People 40+ having problems with taste (%)
Taste & Smell - People 40+ that ever had wisdom teeth removed (%)
Taste & Smell - People 40+ that ever had tonsils teeth removed (%)
Taste & Smell - People 40+ that ever had a loss of consciousness because of a head injury (%)
Taste & Smell - People 40+ that ever had a broken nose or other serious injury to face or skull (%)
Taste & Smell - People 40+ that ever had two or more sinus infections (%)
Weight - Average height (inches)
Weight - Average weight (pounds)
Weight - Average BMI
Weight - People that are obese (%)
Weight - People that ever were obese (%)
Weight - People trying to lose weight (%)

 Please register to participate in our discussions with 2 million other members - it's free and quick! Some forums can only be seen by registered members. After you create your account, you'll be able to customize options and access all our 15,000 new posts/day with fewer ads.