Please register to participate in our discussions with 2 million other members - it's free and quick! Some forums can only be seen by registered members. After you create your account, you'll be able to customize options and access all our 15,000 new posts/day with fewer ads.
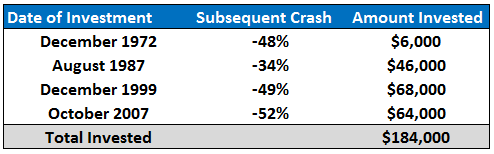
Just shows you how different each of the largest crashes have been in the US stock market and how "relatively speaking" quickly you were back to even if you didn't panic.
The 1987 crash would take 2 years to get your money back in real-inflation adjusted dollars.
The 1974 crash would take about 6.5 years to get your money back in real-inflation adjusted dollars.
The 1937 crash would take about 7 years to get your money back in real-inflation adjusted dollars.
The 1929 crash would take about 6 years to get your money back in real-inflation adjusted dollars (interestingly because of deflation during this time period it would take you 14 years to get your money back in nominal terms).
Interesting to see that you were back to even + inflation in less than 7 years and the 1937 crash was actually the worst from a climb back up standpoint.
supposedly every 7 years we have a market shake up with some black swan event plunging markets but the reality is the even that plunged the market the first year out of 7 had no effect really on most outcomes by the time the next 7 year even hit .
lets see how markets did following the events y that plunged them .
... the reality is the even that plunged the market the first year out of 7 had no effect really on most outcomes by the time the next 7 year even hit .
Another thing this analysis misses is that a good investor wouldn't have taken all their cash and invested it the week of, say, October 12-19, 1987. They probably put some money in some random previous months - say :
Jan, 1986 - Dow around 1,550
Jun, 1986 - Dow around 1,850
Dec, 1986 - Dow around 1,900
May, 1987 - Dow around 2,250
Jul, 1987 - Dow around 2,500
Sep, 1987 - Dow around 2,500
Then, it crashed from the Fri, Oct 16 open around 2,300 to the Mon, Oct 19 close around 1,700.
If you were buying over time then 15% of your stuff would still have been up and another 15% would be about breakeven and another 15% barely down.
Just looking at the peaks isn't good analysis. Looking at that peak and putting on your 20-20-hindsight glasses is fun, but hardly smart.
It's like the nematoad who bought gold at $1,850 in 2011 and whines about it. If you weren't also buying in earlier years then you are a dolt. Never shoot your whole load at once. Always have some dry powder.
Yup, This paper shows that even the world's worst market timer, who did nothing but invest the day before the crash would have made a lot of money over the past 45 years.
Here's an interesting look at 1987. If you got out of the market for the entire year of 1987 then you actually missed out on small gains. This illustrates the difficulties of timing the market.
Here's an interesting look at 1987. If you got out of the market for the entire year of 1987 then you actually missed out on small gains. This illustrates the difficulties of timing the market.
That's just crazy. Over the 52 weeks period here was actually money made.
"The 1974 crash would take about 6.5 years to get your money back in real-inflation adjusted dollars."
It's probably wide off the mark. S&P 500 went from 122 to 142, peak-to-peak from 1973 to 1980. The BLS inflation calculator says you would need $226 in 1980 to have the same purchasing power.
You just can't escape the DOW these days. It flashes across TV screens constantly. It's probably the first thing people look at when they open the financial pages. But it's the last thing you should pay attention to, if you want to make or protect your money. The DOW is comprised of 30 companies. That's 30 out of approximately 10,000 publicly traded companies. Yet somehow it's supposed to represent the market. But that's not the worst thing. The worst thing is: it is a revolving basket of companies with low-performing ones being replaced by better-performing ones all the times. That is the reason the DOW always looks good in the long term.
Here are 4 stocks that were once part of the DOW with 10 year historical prices:
SHLD 09/04/2015 $27.20 --- 09/06/2005 $102.44
HPQ 09/04/2015 $26.99 --- 09/06/2005 $27.25
GE 09/04/2015 $24.00 --- 09/06/2005 $33.45
BAC 09/04/2015 $15.65 --- 09/06/2005 $43.35
Investors who bought these stocks and held for 10 years from 09/06/2005 to 09/04/2015 would have lost money. Yet the DOW for same time period showed an uptrend. If these companies were still part of the DOW, it would have looked differently. The DOW clearly is not a reliable market indicator.
You are forgetting dividends. You need to look at the adjusted close for dividend paying companies. GEs adjusted close from 9/6/2005 is actually $23.72. You probably lost money after inflation, but yeah none of those stocks have done well over the last 10 years.
"The 1974 crash would take about 6.5 years to get your money back in real-inflation adjusted dollars."
It's probably wide off the mark. S&P 500 went from 122 to 142, peak-to-peak from 1973 to 1980. The BLS inflation calculator says you would need $226 in 1980 to have the same purchasing power.
One word: DIVIDENDS
Please register to post and access all features of our very popular forum. It is free and quick. Over $68,000 in prizes has already been given out to active posters on our forum. Additional giveaways are planned.
Detailed information about all U.S. cities, counties, and zip codes on our site: City-data.com.

 Please register to participate in our discussions with 2 million other members - it's free and quick! Some forums can only be seen by registered members. After you create your account, you'll be able to customize options and access all our 15,000 new posts/day with fewer ads.