


Relative area comparison
 Raleigh, NC
 Charlotte, NC
Raleigh, NC and
Charlotte, NC : 129.9 miles
Charlotte, NC
Raleigh, NC and
Charlotte, NC : 129.9 miles
Charlotte's population is larger by 88%. Its population has grown by 338,881 people (62.7%) since 2000. The population of Raleigh has grown by 193,031 people (69.9%) during that time.
| Population | ||
| Type | Raleigh | Charlotte |
|---|---|---|
| Population | 469,124 |
879,709 |
| Female / male percentage | 51.5% / 48.5%
|
51.8% / 48.2%
|
| Urban / rural population | 100% / 0%
|
100% / 0%
|
| Income | ||
| Type | Raleigh | Charlotte |
|---|---|---|
| Estimated median household income | $74,612 |
$70,869 |
| Estimated per capita income | $44,001 |
$44,593 |
| Cost of living index (U.S. average is 100) | 95.1 |
93.2 |
If you make $50,000 in Charlotte, you will have to make $51,019 in Raleigh to maintain the same standard of living.
| Geographical information | ||
| Type | Raleigh | Charlotte |
|---|---|---|
| Land area | 114.6 sq. miles | 242.3 sq. miles |
| Population density | 4,093.6 people per sq. mile | 3,631.1 people per sq. mile |
| Elevation | 350 feet | 850 feet |
Raleigh, NC
Charlotte, NC
| Educational attainment | ||
| Type | Raleigh | Charlotte |
|---|---|---|
| Less than high school | 7.1% |
9.9% |
| High school or equiv. | 15.9% |
16.9% |
| Less than 1 year of college | 4.5% |
4.3% |
| 1 or more years of college | 10.8% |
13% |
| Associate degree | 7.7% |
7.1% |
| Bachelor's degree | 32.1% |
31.1% |
| Master's degree | 15.1% |
13.5% |
| Profess. school degree | 3.6% |
3% |
| Doctorate degree | 3% |
1.3% |
| Education level (25-year-olds and older) | ||
| Type | Raleigh | Charlotte |
|---|---|---|
| Bachelor's degree or higher | 53.9% |
48.8% |
| Graduate or professional degree | 21.7% |
17.8% |
| High school or higher | 92.9% |
90.1% |
In Raleigh (Wake County), 54.9% voted for Democrats and 43.5% for Republicans in 2012 Presidential Election. In Charlotte (Mecklenburg County), 60.8% voted for Democrats and 38.3% for Republicans.
| Weather and climate | ||
| Type | Raleigh | Charlotte |
|---|---|---|
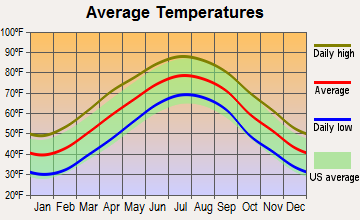
| Temperature - Average | 59.8°F | 61°F |
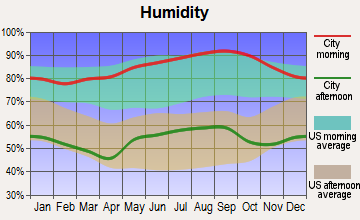
| Humidity - Average morning or afternoon humidity | 73.7% |
72.3% |
| Humidity - Differences between morning and afternoon humidity | 44% |
41% |
| Humidity - Maximum monthly morning or afternoon humidity | 90% |
87% |
| Humidity - Minimum monthly morning or afternoon humidity | 46% |
46% |
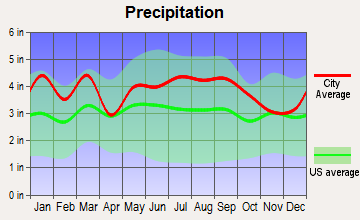
| Precipitation - Yearly average | 46.2 in | 44.5 in |
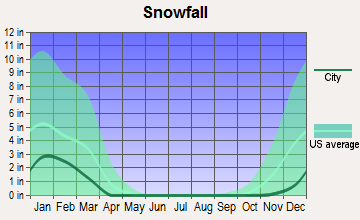
| Snowfall - Yearly average | 13.4 in | 10.2 in |
| Clouds - Number of days clear of clouds | 18.5% |
18.1% |
| Sunshine amount - Average | 63.9% |
69.8% |
| Sunshine amount - Differences during a year | 13% |
14% |
| Sunshine amount - Maximum monthly | 64% |
70% |
| Sunshine amount - Minimum monthly | 51% |
56% |
| Wind speed - Average | 7.1 mph | 6.9 mph |
| Natural disasters | ||
| Type | Raleigh | Charlotte |
|---|---|---|
| Tornado activity compared to U.S. average | 95.1% |
111.5% |
| Earthquake activity compared to U.S. average | 52.6% |
79% |
| Natural disasters compared to U.S. average | 18% |
9% |
| Transport | ||
| Type | Raleigh | Charlotte |
|---|---|---|
| Amtrak stations | 1 |
1 |
| Amtrak stations nearby | 3 |
2 |
| FAA registered aircraft | 499 |
439 |
| FAA registered aircraft manufacturers and dealers | 12 |
12 |
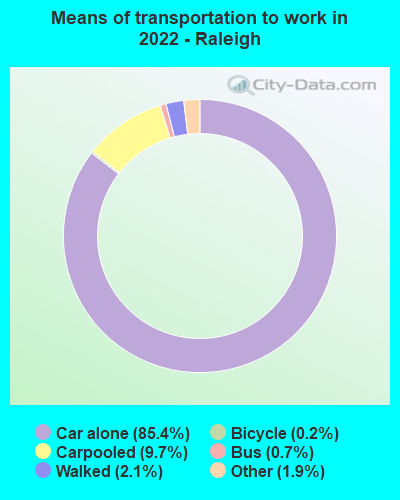
| Means of transportation to work | ||
| Type | Raleigh | Charlotte |
|---|---|---|
| Bicycle | 0.2% |
0.1% |
| Bus | 1.1% |
1.2% |
| Carpooled | 8.5% |
8.7% |
| Car alone | 87.4% |
86.2% |
| Motorcycle | 0.1% |
0.1% |
| Railroad | 0% |
0.4% |
| Taxicab | 0.3% |
0.2% |
| Walked | 1.1% |
1.5% |
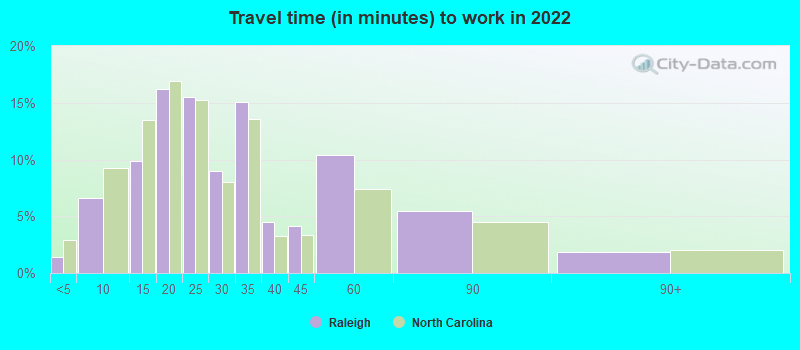
| Average travel time to work | ||
| Type | Raleigh | Charlotte |
|---|---|---|
| Average | 29.4 min | 29.6 min |
| Other means | 22.5 min | 24.9 min |
| Public transportation | 39.9 min | 44.1 min |
| Private vehicle occupancy | ||
| Type | Raleigh | Charlotte |
|---|---|---|
| Average | 1.1 |
1.2 |
| Drove alone | 90.1% |
90% |
| In 2 person carpool | 7.6% |
6.9% |
| In 3 person carpool | 1.4% |
1.8% |
| In 4 person carpool | 0.3% |
0.8% |
| In 5-6 person carpool | 0.6% |
0.5% |
How many people usually rode to work in the car, truck or van.
| Houses and residents | ||
| Type | Raleigh | Charlotte |
|---|---|---|
| Houses | 217,866 |
393,631 |
| Average household size (people) | 2.4 |
2.5 |
| Median year apartment built | 1995 |
1998 |
| Median year house/condo built | 1995 |
1993 |
| Length of stay in the house since moving in | 11.5 years | 11.8 years |
| Houses occupied | 194,917 (89.5%) | 365,269 (92.8%) |
| Houses occupied by owners | 103,367 (53%) | 193,930 (53.1%) |
| Houses occupied by renters | 91,550 (47%) | 171,339 (46.9%) |
| Median rent asked for vacant for-rent units | $1,740 |
$1,482 |
| Median monthly housing costs | $1,298 |
$1,302 |
| Median price asked for vacant for-sale houses and condos | $302,120 |
$445,491 |
| Estimated median house or condo value | $340,200 |
$321,400 |
| Median numbers of rooms | 5.1 |
5.3 |
| Median number of rooms in apartments | 3.9 |
4 |
| Median number of rooms in houses and condos | 6.7 |
6.6 |
| Median house price - detached houses | $446,507 |
$388,029 |
| Median house price - in 2-unit structures | $403,968 |
$184,325 |
| Median house price - in 3-to-4-unit structures | $170,635 |
$178,624 |
| Median house price - in 5 or more unit structures | $306,998 |
$433,957 |
| Median house price - mobile homes | $31,622 |
$52,977 |
| Median house price - Townhouses or other attached units | $292,086 |
$296,370 |
| Median house price - All housing units | $404,828 |
$378,423 |
| Median house age | 26 |
26 |
| Renting percentage | 46.5% |
42.6% |
| Housing density (houses/condos per square mile) | 1,901.1 |
1,624.8 |
| House value disparities | 30.8% |
33.3% |
| Household income disparities | 45.4% |
44.1% |
| Median household income for houses/condes with a mortgage | $114,680 |
$105,905 |
| Median household income for apartments without a mortgage | $81,716 |
$70,681 |
| Housing units without a mortgage | 1,689 (2.1%) | 3,089 (2.1%) |
| Housing units with both a second mortgage and home equity loan | 6,627 (8.2%) | 10,553 (7.2%) |
| Housing units with a mortgage | 78,923 (97.9%) | 142,912 (97.9%) |
| Housing units with a home equity loan | 0 (0%) | 171 (0.1%) |
| Housing units with a second mortgage | 7,783 (9.7%) | 13,532 (9.3%) |
| House/condo owner moved in on average (years ago) | 8 |
9 |
| House/condo renter moved in on average (years ago) | 1 |
1 |
| Housing units lacking complete kitchen facilities | 0.6% |
0.8% |
| Housing units lacking complete plumbing facilities | 0.5% |
0.2% |
| Median real estate property taxes paid for housing units | ||
| Type | Raleigh | Charlotte |
|---|---|---|
| With mortgages | $2,647 (0.8%) | $2,584 (0.8%) |
| With no mortgages | $3,013 (0.8%) | $2,522 (0.8%) |
| Marital status | ||
| Type | Raleigh | Charlotte |
|---|---|---|
| Divorced | 10.8% |
9.6% |
| Never married | 39.8% |
41.7% |
| Now married | 43.5% |
43.1% |
| Separated | 1.8% |
2.1% |
| Widowed | 4.1% |
3.5% |
| Health (county statistics) | ||
| Type | Raleigh | Charlotte |
|---|---|---|
| General health status score of residents in this county from 1 (poor) to 5 (excellent) | 3.6 | 3.5 |
| Average weight of females (lbs) | 163.6 lbs | 164.8 lbs |
| Average weight of males (lbs) | 193.8 lbs | 198.6 lbs |
| Residents visited a dentist within the past year | 70.9% | 66.4% |
| Residents exercised in the past month | 79.1% | 73.3% |
| Adult residents drank alcohol in the past 30 days | 55.9% | 48.8% |
| Residents smoked 100+ cigarettes in their lives | 35.9% | 42.2% |
| People in group quarters | ||
| Type | Raleigh | Charlotte |
|---|---|---|
| Agriculture workers' dormitories on farms | 0 (0%) | 0 (0%) |
| College dormitories (includes college quarters off campus) | 10,711 (3.9%) | 4,902 (0.9%) |
| Crews of maritime vessels | 0 (0%) | 0 (0%) |
| Dormitories | 0 (0%) | 0 (0%) |
| Federal prisons and detention centers | 0 (0%) | 0 (0%) |
| Group homes | 0 (0%) | 0 (0%) |
| Halfway houses | 0 (0%) | 142 (0%) |
| Homes for abused, dependent, and neglected children | 3 (0%) | 0 (0%) |
| Homes for the mentally ill | 14 (0%) | 36 (0%) |
| Homes for the mentally retarded | 21 (0%) | 292 (0.1%) |
| Homes for the physically handicapped | 16 (0%) | 17 (0%) |
| Homes or halfway houses for drug/alcohol abuse | 75 (0%) | 264 (0%) |
| Hospices or homes for chronically ill | 4 (0%) | 0 (0%) |
| Hospitals or wards for drug/alcohol abuse | 25 (0%) | 0 (0%) |
| Hospitals/wards and hospices for chronically ill | 14 (0%) | 150 (0%) |
| Hospitals/wards, hospices, and schools for the handicapped | 0 (0%) | 0 (0%) |
| Institutions for the blind | 0 (0%) | 0 (0%) |
| Institutions for the deaf | 0 (0%) | 0 (0%) |
| Job corps and vocational training facilities | 6 (0%) | 0 (0%) |
| Juvenile institutions | 0 (0%) | 0 (0%) |
| Local jails and other confinement facilities (including police lockups) | 593 (0.2%) | 1,516 (0.3%) |
| Long-term care | 0 (0%) | 0 (0%) |
| Mental (psychiatric) hospitals or wards | 497 (0.2%) | 393 (0.1%) |
| Military hospitals or wards for chronically ill | 0 (0%) | 0 (0%) |
| Military transient quarters for temporary residents | 0 (0%) | 0 (0%) |
| Military barracks, etc. | 0 (0%) | 0 (0%) |
| Military disciplinary barracks | 0 (0%) | 0 (0%) |
| Military quarters | 0 (0%) | 0 (0%) |
| Military ships | 0 (0%) | 0 (0%) |
| Noninstitutionalized settings | 0 (0%) | 0 (0%) |
| Nursing homes | 1,116 (0.4%) | 2,428 (0.4%) |
| On base quarters | 0 (0%) | 0 (0%) |
| Orthopedic wards and institutions for the physically handicapped | 0 (0%) | 0 (0%) |
| Other group homes | 247 (0.1%) | 156 (0%) |
| Other hospitals or wards for chronically ill | 10 (0%) | 150 (0%) |
| Other nonhousehold living situations | 108 (0%) | 79 (0%) |
| Other noninstitutional group quarters | 1,183 (0.4%) | 1,393 (0.3%) |
| Other types of correctional institutions | 0 (0%) | 186 (0%) |
| Other workers' dormitories | 0 (0%) | 0 (0%) |
| Religious group quarters | 0 (0%) | 8 (0%) |
| Residential treatment centers for emotionally disturbed children | 0 (0%) | 13 (0%) |
| Schools, hospitals, or wards for the physically handicapped | 0 (0%) | 0 (0%) |
| Short-term care, detention or diagnostic centers for delinquent children | 24 (0%) | 0 (0%) |
| State prisons | 2,611 (0.9%) | 249 (0%) |
| Training schools for juvenile delinquents | 0 (0%) | 0 (0%) |
| Unknown juvenile institutions | 52 (0%) | 4 (0%) |
| Wards in general hospitals for patients who have no usual home elsewhere | 0 (0%) | 0 (0%) |
| Wards in military hospitals for patients who have no usual home elsewhere | 0 (0%) | 0 (0%) |
| English speakers (speaking English at home) | ||
| Type | Raleigh | Charlotte |
|---|---|---|
| Born in the United States residents | 94% |
93.3% |
| Foreign born residents | 17.3% |
16.8% |
| Native, born elsewhere residents | 55.3% |
57.7% |
| Total residents | 82.1% |
77.8% |
| Infrastructure | ||
| Type | Raleigh | Charlotte |
|---|---|---|
| Hospitals | 19 |
37 |
| TV stations | 20 |
16 |
| Arenas or stadiums | 3 |
3 |
| Bank branches located here | 136 |
202 |
| Bank institutions located here | 27 |
26 |
| Main business address for public companies | 21 |
33 |
| Nuclear power plants nearby | 1 |
2 |
| Drinking water stations with no reported violations in the past | 2 |
24 |
| Drinking water stations with reported violations in the past | 55 |
40 |
| School facilities | ||
| Type | Raleigh | Charlotte |
|---|---|---|
| Private elementary/middle schools | 15 |
19 |
| Private high schools | 20 |
31 |
| Public elementary/middle schools | 75 |
120 |
| Public high schools | 21 |
35 |
| Colleges/Universities | 13 |
25 |
| National Bridge Inventory | ||
| Type | Raleigh | Charlotte |
|---|---|---|
| Number of bridges | 603 |
1,090 |
| Total average daily traffic | 17,374,045 |
32,882,618 |
| Total average daily truck traffic | 2,361,943 |
4,671,732 |
| Length of all bridges | 6,847 feet | 10,591 feet |
| Government finances - Expenditure (per resident) | ||
| Type | Raleigh | Charlotte |
|---|---|---|
| Current operations police protection | $202,743,000 ($432.17) | $0 ($0) |
| Current operations parks and recreation | $97,883,000 ($208.65) | $0 ($0) |
| Current operations regular highways | $61,151,000 ($130.35) | $0 ($0) |
| Current operations financial administration | $9,711,000 ($20.70) | $10,000 ($0.01) |
| Current operations housing and community development | $18,541,000 ($39.52) | $0 ($0) |
| Current operations judicial and legal services | $18,006,000 ($38.38) | $0 ($0) |
| Current operations central staff services | $13,285,000 ($28.32) | $0 ($0) |
| Current operations sewerage | $36,228,000 ($77.23) | $0 ($0) |
| Current operations solid waste management | $49,810,000 ($106.18) | $0 ($0) |
| Current operations general other | $12,926,000 ($27.55) | $4,000 ($0.01) |
| General interest on debt | $37,776,000 ($80.53) | $0 ($0) |
| Other capital outlay general other | $2,476,000 ($5.28) | $0 ($0) |
| Total salaries and wages | $375,426,000 ($800.27) | $0 ($0) |
| Government finances - Revenue (per resident) | ||
| Type | Raleigh | Charlotte |
|---|---|---|
| Charges parks and recreation | $22,908,000 ($48.83) | $0 ($0) |
| Charges sewerage | 104,680,000 (223.14) | 0 (0) |
| Charges solid waste management | $61,532,000 ($131.16) | $0 ($0) |
| Miscellaneous interest earnings | $56,578,000 ($120.60) | $0 ($0) |
| Miscellaneous rents | $3,050,000 ($6.50) | $0 ($0) |
| State intergovernmental highways | $6,072,000 ($12.94) | $5,000 ($0.01) |
| Tax property | $126,497,000 ($269.65) | $0 ($0) |
| Government finances - Cash and securities (per resident) | ||
| Type | Raleigh | Charlotte |
|---|---|---|
| Sinking funds cash and securities | $456,780,000 ($973.69) | $0 ($0) |
| Taxpayer migration | ||
| Type | Raleigh | Charlotte |
|---|---|---|
| Moved from other counties | 38,381 (8.7%) | 39,447 (9.1%) |
| Moved from other counties - average AGI | $80,396 |
$78,641 |
| Moved to other counties | 34,531 (7.9%) | 39,103 (9%) |
| Moved to other counties - average AGI | $77,244 |
$81,691 |
| Moved from foreign countries | 104 (0%) | 45 (0%) |
| Moved from foreign countries - average AGI | $149.03 |
$73.14 |
| Moved to foreign countries | 84 (0%) | 90 (0%) |
| Moved to foreign countries - average AGI | $156.38 |
$114.67 |