Pitting Albuquerque, New Mexico, against Northeast Jefferson, Colorado, reveals a multi-dimensional comparison of two cities with diverse geographical, demographic, and socio-economic capabilities. While Albuquerque is a sun-drenched city with a strong cultural heritage, Northeast Jefferson is a harmonic suburban blend of comfort and tranquility. Each city offers features that might suit potential residents or tourists based on individual preferences for crime and safety, weather, cost of living, education, and other aspects.
According to national crime statistics, Albuquerque has a higher crime rate compared to Northeast Jefferson. Albuquerque faces challenges with property and violent crimes. On the other hand, Northeast Jefferson, while not entirely crime-free, maintains a overall lower crime rate. This makes Northeast Jefferson more appealing to those concerned about safety.
Cost of Living
Living in Albuquerque costs less than Northeast Jefferson. Housing, groceries, health care, utilities, and transportation are all more affordable in Albuquerque, making it an attractive city for potential residents looking for lower living expenses.
Income Tax
New Mexico imposes a maximum state income tax rate of 5.90%, while Colorado adopts a flat income tax rate of 4.63%. Comparatively, residents in Northeast Jefferson might take home slightly more income after tax.
Property Tax
Albuquerque homeowners face a property tax rate of about 0.78% of assessed home value. Northeast Jefferson's property tax rates are around 0.52% of home value. Homeowners in Northeast Jefferson might therefore benefit from lower property tax burdens.
Sales Tax
Sales tax in Albuquerque is 7.88%, while Northeast Jefferson has a sales tax rate of 7.50%. Both rates are higher than the national average but the differences are small.
Income
Type
Albuquerque
Northeast Jefferson
Estimated median household income
$58,512
$91,025
Estimated per capita income
$35,738
$46,835
Cost of living index (U.S. average is 100)
93.6
119.7
If you make $50,000 in Albuquerque, you will have to make $63,942 in Northeast Jefferson to maintain the same standard of living.
Geographical Conditions
Albuquerque is nestled in the high desert and borders the Sandia Mountains, while Northeast Jefferson is at the foothills of the Rocky Mountains. Both display distinct and picturesque landscapes that offer ample recreational opportunities.
Geographical information
Type
Albuquerque
Northeast Jefferson
Land area
180.6 sq. miles
172.8 sq. miles
Population density
3,114.4 people per sq. mile
2,615.1 people per sq. mile
Relative area comparison
Albuquerque, NM Northeast Jefferson, CO
Education
Both cities take pride in their education systems. Albuquerque is home to the University of New Mexico and Central New Mexico Community College, alongside quality public schools. In Northeast Jefferson, the Jefferson County Public School District offers exemplary education, making both cities attractive for families with children.
Albuquerque's economy is diversified and robust, with sectors like healthcare, education, and tourism generating jobs. Conversely, Northeast Jefferson's economy is also varied, with focus areas including technology, aerospace, and manufacturing. Unemployment rates are relatively low in both cities, signaling a healthy job market.
Biggest Employers
Albuquerque's largest employers are Sandia National Laboratories, University of New Mexico, and Lovelace Health System. In Northeast Jefferson, the top employers are Lockheed Martin Corporation, Jefferson County Public Schools, and Terumo BCT.
In Albuquerque (Bernalillo County), 55.8% voted for Democrats and 39.4% for Republicans in 2012 Presidential Election. In Northeast Jefferson (Jefferson County), 51.6% voted for Democrats and 46.7% for Republicans.
Elections
Type
Democrats
Republicans
Other
Year
Albuquerque
Northeast Jefferson
Albuquerque
Northeast Jefferson
Albuquerque
Northeast Jefferson
2020
61.3%
58.3%
36.7%
39.7%
2.0%
2.0%
2016
52.4%
49.2%
34.6%
42.3%
13.0%
8.6%
2012
55.8%
51.6%
39.4%
46.7%
4.9%
1.8%
2008
60.2%
54.0%
38.8%
44.9%
1.0%
1.1%
2004
51.6%
46.9%
47.4%
52.1%
0.9%
1.0%
2000
48.8%
43.0%
46.8%
51.1%
4.4%
5.9%
1996
48.3%
42.7%
43.2%
48.4%
8.5%
8.9%
Breakdown of population affiliated with a religious congregation
Type
Adherents
Congregations
Religion
Albuquerque
Northeast Jefferson
Albuquerque
Northeast Jefferson
CATHOLIC CHURCH
26.5%
15.0%
10.7%
5.1%
SOUTHERN BAPTIST CONVENTION
2.6%
1.2%
11.4%
7.5%
EPISCOPAL CHURCH
0.7%
0.5%
1.9%
2.7%
CUMBERLAND PRESBYTERIAN CHURCH
0.4%
0.0%
0.2%
0.0%
EVANGELICAL LUTHERAN CHURCH IN AMERICA
0.4%
1.7%
1.9%
4.2%
SEVENTH DAY ADVENTIST CHURCH
0.4%
0.4%
1.9%
2.1%
LUTHERAN CHURCH
0.3%
1.1%
1.7%
3.3%
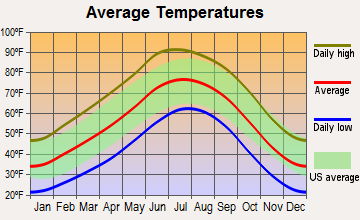
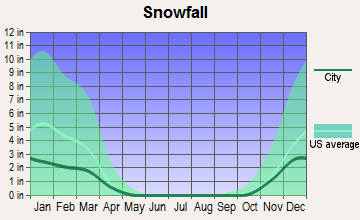
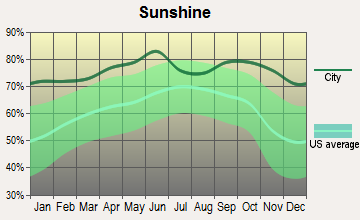
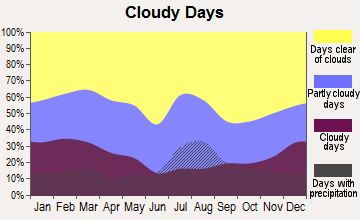
Weather
Albuquerque enjoys 280+ days of sunshine per year, coupled with a dry desert heat during summer and mild winters. Northeast Jefferson, located in the Rocky Mountains' foothills, experiences distinct four seasons with snowy winters and mild, sunny summers. Tourists and residents alike must consider climate preferences when comparing both locations.
Weather and climate
Type
Albuquerque
Northeast Jefferson
Temperature - Average
55.6°F
47.9°F
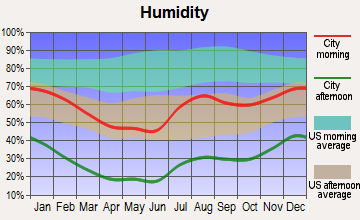
Humidity - Average morning or afternoon humidity
44.3%
50.6%
Humidity - Differences between morning and afternoon humidity
46%
20%
Humidity - Maximum monthly morning or afternoon humidity
63%
55%
Humidity - Minimum monthly morning or afternoon humidity
17%
35%
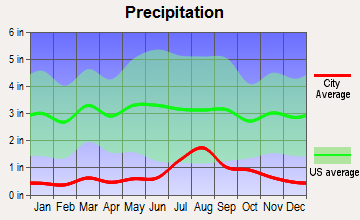
Precipitation - Yearly average
9.4 in
17.2 in
Snowfall - Yearly average
19.2 in
114 in
Clouds - Number of days clear of clouds
27.8%
19.2%
Sunshine amount - Average
82.7%
75.6%
Sunshine amount - Differences during a year
9%
10%
Sunshine amount - Maximum monthly
82%
74%
Sunshine amount - Minimum monthly
73%
64%
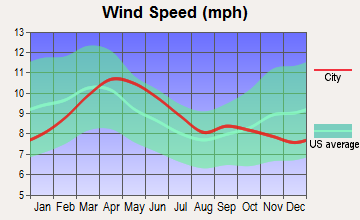
Wind speed - Average
8.9 mph
8.6 mph
Average climate in Albuquerque, New Mexico
Average climate in Northeast Jefferson, Colorado
Air pollution
Type
AQI
CO
NO2
OZONE
PB
PM10
PM25
SO2
Year
Albuquerque
Northeast Jefferson
Albuquerque
Northeast Jefferson
Albuquerque
Northeast Jefferson
Albuquerque
Northeast Jefferson
Albuquerque
Northeast Jefferson
Albuquerque
Northeast Jefferson
Albuquerque
Northeast Jefferson
Albuquerque
Northeast Jefferson
2018
95
104
0.23
0.40
10.3
22.3
35.3
34.9
N/A
N/A
20.3
29.2
4.3
8.4
0.5
0.7
2017
82
97
0.24
0.40
10.4
22.5
33.5
34.5
N/A
N/A
18.4
22.0
5.7
8.2
0.4
0.8
2016
86
90
0.22
0.44
10.4
24.4
33.2
34.3
N/A
N/A
16.0
22.6
5.3
7.8
0.8
1.0
2015
84
101
0.23
0.45
11.2
24.1
30.8
32.8
N/A
N/A
16.0
21.0
6.1
9.5
0.7
1.0
2014
89
94
0.22
0.45
11.7
23.4
31.8
33.1
N/A
N/A
22.0
25.0
6.1
10.1
0.6
1.3
2013
91
84
0.22
0.40
11.8
21.0
34.1
33.6
N/A
N/A
21.8
24.3
5.7
N/A
0.8
1.5
2012
116
91
0.18
0.34
13.7
18.9
33.6
33.4
N/A
N/A
26.6
24.4
9.3
N/A
0.7
1.3
2011
130
90
0.21
0.34
13.5
18.1
34.0
32.0
N/A
N/A
28.6
23.8
9.9
N/A
0.4
1.5
2010
92
79
0.15
0.42
12.2
16.3
32.1
29.2
N/A
N/A
25.1
26.5
6.8
N/A
N/A
1.0
2009
81
76
0.16
0.38
12.5
14.1
30.4
27.9
N/A
0.005
26.2
22.5
6.9
N/A
N/A
1.3
2008
91
85
0.21
0.42
11.8
17.3
31.5
30.8
N/A
0.008
20.8
25.5
6.5
N/A
N/A
1.6
2007
112
96
0.29
0.39
13.0
20.6
31.4
29.0
N/A
0.007
19.7
29.1
6.7
N/A
N/A
1.2
2006
103
89
0.33
0.46
14.2
19.0
31.8
29.5
N/A
0.027
21.1
28.0
N/A
N/A
N/A
1.4
2005
85
86
0.32
0.51
13.9
21.3
29.7
26.0
N/A
0.119
20.0
29.6
N/A
N/A
N/A
1.5
2004
89
82
0.32
0.53
16.6
21.2
29.8
24.2
0.003
0.043
21.5
28.6
N/A
N/A
N/A
1.8
2003
115
106
0.37
0.52
17.6
21.2
31.9
25.9
0.004
0.046
25.1
32.6
N/A
N/A
N/A
1.9
2002
91
86
0.43
0.60
18.9
19.2
29.1
25.6
0.005
0.031
23.1
35.7
N/A
N/A
N/A
2.4
2001
81
95
0.67
0.69
17.2
20.8
29.4
23.7
N/A
0.034
20.9
32.6
N/A
N/A
N/A
2.6
2000
95
94
0.81
0.70
17.0
11.7
27.9
24.5
N/A
0.037
17.7
12.2
N/A
N/A
N/A
2.1
Natural disasters
Type
Albuquerque
Northeast Jefferson
Tornado activity compared to U.S. average
6.4%
118.6%
Earthquake activity compared to U.S. average
802.6%
826.6%
Natural disasters compared to U.S. average
9%
12%
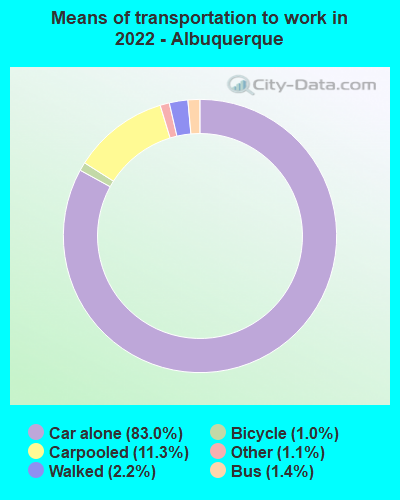
Transportation
Albuquerque's transportation network includes buses, an inter-city rail service, bike lanes, and extensive roadways. In contrast, Northeast Jefferson relies mostly on car travel with some public transportation options. Both cities are within close proximity to major international airports.
Transport
Type
Albuquerque
Northeast Jefferson
Amtrak stations
1
0
Amtrak stations nearby
1
1
FAA registered aircraft
1
0
FAA registered aircraft manufacturers and dealers
17
0
Means of transportation to work
Type
Albuquerque
Northeast Jefferson
Bicycle
0.9%
0.3%
Bus
0.8%
3.2%
Carpooled
9.6%
10%
Car alone
85.1%
80.3%
Motorcycle
0.2%
0.1%
Walked
2.3%
1.1%
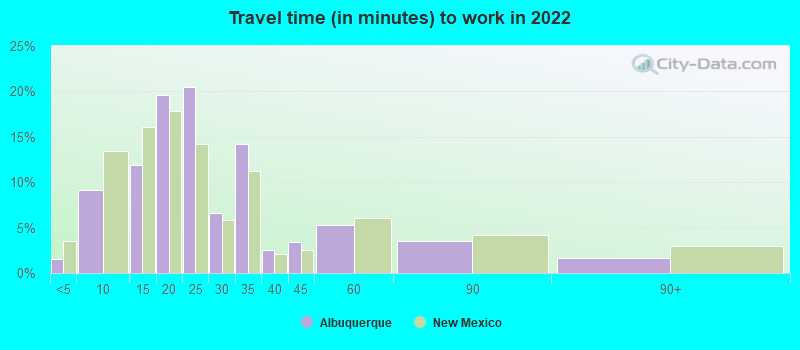
Average travel time to work
Type
Albuquerque
Northeast Jefferson
Average
24.5 min
26.6 min
Real Estate
Real estate in Albuquerque tends to be more affordable than in Northeast Jefferson largely due to higher demand and limited supply in Northeast Jefferson. Moreover, Albuquerque offers a broader range of housing options suitable for different lifestyles and budgets.
Neighborhoods
Albuquerque boasts historic neighborhoods like Old Town and contemporary areas such as Nob Hill. Northeast Jefferson has upscale neighborhoods like Genesee and Applewood. Each city offers a mix of residential options that cater to diverse lifestyle preferences.
Houses and residents
Type
Albuquerque
Northeast Jefferson
Houses
256,814
180,978
Average household size (people)
2.4
2.4
Houses occupied
243,582 (94.8%)
176,726 (97.7%)
Houses occupied by owners
147,964 (60.7%)
125,208 (70.8%)
Houses occupied by renters
95,618 (39.3%)
51,518 (29.2%)
Median rent asked for vacant for-rent units
$893.82
$1,659
Median price asked for vacant for-sale houses and condos
$171,149
$884,573
Estimated median house or condo value
$251,500
$522,903
Median number of rooms in apartments
3.9
4
Median number of rooms in houses and condos
6.2
7.3
Renting percentage
39.7%
31.3%
Housing density (houses/condos per square mile)
1,421.7
1,047.5
Household income disparities
45.9%
40.7%
Housing units without a mortgage
1,631 (1.6%)
21,689 (19.3%)
Housing units with both a second mortgage and home equity loan
3,560 (3.6%)
469 (0.4%)
Housing units with a mortgage
97,744 (98.4%)
90,716 (80.7%)
Housing units with a home equity loan
309 (0.3%)
9,124 (8.1%)
Housing units with a second mortgage
6,864 (6.9%)
16,287 (14.5%)
Housing units lacking complete kitchen facilities
1.1%
0.6%
Housing units lacking complete plumbing facilities
Self-employed workers in own not incorporated business
14,060
15,916
State government workers
20,531
7,028
Unpaid family workers
359
382
Industries and Occupations
In Albuquerque, the top industries include healthcare, education, and tourism. For Northeast Jefferson, the major industries are technology, aerospace, and manufacturing. Potential residents could find diverse job opportunities in both cities depending on their skills and qualifications.
Quality healthcare is accessible in both cities. Albuquerque's healthcare system is led by prominent institutions like the University of New Mexico Hospital. Northeast Jefferson residents can access multiple healthcare providers, including the esteemed Lutheran Medical Center in nearby Wheat Ridge.
Health (county statistics)
Type
Albuquerque
Northeast Jefferson
General health status score of residents in this county from 1 (poor) to 5 (excellent)
Albuquerque offers standard urban infrastructure including roads, rail, and air travel. Northeast Jefferson, while a suburb, also has a well-developed infrastructure with convenient access to Denver's metropolitan amenities. Both cities have modern healthcare facilities and reliable utility services.
Infrastructure
Type
Albuquerque
Northeast Jefferson
TV stations
18
19
Culture and Food
Albuquerque is a mosaic of Native American, Hispanic, and Anglo cultures which reflects in the local cuisine and festivals. Northeast Jefferson offers a vibrant mix of suburban culture, with accessibility to Denver's cosmopolitan offerings. Both cities promise a diverse cultural scene.
Sports Teams
Albuquerque has minor league baseball, indoor football, and soccer teams. Northeast Jefferson, though lacking its own major sports teams, benefits from Denver's proximity, offering access to major league sports like basketball, football, hockey, and baseball.
 Albuquerque, NM
 Northeast Jefferson, CO