Albuquerque, New Mexico and Northeast Tarrant, Texas, are two unique regions with distinctive characteristics. Albuquerque, known for its rich cultural heritage, annual International Balloon Fiesta, and stunning desert landscape, offers a relatively low cost of living. Northeast Tarrant, a well-established suburban area within the Dallas-Fort Worth Metroplex, offers strong economic growth, excellent educational facilities, and a strong labor market.
When it comes to crime rates, both Albuquerque and Northeast Tarrant have some safety issues. Albuquerque has higher crime rates compared to the national average, with property crimes being particularly prevalent. However, the city has been actively working to address these issues by increasing police presence in key areas. Northeast Tarrant, while generally safer than Albuquerque, does have some variability in crime rates depending on the particular city or neighborhood in the area. Both areas offer community safety initiatives, but residents and tourists alike should stay informed about local safety advisories.
Cost of Living
In terms of cost of living, Albuquerque is generally less expensive than Northeast Tarrant, which reflects the higher incomes and strong economic growth in the Texas region. The cost of basic groceries, housing, and services tend to be higher in Northeast Tarrant, while Albuquerque offers more affordable options.
Income Tax
Regarding income tax, Texas does not impose a state income tax, providing residents of Northeast Tarrant with significant savings. New Mexico, however, does have a state income tax, which could be impactful for Albuquerque residents depending on their earnings and tax situation.
Property Tax
Northeast Tarrant residents typically pay a higher property tax compared to Albuquerque residents. These rates vary depending on the specific city within Northeast Tarrant.
Sales Tax
The state sales tax rates for Texas and New Mexico are remarkably similar. However, Albuquerque's total sales tax rate is slightly higher due to additional city sales taxes. Northeast Tarrant residents may also pay additional sales tax depending on the specific city they live in.
Income
Type
Albuquerque
Northeast Tarrant
Estimated median household income
$58,512
$90,881
Estimated per capita income
$35,738
$45,353
Cost of living index (U.S. average is 100)
93.6
102
If you make $50,000 in Albuquerque, you will have to make $54,487 in Northeast Tarrant to maintain the same standard of living.
Geographical Conditions
Geographically, Albuquerque is uniquely located in the high desert, with stunning mountain and river views. Northeast Tarrant, meanwhile, is located in the North Central Texas plains, offering a mix of urban and suburban landscapes.
Geographical information
Type
Albuquerque
Northeast Tarrant
Land area
180.6 sq. miles
206.9 sq. miles
Population density
3,114.4 people per sq. mile
2,284.3 people per sq. mile
Relative area comparison
Albuquerque, NM Northeast Tarrant, TX
Education
Education in Northeast Tarrant is highly rated with a plethora of both public and private school options. The region is home to several well-regarded school districts. On the other hand, Albuquerque has struggled with educational performance in recent years, although it does host the University of New Mexico, a leading research institution offering various undergraduate and postgraduate degrees.
The economies of both regions differ significantly. Albuquerque has a mixed economy including healthcare, education, retail, and base military sectors. In contrast, Northeast Tarrant benefits strongly from Dallas-Fort Worth's economic hubs featuring industries like technology, finance, and aviation.
Biggest Employers
The biggest employers in Albuquerque include the University of New Mexico, Sandia National Laboratories, and Kirtland Air Force Base. Northeast Tarrant's largest employers span various industries, such as American Airlines, Bank of America, and the Texas Health Resources.
In Albuquerque (Bernalillo County), 55.8% voted for Democrats and 39.4% for Republicans in 2012 Presidential Election. In Northeast Tarrant (Tarrant County), 41.4% voted for Democrats and 57.1% for Republicans.
Elections
Type
Democrats
Republicans
Other
Year
Albuquerque
Northeast Tarrant
Albuquerque
Northeast Tarrant
Albuquerque
Northeast Tarrant
2020
61.3%
49.3%
36.7%
49.1%
2.0%
1.6%
2016
52.4%
43.2%
34.6%
51.8%
13.0%
5.0%
2012
55.8%
41.4%
39.4%
57.1%
4.9%
1.4%
2008
60.2%
43.8%
38.8%
55.5%
1.0%
0.7%
2004
51.6%
37.0%
47.4%
62.5%
0.9%
0.5%
2000
48.8%
36.9%
46.8%
60.9%
4.4%
2.3%
1996
48.3%
41.6%
43.2%
50.9%
8.5%
7.5%
Breakdown of population affiliated with a religious congregation
Type
Adherents
Congregations
Religion
Albuquerque
Northeast Tarrant
Albuquerque
Northeast Tarrant
CATHOLIC CHURCH
26.5%
11.1%
10.7%
1.9%
SOUTHERN BAPTIST CONVENTION
2.6%
17.3%
11.4%
33.3%
EPISCOPAL CHURCH
0.7%
0.3%
1.9%
0.8%
CUMBERLAND PRESBYTERIAN CHURCH
0.4%
0.0%
0.2%
0.3%
EVANGELICAL LUTHERAN CHURCH IN AMERICA
0.4%
0.3%
1.9%
0.9%
SEVENTH DAY ADVENTIST CHURCH
0.4%
0.4%
1.9%
1.6%
LUTHERAN CHURCH
0.3%
0.5%
1.7%
0.9%
MUSLIM ESTIMATE
0.3%
2.2%
0.5%
0.9%
Weather
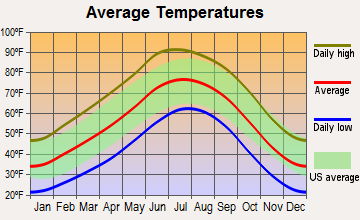
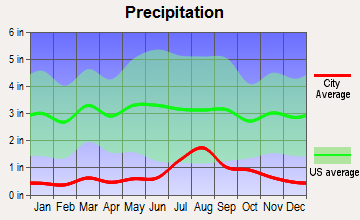
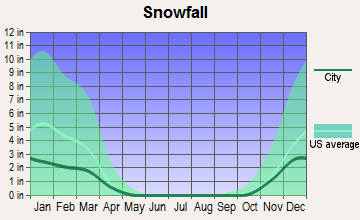
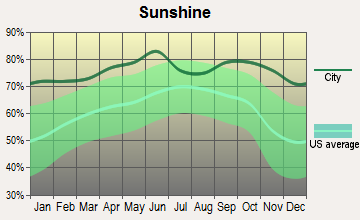
Weather-wise, Albuquerque touts more than 310 days of sunshine annually, making it an ideal destination for outdoor enthusiasts. However, it also experiences a dramatic range of temperatures due to its high desert location, with hot summers and cold winters. In contrast, Northeast Tarrant, Texas enjoys a milder climate with hot, humid summers, and mild to cool winters. It also experiences more rainfall compared to Albuquerque.
Weather and climate
Type
Albuquerque
Northeast Tarrant
Temperature - Average
55.6°F
64.6°F
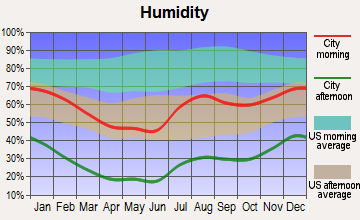
Humidity - Average morning or afternoon humidity
44.3%
71.3%
Humidity - Differences between morning and afternoon humidity
46%
34%
Humidity - Maximum monthly morning or afternoon humidity
63%
82%
Humidity - Minimum monthly morning or afternoon humidity
17%
48%
Precipitation - Yearly average
9.4 in
37.2 in
Snowfall - Yearly average
19.2 in
4.2 in
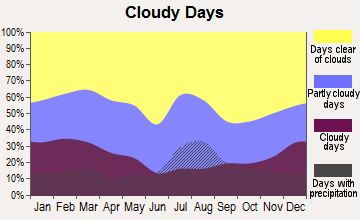
Clouds - Number of days clear of clouds
27.8%
22.8%
Sunshine amount - Average
82.7%
66.6%
Sunshine amount - Differences during a year
9%
20%
Sunshine amount - Maximum monthly
82%
74%
Sunshine amount - Minimum monthly
73%
54%
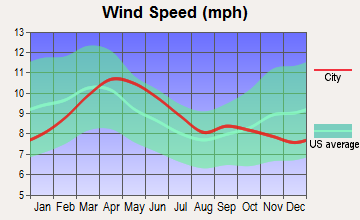
Wind speed - Average
8.9 mph
10.3 mph
Average climate in Albuquerque, New Mexico
Average climate in Northeast Tarrant, Texas
Air pollution
Type
AQI
CO
NO2
OZONE
PB
PM10
PM25
SO2
Year
Albuquerque
Northeast Tarrant
Albuquerque
Northeast Tarrant
Albuquerque
Northeast Tarrant
Albuquerque
Northeast Tarrant
Albuquerque
Albuquerque
Albuquerque
Northeast Tarrant
Albuquerque
Northeast Tarrant
2018
95
86
0.23
N/A
10.3
5.8
35.3
27.9
N/A
N/A
20.3
N/A
4.3
9.2
0.5
0.4
2017
82
84
0.24
N/A
10.4
5.9
33.5
28.0
N/A
N/A
18.4
N/A
5.7
8.6
0.4
0.3
2016
86
75
0.22
N/A
10.4
6.2
33.2
26.4
N/A
N/A
16.0
N/A
5.3
8.2
0.8
0.2
2015
84
81
0.23
N/A
11.2
6.5
30.8
25.7
N/A
N/A
16.0
N/A
6.1
8.5
0.7
0.3
2014
89
77
0.22
0.22
11.7
6.6
31.8
27.1
N/A
N/A
22.0
N/A
6.1
9.4
0.6
0.3
2013
91
95
0.22
0.25
11.8
6.8
34.1
28.0
N/A
N/A
21.8
N/A
5.7
11.3
0.8
0.2
2012
116
108
0.18
0.26
13.7
8.1
33.6
30.7
N/A
N/A
26.6
N/A
9.3
10.8
0.7
0.3
2011
130
98
0.21
0.23
13.5
8.0
34.0
30.8
N/A
N/A
28.6
N/A
9.9
10.2
0.4
0.6
2010
92
76
0.15
0.23
12.2
8.7
32.1
28.0
N/A
N/A
25.1
N/A
6.8
8.5
N/A
0.7
2009
81
93
0.16
0.25
12.5
8.9
30.4
29.1
N/A
N/A
26.2
N/A
6.9
8.7
N/A
0.5
2008
91
89
0.21
0.25
11.8
9.7
31.5
27.5
N/A
N/A
20.8
N/A
6.5
9.4
N/A
0.5
2007
112
91
0.29
0.30
13.0
10.8
31.4
25.1
N/A
N/A
19.7
N/A
6.7
9.7
N/A
0.3
2006
103
99
0.33
0.34
14.2
10.6
31.8
30.2
N/A
N/A
21.1
N/A
N/A
9.5
N/A
0.7
2005
85
109
0.32
0.34
13.9
12.3
29.7
29.1
N/A
N/A
20.0
N/A
N/A
10.7
N/A
0.9
2004
89
90
0.32
0.39
16.6
11.6
29.8
25.7
0.003
N/A
21.5
N/A
N/A
N/A
N/A
0.8
2003
115
97
0.37
0.40
17.6
12.3
31.9
27.2
0.004
N/A
25.1
N/A
N/A
N/A
N/A
1.0
2002
91
97
0.43
0.37
18.9
13.0
29.1
25.4
0.005
N/A
23.1
N/A
N/A
N/A
N/A
0.4
2001
81
88
0.67
0.48
17.2
14.3
29.4
26.0
N/A
N/A
20.9
N/A
N/A
N/A
N/A
1.0
2000
95
104
0.81
0.55
17.0
14.5
27.9
27.1
N/A
N/A
17.7
N/A
N/A
N/A
N/A
1.1
Natural disasters
Type
Albuquerque
Northeast Tarrant
Tornado activity compared to U.S. average
6.4%
252.8%
Earthquake activity compared to U.S. average
802.6%
578.9%
Natural disasters compared to U.S. average
9%
23%
Transportation
In terms of getting around, Northeast Tarrant offers extensive road networks, and plenty of commuter and public transportation options through the Dallas-Fort Worth Metroplex. Albuquerque's public transit system is less extensive, but improving, with services like buses and the New Mexico Rail Runner commuter train.
Transport
Type
Albuquerque
Northeast Tarrant
Amtrak stations
1
0
Amtrak stations nearby
1
1
FAA registered aircraft
1
0
FAA registered aircraft manufacturers and dealers
17
0
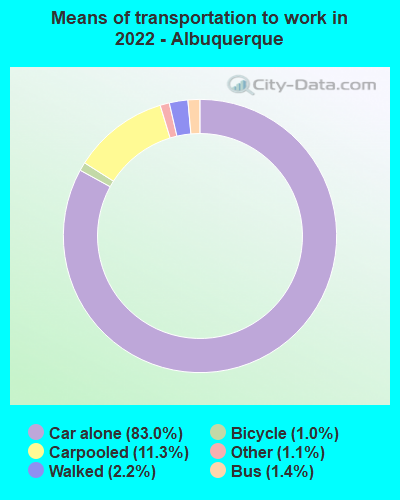
Means of transportation to work
Type
Albuquerque
Northeast Tarrant
Bicycle
0.9%
0.2%
Bus
0.8%
0%
Carpooled
9.6%
9.8%
Car alone
85.1%
84.8%
Motorcycle
0.2%
0.1%
Walked
2.3%
0.9%
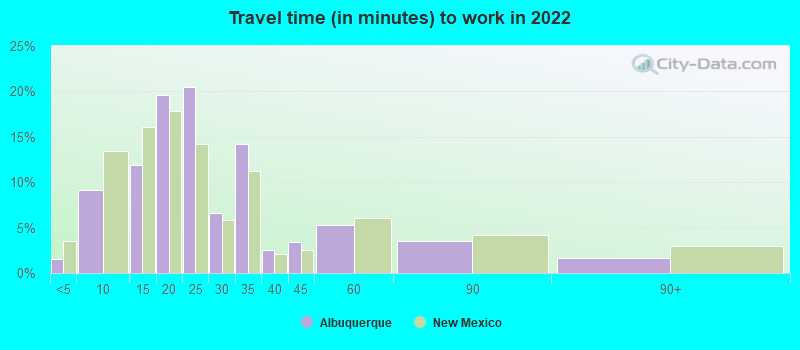
Average travel time to work
Type
Albuquerque
Northeast Tarrant
Average
24.5 min
26.8 min
Real Estate
Real estate tends to be more expensive in Northeast Tarrant compared to Albuquerque. The housing market in Northeast Tarrant has been heating up, with many buyers attracted to the region's strong economic prospects and quality of life. Meanwhile, Albuquerque offers more affordable options, although it also has been experiencing a surge in demand lately.
Neighborhoods
Albuquerque neighborhoods range from historic districts like the Old Town to the modern, residential suburbs in the Northeast Heights. Northeast Tarrant is a collection of cities and neighborhoods, with many upscale residential communities like Southlake and Colleyville.
Houses and residents
Type
Albuquerque
Northeast Tarrant
Houses
256,814
155,788
Average household size (people)
2.4
2.7
Houses occupied
243,582 (94.8%)
149,489 (96%)
Houses occupied by owners
147,964 (60.7%)
101,491 (67.9%)
Houses occupied by renters
95,618 (39.3%)
47,998 (32.1%)
Median rent asked for vacant for-rent units
$893.82
$1,297
Median price asked for vacant for-sale houses and condos
$171,149
$288,870
Estimated median house or condo value
$251,500
$337,949
Median number of rooms in apartments
3.9
4.1
Median number of rooms in houses and condos
6.2
6.5
Renting percentage
39.7%
32.5%
Housing density (houses/condos per square mile)
1,421.7
752.8
Household income disparities
45.9%
38.7%
Housing units without a mortgage
1,631 (1.6%)
18,262 (19.1%)
Housing units with both a second mortgage and home equity loan
3,560 (3.6%)
88 (0.1%)
Housing units with a mortgage
97,744 (98.4%)
77,313 (80.9%)
Housing units with a home equity loan
309 (0.3%)
4,029 (4.2%)
Housing units with a second mortgage
6,864 (6.9%)
5,649 (5.9%)
Housing units lacking complete kitchen facilities
1.1%
0.4%
Housing units lacking complete plumbing facilities
Self-employed workers in own not incorporated business
14,060
11,886
State government workers
20,531
4,379
Unpaid family workers
359
466
Industries and Occupations
Albuquerque's primary industries are education, healthcare, and retail, along with professional scientific and technical services. Northeast Tarrant, on the other hand, has a more dynamic labor market, with a large number of residents working in specialized industries such as aviation, finance, and technology.
When it comes to healthcare, both regions have strong medical facilities. Albuquerque is home to the University of New Mexico Hospital and the Presbyterian Hospital system. Northeast Tarrant County has access to Dallas-Fort Worth's multitude of hospitals and health centers, including the highly-rated Baylor Scott & White Health facilities.
Health (county statistics)
Type
Albuquerque
Northeast Tarrant
General health status score of residents in this county from 1 (poor) to 5 (excellent)
Infrastructure-wise, Northeast Tarrant boasts well-maintained road networks connecting the major Texas cities. Albuquerque’s infrastructure is less extensive, but the city is easy to navigate and has been investing in improvements, particularly for its public transit system.
Infrastructure
Type
Albuquerque
Northeast Tarrant
TV stations
18
25
Culture and Food
Culturally, Albuquerque is a blending of native American, Hispanic and Anglo influences, resulting in rich art, music, and food scenes. Its southwestern cuisine, featuring local ingredients like green chile, is a must-try. Northeast Tarrant, nested in the Dallas-Fort Worth Metroplex, offers a mix of Texan culture and cuisine plus international flavors due to its rapidly diversifying population.
Sports Teams
For sports enthusiasts, Northeast Tarrant offers close proximity to the Dallas–Fort Worth professional sports teams. Albuquerque, while it doesn't have any professional teams, offers various college sports, minor league baseball, and is known for balloon sports, hosting the annual International Balloon Fiesta.
 Albuquerque, NM
 Northeast Tarrant, TX