Albuquerque, NM vs Sacramento, CA - Advanced U.S. city comparison tool

Albuquerque, NM vs Sacramento, CA

If you're thinking about relocating or even visiting, it's essential to compare your options. In this comparison between Albuquerque, NM, and Sacramento, CA, we'll delve into multiple aspects including crime and safety, weather, education, and more. Both cities have their unique charms, pros, and cons, and this guide is aimed at offering you a detailed perspective on life in each city.
 
 
Distance between Albuquerque, NM and Sacramento, CA : 854.3 miles

Albuquerque's population is larger by 7%. Its population has grown by 113,992 people (25.4%) since 2000. The population of Sacramento has grown by 118,023 people (29.0%) during that time.

Population
Type Albuquerque Sacramento
Population 562,599 525,041
Female / male percentage 50.5% / 49.5%
50.5%
49.5%
51% / 49%
51%
49%
Racial makeup - percentage
Ethnicity AlbuquerqueSacramento
Hispanic 50.6% 29.3%
White Non-Hispanic 35.9% 30.4%
American Indian 3.9% 0.3%
Two or more 3.7% 6.9%
Asian 3.0% 19.3%
Black 2.7% 10.7%
Pacific Islander 0.0% 2.3%
Racial makeup - absolute values
Ethnicity AlbuquerqueSacramento
Hispanic 284,753 154,025
White Non-Hispanic 201,823 159,749
American Indian 21,783 1,329
Two or more 20,627 36,284
Asian 16,687 101,436
Black 14,917 55,966
Pacific Islander 0 11,875

Crime and Safety

Crime rate in Albuquerque, NM is notably higher than national average, with violent and property crime both spiking high. Safety is a concern, and it's vital to take precautions. Sacramento, CA, on the other hand, registers a lower crime rate compared to Albuquerque but it’s still above the national average. Neighborhoods in Sacramento are generally safer, but it varies from area to area.

Crime by year per 100,000 residents
Type City-data.com crime indexRobberies per 100,000Murders per 100,000Rapes per 100,000Assaults per 100,000Burglaries per 100,000Theft per 100,000Auto theft per 100,000Arson per 100,000
Year AlbuquerqueSacramentoAlbuquerqueSacramentoAlbuquerqueSacramentoAlbuquerqueSacramentoAlbuquerqueSacramentoAlbuquerqueSacramentoAlbuquerqueSacramentoAlbuquerqueSacramentoAlbuquerqueSacramento
2020 629.9 328.2 256.0 169.3 14.2 8.1 78.5 24.1 994.9 481.8 902.9 546.0 3,225.8 1,715.2 883.4 483.8 29.5 50.1
2019 677.9 338.3 307.0 202.2 14.4 6.6 88.8 24.7 949.8 393.6 1,010.8 582.4 3,688.8 2,071.1 971.1 528.7 17.8 34.8
2018 714.3 337.6 354.3 207.5 12.3 7.1 86.4 20.1 920.3 421.9 1,143.3 542.6 3,879.8 1,929.4 1,187.2 568.6 19.3 28.8
2017 785.8 339.6 521.9 220.0 12.5 7.8 84.3 19.8 750.5 428.0 1,246.2 577.6 4,750.8 1,815.4 1,368.8 543.6 15.7 41.8
2016 680.2 356.5 348.5 229.3 10.9 8.3 67.8 17.8 684.9 461.0 1,110.5 619.6 4,377.4 1,895.0 1,373.0 570.0 19.8 34.9
2015 592.5 381.5 301.2 239.7 7.7 8.8 72.2 21.4 584.8 467.4 1,071.2 758.2 4,076.7 2,014.4 925.3 596.9 15.9 28.6
2014 530.3 328.7 247.1 207.1 5.4 5.8 71.9 16.2 558.4 385.7 1,095.6 670.7 3,713.9 1,956.0 636.6 496.5 15.4 35.0
2013 512.4 378.9 187.4 242.2 6.6 7.1 78.7 19.9 502.2 386.9 1,307.3 812.7 3,624.2 2,349.1 538.4 598.3 14.9 34.3
2012 483.8 425.6 197.2 254.1 7.4 7.1 50.2 26.2 494.9 451.2 1,205.9 938.8 3,666.0 2,548.9 495.4 702.1 15.5 27.3
2011 467.4 409.4 180.8 246.2 6.9 7.6 47.8 28.4 527.2 428.4 1,084.3 877.4 3,472.7 2,349.1 511.4 706.6 24.1 30.9
2010 469.1 482.0 172.2 319.6 7.7 7.1 61.9 35.4 544.3 519.4 1,001.2 1,077.6 3,322.1 2,396.4 508.0 856.2 22.2 43.3
2009 511.8 492.2 207.9 341.5 10.6 6.4 61.4 38.1 489.4 499.7 1,201.6 1,091.8 3,649.4 2,492.0 640.6 881.6 18.5 35.7
2008 573.0 546.0 255.9 377.0 7.2 10.5 70.1 36.0 561.2 574.2 1,180.0 1,116.8 3,999.9 2,649.1 885.7 1,051.2 25.0 45.0
2007 578.9 608.8 280.4 436.2 9.2 9.6 59.8 42.1 640.6 625.6 1,095.6 1,177.3 3,631.1 2,801.9 982.0 1,318.7 17.5 61.0
2006 587.1 665.9 233.8 475.1 6.8 12.4 57.1 42.6 610.6 676.4 1,268.0 1,340.8 3,970.4 2,771.0 1,100.9 1,557.9 12.2 63.8
2005 463.2 549.8 234.4 441.2 10.8 11.4 58.1 37.2 648.6 661.4 1,170.7 1,277.1 4,219.7 2,912.4 773.7 1,513.5 12.2 77.0
2004 462.2 553.5 258.4 424.9 8.6 11.1 49.1 43.3 669.2 570.7 1,094.4 1,190.3 4,272.6 3,430.8 802.6 1,618.3 11.7 86.4
2003 467.4 509.8 230.4 370.6 10.9 9.8 56.1 42.5 649.6 354.7 1,182.5 1,274.6 4,194.6 3,495.6 872.1 1,656.6 13.9 91.2

City-data.com crime index counts serious crimes and violent crime more heavily. It adjusts for the number of visitors and daily workers commuting into cities. (higher means more crime, U.S. average = 301.1)


Crime per year
Type City-data.com crime indexRobberiesMurdersRapesAssaultsBurglariesTheftAuto theftArson
Year AlbuquerqueSacramentoAlbuquerqueSacramentoAlbuquerqueSacramentoAlbuquerqueSacramentoAlbuquerqueSacramentoAlbuquerqueSacramentoAlbuquerqueSacramentoAlbuquerqueSacramentoAlbuquerqueSacramento
2019 677.9 338.3 1,725 1,039 81 34 499 127 5,337 2,023 5,680 2,993 20,728 10,644 5,457 2,717 100 179
2018 714.3 337.6 1,985 1,052 69 36 484 102 5,156 2,139 6,405 2,751 21,736 9,783 6,651 2,883 108 146
2017 785.8 339.6 2,930 1,100 70 39 473 99 4,213 2,140 6,996 2,888 26,670 9,077 7,684 2,718 88 209
2016 680.2 356.5 1,957 1,136 61 41 381 88 3,846 2,284 6,236 3,070 24,582 9,389 7,710 2,824 111 173
2015 592.5 381.5 1,686 1,174 43 43 404 105 3,273 2,289 5,996 3,713 22,818 9,865 5,179 2,923 89 140
2014 530.3 328.7 1,381 1,000 30 28 402 78 3,121 1,862 6,123 3,238 20,756 9,443 3,558 2,397 86 169
2013 512.4 378.9 1,046 1,158 37 34 439 95 2,803 1,850 7,297 3,886 20,229 11,233 3,005 2,861 83 164
2012 483.8 425.6 1,092 1,211 41 34 278 125 2,740 2,150 6,677 4,474 20,298 12,147 2,743 3,346 86 130
2011 467.4 409.4 998 1,162 38 36 264 134 2,910 2,022 5,985 4,141 19,168 11,087 2,823 3,335 133 146
2010 469.1 482.0 940 1,491 42 33 338 165 2,971 2,423 5,465 5,027 18,134 11,179 2,773 3,994 121 202
2009 511.8 492.2 1,103 1,606 56 30 326 179 2,597 2,350 6,376 5,135 19,365 11,720 3,399 4,146 98 168
2008 573.0 546.0 1,350 1,761 38 49 370 168 2,960 2,682 6,224 5,216 21,098 12,373 4,672 4,910 132 210
2007 578.9 608.8 1,439 2,009 47 44 307 194 3,287 2,881 5,622 5,422 18,632 12,904 5,039 6,073 90 281
2006 587.1 665.9 1,171 2,188 34 57 286 196 3,059 3,115 6,352 6,175 19,890 12,762 5,515 7,175 61 294
2005 463.2 549.8 1,150 2,018 53 52 285 170 3,182 3,025 5,744 5,841 20,703 13,320 3,796 6,922 60 352
2004 462.2 553.5 1,238 1,914 41 50 235 195 3,206 2,571 5,243 5,362 20,469 15,455 3,845 7,290 56 389
2003 467.4 509.8 1,080 1,630 51 43 263 187 3,045 1,560 5,543 5,606 19,663 15,374 4,088 7,286 65 401

City-data.com crime index counts serious crimes and violent crime more heavily. It adjusts for the number of visitors and daily workers commuting into cities. (higher means more crime, U.S. average = 301.1)

Sex Offenders

According to our data, there are 848 registered sex offenders living in Albuquerque and 2,168 registered sex offenders living in .
The ratio of residents to sex offenders in Albuquerque is 660 to 1; the ratio in Sacramento is 228 to 1.
The number of registered sex offenders compared to the number of residents is a lot smaller in Albuquerque than in Sacramento.

Cost of Living

Cost of living in Albuquerque is substantially lower than Sacramento. This is heavily influenced by housing costs, which are over 50% lower in Albuquerque. Other factors like groceries and health are also more affordable in Albuquerque. Sacramento, while more costly, offers the benefits of Californian living with close proximity to major destinations and amenities.

Income Tax

New Mexico's state income tax, which Albuquerque follows, ranges from 1.7% to 4.9%. On the other hand, California has one of the highest state income taxes in the country, spanning from 1% to 13.3%, affecting Sacramento residents and workers.

Property Tax

Property tax is noticeably lower in Albuquerque, with an average rate of 0.78%, in contrast to Sacramento’s average rate of 0.76-1.25% depending on the area.

Sales Tax

Albuquerque's sales tax rate is 7.88%, while Sacramento charges higher at 8.75%. These rates can slightly impact the cost of living and vacation budgets.
Income
Type Albuquerque Sacramento
Estimated median household income $58,512 $75,311
Estimated per capita income $35,738 $37,916
Cost of living index (U.S. average is 100) 93.6 102.9

If you make $50,000 in Albuquerque, you will have to make $54,968 in Sacramento to maintain the same standard of living.

Geographical Conditions

Albuquerque, equipped with its mountainous desert countryside, is perfect for those who love outdoor activities. Sacramento's geography, with the Sacramento River, nearby forests, and proximity to the coastline, also offers a variety of outdoor recreation options.
Geographical information
Type Albuquerque Sacramento
Land area 180.6 sq. miles 97.2 sq. miles
Population density 3,114.4 people per sq. mile 5,404 people per sq. mile
Elevation 4,955 feet 20 feet
Relative area comparison
Albuquerque, NM Sacramento, CA
First ancestry reported - percentage
Ancestry AlbuquerqueSacramento
English 4.2% 1.9%
German 4.0% 2.4%
Irish 3.0% 2.0%
Italian 1.6% 1.6%
Polish 0.6% 0.5%
Scottish 0.6% 0.4%
French 0.5% 0.3%
Scotch-Irish 0.5% 0.3%
Norwegian 0.4% 0.4%
Dutch 0.3% 0.1%
Russian 0.3% 0.7%
Greek 0.2% 0.2%
Swedish 0.2% 0.2%
Ukrainian 0.2% 0.6%
Portuguese 0.1% 0.4%
Population origin - absolute values
Ancestry AlbuquerqueSacramento
English 13,447 5,407
German 12,897 6,833
Irish 9,752 5,802
Italian 5,027 4,509
Polish 1,839 1,423
Scottish 1,790 1,082
French 1,661 792
Scotch-Irish 1,631 726
Norwegian 1,158 1,087
Dutch 1,039 327
Russian 856 2,160
Greek 709 545
Swedish 706 594
Welsh 633 179
Czech 540 123
French Canadian 503 369
Ukrainian 494 1,614
Portuguese 412 1,192
Danish 411 390
Hungarian 286 231
Foreign born residents - absolute values
Type Count
Region AlbuquerqueSacramento
All 57,686 111,676
Africa 2,876 2,779
Asia 14,080 54,200
Europe 5,299 7,419
Latin America 34,038 36,841
North America 642 947
Oceania 161 7,440
Foreign born residents - percentage
Type Percentage
Region AlbuquerqueSacramento
All 10.3% 21.3%
Africa 0.5% 0.5%
Asia 2.5% 10.3%
Europe 0.9% 1.4%
Latin America 6.1% 7.0%
North America 0.1% 0.2%
Oceania 0.0% 1.4%

Education

Both cities have numerous educational opportunities. Albuquerque is home to the University of New Mexico, while Sacramento boasts the reputable California State University, Sacramento. Albuquerque’s public schools underperform compared to the national average, whereas Sacramento’s public education is close to the national average. For tourists, both cities have museums and other educational attractions to visit.
School enrollment
Type Albuquerque Sacramento
Nursery, preschool 4,065 (3%) 3,947 (3.2%)
Kindergarten 6,609 (4.8%) 5,715 (4.6%)
Grade 1 to 4 25,692 (18.7%) 20,678 (16.7%)
Grade 5 to 8 25,528 (18.6%) 22,257 (17.9%)
Grade 9 to 12 31,345 (22.8%) 28,721 (23.2%)
College undergrad 34,481 (25.1%) 31,957 (25.8%)
Graduate or professional 9,657 (7%) 10,761 (8.7%)
Students in private schools - absolute values
Type Count
Grade AlbuquerqueSacramento
Grades 1 to 8 (elementary and middle school) 7,143 4,027
Grades 9 to 12 (high school) 2,626 3,147
Undergraduate colleges 5,153 1,807
Students in private schools - percentage
Type Percentage
Grade AlbuquerqueSacramento
Grades 1 to 8 (elementary and middle school) 13.9% 9.4%
Grades 9 to 12 (high school) 8.4% 11.0%
Undergraduate colleges 14.9% 5.7%
Educational attainment
Type Albuquerque Sacramento
Less than high school 8.8% 13.8%
High school or equiv. 22.6% 19.9%
Less than 1 year of college 6.5% 5.9%
1 or more years of college 13.6% 15.4%
Associate degree 10.1% 8.2%
Bachelor's degree 20% 22.7%
Master's degree 12.3% 9%
Profess. school degree 3% 3.4%
Doctorate degree 3.2% 1.8%
Education level (25-year-olds and older)
Type Albuquerque Sacramento
Bachelor's degree or higher 38.5% 36.9%
Graduate or professional degree 18.5% 14.2%
High school or higher 91.2% 86.2%

Work and Economy

Albuquerque's economy relies heavily on public sector jobs, with the federal government being a top employer. The city has also seen growth in the high-tech industry. Sacramento's economy is diverse, with government, healthcare, and education sectors leading. The city is also becoming a hub for startups.

Biggest Employers

The biggest employers in Albuquerque include Sandia National Laboratories and the University of New Mexico. Sacramento's largest employers include the State of California, Sutter Health, and Kaiser Permanente.
Employment and residency - absolute values
Kind AlbuquerqueSacramento
Work and live in this city 183,244 100,101
Work and live in this county 258,490 211,462
Workers who work outside the city they live in 265,363 306,917
Workers who work outside the county they live in 16,376 36,296
Working at home 51,240 59,241
Not working at home 223,626 188,517
Daytime population change due to commuting 37,689 100,933
Employment and residency - percentage
Kind AlbuquerqueSacramento
Work and live in this city 85.1% 60.1%
Work and live in this county 94.0% 85.4%
Workers who work outside the city they live in 14.9% 39.9%
Workers who work outside the county they live in 6.0% 14.7%
Working at home 18.6% 23.9%
Not working at home 81.4% 76.1%
Daytime population change due to commuting 8.4% 24.8%
Geographical mobility: all
Type all
Mobility AlbuquerqueSacramento
Same house 1 year ago 85.2% 86.1%
Moved from abroad 0.3% 0.3%
Moved within same county 10.0% 8.3%
Moved from different state 2.8% 1.0%
Moved within same state 1.6% 4.3%
Geographical mobility: Asian
Type Asian
Mobility AlbuquerqueSacramento
Same house 1 year ago 88.2% 91.3%
Moved from abroad 0.3% 0.7%
Moved within same county 4.8% 4.0%
Moved from different state 5.5% 0.6%
Moved within same state 1.2% 3.4%
Geographical mobility: Black
Type Black
Mobility AlbuquerqueSacramento
Same house 1 year ago 77.7% 84.0%
Moved from abroad 0.7% 0%
Moved within same county 12.1% 11.7%
Moved from different state 5.2% 0.8%
Moved within same state 4.0% 3.5%
Geographical mobility: White
Type White
Mobility AlbuquerqueSacramento
Same house 1 year ago 83.2% 86.8%
Moved from abroad 0.2% 0.1%
Moved within same county 11.2% 7.1%
Moved from different state 4.1% 1.5%
Moved within same state 1.3% 4.5%
Building permits
Type Average valueCount
City AlbuquerqueSacramentoAlbuquerqueSacramento
1997 $97,400 $102,200 2,313 258
1998 $91,800 $126,300 3,090 350
1999 $94,600 $138,300 3,626 922
2000 $94,600 $143,300 3,412 1,954
2001 $99,800 $147,800 3,671 2,739
2002 $102,000 $148,500 4,217 3,242
2003 $109,800 $134,000 5,084 3,603
2004 $125,500 $149,000 5,119 3,155
2005 $138,300 $125,200 4,764 1,856
2006 $148,200 $120,600 3,420 1,785
2007 $186,900 $172,000 2,096 1,337
2008 $176,100 $185,300 1,067 934
2009 $177,900 $166,900 784 199
2010 $177,400 $169,400 814 95
2011 $177,500 $181,500 754 61
2012 $184,800 $173,100 455 142
2013 $195,200 $200,100 434 232
2014 $170,400 $224,000 1,110 256
2015 $195,900 $237,900 973 438
2016 $198,400 $236,300 913 1,017
2017 $192,900 $246,100 1,088 1,728
2018 $199,700 $233,300 1,115 1,610
2019 $214,700 $268,800 906 1,538
2020 $242,600 $277,800 865 935
2021 $253,200 $275,400 773 1,004

There were 773 building permits issued in Albuquerque in 2012 (19 more than in 2011) compared to 1,004 building permits issued in Sacramento in 2012 (943 more than in 2011).

In Albuquerque (Bernalillo County), 55.8% voted for Democrats and 39.4% for Republicans in 2012 Presidential Election. In Sacramento (Sacramento County), 58.1% voted for Democrats and 39.1% for Republicans.

Elections
Type DemocratsRepublicansOther
Year AlbuquerqueSacramentoAlbuquerqueSacramentoAlbuquerqueSacramento
2020 61.3% 61.4% 36.7% 36.1% 2.0% 2.5%
2016 52.4% 58.0% 34.6% 33.8% 13.0% 8.3%
2012 55.8% 58.1% 39.4% 39.1% 4.9% 2.8%
2008 60.2% 58.4% 38.8% 39.4% 1.0% 2.2%
2004 51.6% 49.8% 47.4% 49.6% 0.9% 0.6%
2000 48.8% 49.4% 46.8% 45.4% 4.4% 5.2%
1996 48.3% 49.8% 43.2% 40.8% 8.5% 9.4%
Breakdown of population affiliated with a religious congregation
Type AdherentsCongregations
Religion AlbuquerqueSacramentoAlbuquerqueSacramento
CATHOLIC CHURCH 26.5% 16.2% 10.7% 5.1%
SOUTHERN BAPTIST CONVENTION 2.6% 1.7% 11.4% 8.6%
EPISCOPAL CHURCH 0.7% 0.3% 1.9% 1.4%
CUMBERLAND PRESBYTERIAN CHURCH 0.4% 0.0% 0.2% 0.0%
EVANGELICAL LUTHERAN CHURCH IN AMERICA 0.4% 0.5% 1.9% 1.8%
SEVENTH DAY ADVENTIST CHURCH 0.4% 0.6% 1.9% 2.1%
LUTHERAN CHURCH 0.3% 0.2% 1.7% 1.1%
MUSLIM ESTIMATE 0.3% 0.9% 0.5% 1.3%
AMERICAN BAPTIST CHURCHES IN THE USA 0.1% 0.4% 0.5% 1.7%

Weather

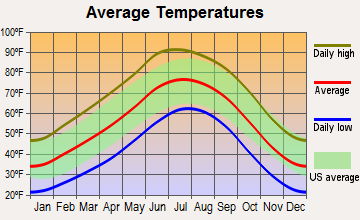
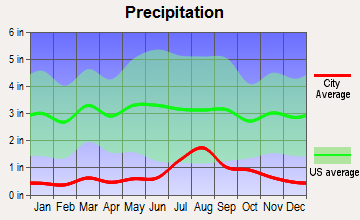
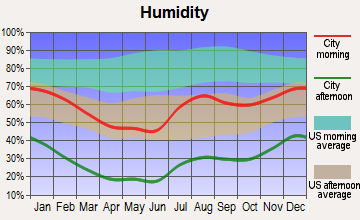
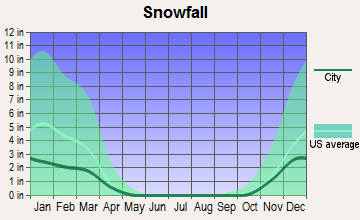
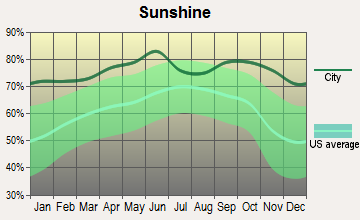
Albuquerque showcases a semi-arid climate, with hot summers and mild to cool winters. It sees over 278 sunny days per year. Sacramento, in contrast, has a Mediterranean climate. Summers are hot and dry, while winters are cool and wet. One noticeable difference is Sacramento's higher humidity compared to Albuquerque.
Weather and climate
Type Albuquerque Sacramento
Temperature - Average 55.6°F 62.2°F
Humidity - Average morning or afternoon humidity 44.3% 66.8%
Humidity - Differences between morning and afternoon humidity 46% 58%
Humidity - Maximum monthly morning or afternoon humidity 63% 87%
Humidity - Minimum monthly morning or afternoon humidity 17% 29%
Precipitation - Yearly average 9.4 in 19 in
Snowfall - Yearly average 19.2 in 0 in
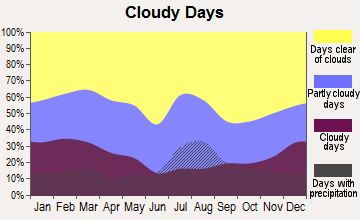
Clouds - Number of days clear of clouds 27.8% 31.5%
Sunshine amount - Average 82.7% 83.6%
Sunshine amount - Differences during a year 9% 52%
Sunshine amount - Maximum monthly 82% 97%
Sunshine amount - Minimum monthly 73% 45%
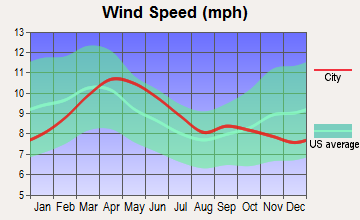
Wind speed - Average 8.9 mph 6.8 mph

Average climate in Albuquerque, New Mexico

Chicago, Illinois average temperatures Chicago, Illinois average precipitation Chicago, Illinois humidity Chicago, Illinois wind speed Chicago, Illinois snowfall Chicago, Illinois sunshine Chicago, Illinois clear and cloudy days
 

Average climate in Sacramento, California

Chicago, Illinois average temperatures Chicago, Illinois average precipitation Chicago, Illinois humidity Chicago, Illinois wind speed Chicago, Illinois snowfall Chicago, Illinois sunshine Chicago, Illinois clear and cloudy days
 

Air pollution
Type AQICONO2OZONEPBPM10PM25SO2
Year AlbuquerqueSacramentoAlbuquerqueSacramentoAlbuquerqueSacramentoAlbuquerqueSacramentoAlbuquerqueSacramentoAlbuquerqueSacramentoAlbuquerqueSacramentoAlbuquerqueSacramento
2018 95 121 0.23 0.32 10.3 9.7 35.3 24.7 N/A 0.002 20.3 28.9 4.3 12.7 0.5 N/A
2017 82 117 0.24 0.33 10.4 9.0 33.5 25.2 N/A 0.002 18.4 22.1 5.7 8.8 0.4 N/A
2016 86 103 0.22 0.44 10.4 8.0 33.2 25.3 N/A 0.002 16.0 14.0 5.3 9.0 0.8 N/A
2015 84 105 0.23 0.25 11.2 9.7 30.8 24.9 N/A 0.002 16.0 16.2 6.1 10.9 0.7 N/A
2014 89 99 0.22 0.24 11.7 10.2 31.8 24.9 N/A 0.002 22.0 15.6 6.1 9.6 0.6 N/A
2013 91 102 0.22 0.29 11.8 11.1 34.1 23.2 N/A 0.002 21.8 21.3 5.7 11.9 0.8 N/A
2012 116 107 0.18 0.31 13.7 10.5 33.6 25.2 N/A 0.002 26.6 15.2 9.3 7.9 0.7 N/A
2011 130 106 0.21 0.29 13.5 11.2 34.0 24.0 N/A 0.002 28.6 17.7 9.9 10.8 0.4 N/A
2010 92 109 0.15 0.29 12.2 11.2 32.1 22.8 N/A N/A 25.1 16.9 6.8 9.3 N/A 0.5
2009 81 118 0.16 0.40 12.5 12.4 30.4 23.3 N/A 0.003 26.2 20.6 6.9 11.4 N/A 0.5
2008 91 130 0.21 0.40 11.8 14.9 31.5 25.4 N/A N/A 20.8 24.3 6.5 13.6 N/A 0.5
2007 112 129 0.29 0.39 13.0 14.8 31.4 23.7 N/A 0.005 19.7 19.9 6.7 13.5 N/A 0.6
2006 103 124 0.33 0.49 14.2 15.4 31.8 22.7 N/A N/A 21.1 23.7 N/A 13.0 N/A 0.5
2005 85 125 0.32 0.42 13.9 15.9 29.7 20.0 N/A N/A 20.0 22.1 N/A 13.5 N/A 0.6
2004 89 119 0.32 0.49 16.6 15.8 29.8 19.1 0.003 N/A 21.5 22.7 N/A 13.3 N/A 0.6
2003 115 119 0.37 0.47 17.6 16.8 31.9 20.3 0.004 N/A 25.1 23.1 N/A N/A N/A 0.9
2002 91 114 0.43 0.50 18.9 18.1 29.1 21.2 0.005 0.004 23.1 25.1 N/A N/A N/A 1.5
2001 81 111 0.67 0.43 17.2 18.0 29.4 21.2 N/A 0.004 20.9 20.7 N/A N/A N/A 1.4
2000 95 107 0.81 0.55 17.0 17.9 27.9 19.5 N/A 0.004 17.7 19.1 N/A N/A N/A 1.4
Natural disasters
Type Albuquerque Sacramento
Tornado activity compared to U.S. average 6.4% 8.8%
Earthquake activity compared to U.S. average 802.6% 7,798.9%
Natural disasters compared to U.S. average 9% 18%

Transportation

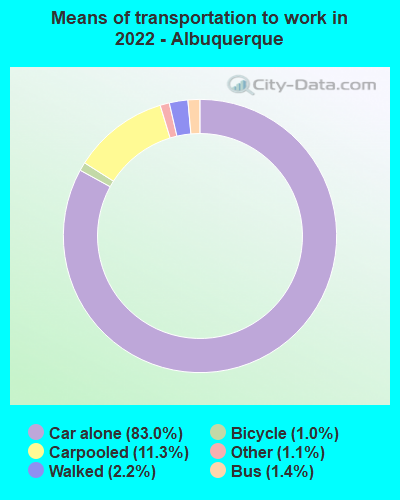
Albuquerque's public transit system, ABQ Ride, serves the city at large, but many residents rely on cars for commuting. Sacramento offers more robust public transit, including light rail and bus service. Commutes tend to be shorter in Sacramento.
Transport
Type Albuquerque Sacramento
Amtrak stations 1 1
Amtrak stations nearby 1 3
FAA registered aircraft 1 414
FAA registered aircraft manufacturers and dealers 17 20
Means of transportation to work
Type Albuquerque Sacramento
Bicycle 0.9% 1.1%
Bus 0.8% 1%
Carpooled 9.6% 12%
Car alone 85.1% 80%
Motorcycle 0.2% 0.2%
Railroad 0% 0.4%
Taxicab 0% 0.1%
Walked 2.3% 2.8%
Means of transportation to work
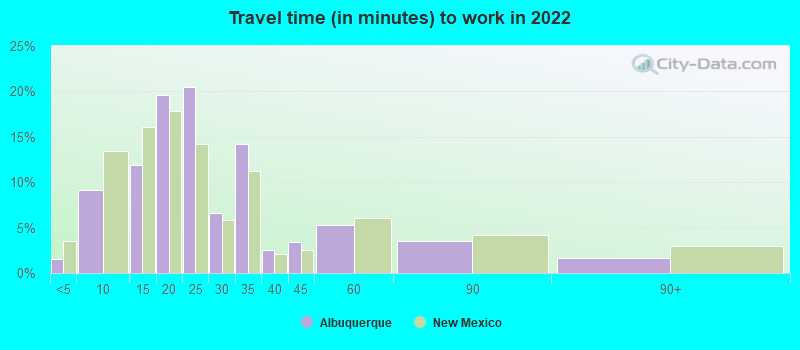
Average travel time to work
Type Albuquerque Sacramento
Average 24.5 min 28.5 min
Other means 20.8 min 22.8 min
Public transportation 37.8 min 39 min
Travel time to work
Time leaving to work
Travel time to work
Time leaving to work
Private vehicle occupancy
Type Albuquerque Sacramento
Average 1.1 1.2
Drove alone 91.6% 88.5%
In 2 person carpool 6.6% 9.4%
In 3 person carpool 1.2% 1.2%
In 4 person carpool 0.3% 0.4%
In 5-6 person carpool 0.1% 0.5%
In 7+ person carpool 0.2% 0%

How many people usually rode to work in the car, truck or van.

Real Estate

Albuquerque's real estate market is more accessible, with the median home value significantly lower than in Sacramento. Sacramento's market is tighter and more expensive, driven by California's high demand and pricing.

Neighborhoods

Albuquerque offers diverse neighborhoods, from historic, artsy areas to more urban, downtown locales. Sacramento brims with distinctive neighborhoods, from upscale East Sacramento to hip, trendy Midtown. Tourists can soak in the vibe of both cities by exploring these unique neighborhoods.
Houses and residents
Type Albuquerque Sacramento
Houses 256,814 210,715
Average household size (people) 2.4 2.6
Median year apartment built 1983 1977
Median year house/condo built 1984 1978
Length of stay in the house since moving in 12.6 years 12.8 years
Houses occupied 243,582 (94.8%) 202,093 (95.9%)
Houses occupied by owners 147,964 (60.7%) 103,994 (51.5%)
Houses occupied by renters 95,618 (39.3%) 98,099 (48.5%)
Median rent asked for vacant for-rent units $893.82 $976.09
Median monthly housing costs $1,021 $1,558
Median price asked for vacant for-sale houses and condos $171,149 $398,191
Estimated median house or condo value $251,500 $449,600
Median numbers of rooms 5.3 5
Median number of rooms in apartments 3.9 4.1
Median number of rooms in houses and condos 6.2 5.8
Median house price - detached houses $290,578 $496,462
Median house price - in 2-unit structures $636,758 $630,561
Median house price - in 3-to-4-unit structures $274,794 $205,310
Median house price - in 5 or more unit structures $224,872 $382,635
Median house price - mobile homes $52,392 $104,325
Median house price - Townhouses or other attached units $209,825 $463,571
Median house price - All housing units $271,083 $481,210
Median house age 38 44
Renting percentage 39.7% 50.6%
Housing density (houses/condos per square mile) 1,421.7 2,168.8
House value disparities 29.8% 25.5%
Household income disparities 45.9% 44%
Median household income for houses/condes with a mortgage $87,851 $109,432
Median household income for apartments without a mortgage $63,195 $82,443
Housing units without a mortgage 1,631 (1.6%) 1,166 (1.6%)
Housing units with both a second mortgage and home equity loan 3,560 (3.6%) 4,385 (6.1%)
Housing units with a mortgage 97,744 (98.4%) 70,415 (98.4%)
Housing units with a home equity loan 309 (0.3%) 204 (0.3%)
Housing units with a second mortgage 6,864 (6.9%) 5,362 (7.5%)
House/condo owner moved in on average (years ago) 11 10
House/condo renter moved in on average (years ago) 1 3
Housing units lacking complete kitchen facilities 1.1% 1.2%
Housing units lacking complete plumbing facilities 0.3% 0.3%
Housing units in structures
Housing units in structures AlbuquerqueSacramento
One, detached 61.4% 61.7%
One, attached 6.6% 6.8%
Two 1.0% 1.8%
3 or 4 6.1% 4.8%
5 to 9 4.7% 6.9%
10 to 19 4.7% 4.9%
20 to 49 4.8% 3.5%
50 or more 6.3% 7.6%
Mobile homes 4.2% 1.9%
Median real estate property taxes paid for housing units
Type Albuquerque Sacramento
With mortgages $2,496 (1%) $3,776 (0.8%)
With no mortgages $2,332 (1%) $2,646 (0.6%)
Marital status
Type Albuquerque Sacramento
Divorced 14.2% 10%
Never married 36.6% 41.1%
Now married 42.6% 42.5%
Separated 1.5% 2.2%
Widowed 5.2% 4.2%
Class of workers - percentage
Class of Workers AlbuquerqueSacramento
Employee of private company 60.3% 57.1%
Private not-for-profit wage and salary workers 8.6% 8.1%
Local government workers 7.9% 8.5%
Federal government workers 7.8% 2.5%
State government workers 7.5% 16.0%
Self-employed workers in own not incorporated business 5.1% 5.1%
Self-employed in own incorporated business 2.7% 2.4%
Unpaid family workers 0.1% 0.3%
Class of workers - absolute values
Class of Workers AlbuquerqueSacramento
Employee of private company 166,046 143,927
Federal government workers 21,450 6,340
Local government workers 21,646 21,346
Private not-for-profit wage and salary workers 23,806 20,416
Self-employed in own incorporated business 7,406 6,140
Self-employed workers in own not incorporated business 14,060 12,891
State government workers 20,531 40,274
Unpaid family workers 359 755

Industries and Occupations

In Albuquerque, healthcare, education, and retail are major industries. In Sacramento, government, healthcare, and education reign supreme. In terms of occupation, Albuquerque sees more jobs in office and administrative support, while Sacramento has a broader occupational range due to its more diverse economy.
Most common male industries
Industry AlbuquerqueSacramento
Professional, scientific, and technical services 15.1% 8.1%
Retail trade 10.4% 9.6%
Construction 9.4% 12.7%
Public administration 8.8% 11.0%
Health care and social assistance 7.4% 6.8%
Educational services 7.2% 7.0%
Accommodation and food services 6.5% 6.9%
Administrative and support and waste management services 5.9% 5.4%
Manufacturing 5.7% 7.7%
Transportation and warehousing 5.3% 7.1%
Other services, except public administration 4.2% 3.5%
Wholesale trade 2.7% 2.2%
Finance and insurance 2.3% 2.5%
Arts, entertainment, and recreation 2.3% 2.8%
Information 2.0% 2.4%
Real estate and rental and leasing 1.8% 1.8%
Agriculture, forestry, fishing and hunting 1.3% 0.9%
Utilities 1.0% 1.5%
Mining, quarrying, and oil and gas extraction 0.6% 0.1%
Most common female industries
Industry AlbuquerqueSacramento
Health care and social assistance 25.6% 19.2%
Educational services 13.8% 12.0%
Retail trade 10.4% 8.9%
Professional, scientific, and technical services 8.9% 8.1%
Accommodation and food services 8.6% 7.4%
Public administration 7.7% 15.2%
Finance and insurance 5.1% 4.8%
Administrative and support and waste management services 4.0% 3.0%
Other services, except public administration 3.7% 5.3%
Manufacturing 3.2% 4.1%
Arts, entertainment, and recreation 1.8% 2.4%
Real estate and rental and leasing 1.5% 1.2%
Wholesale trade 1.3% 1.5%
Construction 1.2% 1.2%
Information 1.1% 1.0%
Transportation and warehousing 1.0% 3.6%
Utilities 0.6% 0.7%
Agriculture, forestry, fishing and hunting 0.4% 0.5%
Management of companies and enterprises 0.1% 0.1%
Most common male occupations
Occupation AlbuquerqueSacramento
Management occupations 10.5% 10.1%
Construction and extraction occupations 8.5% 9.9%
Computer and mathematical occupations 7.1% 5.3%
Office and administrative support occupations 6.5% 9.7%
Sales and related occupations 5.9% 8.0%
Transportation occupations 5.8% 4.5%
Business and financial operations occupations 5.4% 6.6%
Installation, maintenance, and repair occupations 5.2% 3.5%
Material moving occupations 5.1% 4.9%
Food preparation and serving related occupations 5.0% 5.1%
Architecture and engineering occupations 5.0% 3.1%
Educational instruction, and library occupations 4.2% 2.9%
Building and grounds cleaning and maintenance occupations 3.8% 5.1%
Firefighting and prevention, and other protective service workers including supervisors 3.1% 1.1%
Production occupations 3.0% 4.8%
Health diagnosing and treating practitioners and other technical occupations 2.9% 2.4%
Life, physical, and social science occupations 2.2% 1.8%
Arts, design, entertainment, sports, and media occupations 2.0% 2.2%
Personal care and service occupations 1.8% 1.2%
Law enforcement workers including supervisors 1.7% 0.9%
Most common female occupations
Occupation AlbuquerqueSacramento
Office and administrative support occupations 14.1% 18.0%
Educational instruction, and library occupations 10.9% 7.1%
Management occupations 9.8% 9.6%
Sales and related occupations 9.0% 7.6%
Health diagnosing and treating practitioners and other technical occupations 8.9% 5.8%
Healthcare support occupations 7.1% 5.6%
Food preparation and serving related occupations 6.5% 5.3%
Business and financial operations occupations 6.1% 9.0%
Health technologists and technicians 4.2% 1.8%
Community and social service occupations 3.1% 3.6%
Personal care and service occupations 2.9% 3.5%
Production occupations 2.1% 2.6%
Architecture and engineering occupations 2.0% 0.9%
Building and grounds cleaning and maintenance occupations 2.0% 2.6%
Material moving occupations 1.9% 2.1%
Legal occupations 1.9% 2.6%
Arts, design, entertainment, sports, and media occupations 1.9% 2.9%
Computer and mathematical occupations 1.9% 3.4%
Life, physical, and social science occupations 1.8% 2.7%
Transportation occupations 0.5% 1.4%
Food environment data per 10,000 residents
Food environment statistics AlbuquerqueSacramento
Number of convenience stores (no gas) 3.0 1.7
Number of convenience stores (with gas) 0.2 0.6
Number of full-service restaurants 7.0 6.7
Number of grocery stores 1.4 1.9
Number of supercenters and club stores 0.2 0.1
Food environment - absolute values
Food environment statistics AlbuquerqueSacramento
Number of convenience stores (no gas) 189 233
Number of convenience stores (with gas) 11 86
Number of full-service restaurants 437 922
Number of grocery stores 85 255
Number of supercenters and club stores 11 10
Obesity and diabetes
Food environment statistics rate AlbuquerqueSacramento
Adult diabetes rate 5.3% 7.8%
Adult obesity rate 20.0% 25.0%
Low-income preschool obesity rate 9.8% 15.4%

Health Care

Albuquerque has numerous healthcare facilities, including the acclaimed University of New Mexico Hospital. Sacramento is dotted with state-of-the-art hospitals like UC Davis Medical Center and Mercy General Hospital. It boasts better healthcare overall due to the availability of more advanced facilities and greater number of healthcare providers.
Health (county statistics)
Type Albuquerque Sacramento
General health status score of residents in this county from 1 (poor) to 5 (excellent) 3.5 3.6
Average weight of females (lbs) 157.8 lbs 159.8 lbs
Average weight of males (lbs) 192.1 lbs 192.5 lbs
Residents visited a dentist within the past year 69.3% 70%
Residents exercised in the past month 77.5% 76.9%
Adult residents drank alcohol in the past 30 days 52.3% 59.3%
Residents smoked 100+ cigarettes in their lives 43.3% 37.4%

Fatal vehicle accidents per 100,000 residents
Type Total count per 100,000Drunk per 100,000Fatal count per 100,000Pedestrian count per 100,000Person count per 100,000Vehicle count per 100,000
Year AlbuquerqueSacramentoAlbuquerqueSacramentoAlbuquerqueSacramentoAlbuquerqueSacramentoAlbuquerqueSacramentoAlbuquerqueSacramento
2021 22.2 13.3 0.0 0.0 23.6 14.1 9.6 6.1 50.7 27.8 36.8 21.9
2020 17.9 9.6 3.9 2.3 18.6 9.7 6.2 5.3 34.7 18.3 26.7 15.5
2019 17.3 9.6 3.7 1.8 18.0 11.0 8.7 4.5 39.2 19.6 26.6 13.7
2018 14.3 10.9 2.5 3.0 15.2 10.9 7.9 6.7 33.9 18.4 22.5 15.7
2017 13.8 13.2 3.6 3.6 15.0 15.2 6.1 5.6 35.4 24.7 22.9 19.3
2016 16.1 10.6 5.5 2.8 16.8 11.0 6.1 5.1 38.6 23.8 23.1 17.9
2015 9.1 10.5 3.9 4.5 10.0 11.3 3.6 3.7 20.8 24.9 14.2 16.6
2014 9.9 8.9 2.2 1.9 10.4 9.3 5.2 3.7 18.3 20.0 13.5 13.2
2013 7.7 9.4 1.3 3.1 8.3 9.8 3.6 3.8 16.9 19.6 12.0 13.3
2012 9.7 5.5 2.3 0.6 9.9 5.9 4.1 1.9 20.5 12.6 14.9 8.6
2011 7.1 8.7 2.0 1.9 7.8 8.7 2.5 3.6 17.9 23.7 11.0 14.4
2010 6.8 10.7 2.6 4.1 7.9 11.4 2.2 5.6 15.2 23.4 10.8 14.8
2009 8.5 6.0 2.1 2.1 8.7 6.9 2.5 2.1 24.4 18.4 14.2 10.7
2008 9.2 6.5 3.4 2.8 9.6 6.9 3.1 2.4 23.5 17.6 13.6 8.9
2007 10.7 10.1 5.0 4.4 10.8 11.8 3.7 2.9 27.3 26.3 15.7 15.8
2006 12.2 7.1 5.5 3.8 12.8 7.3 4.5 2.7 30.9 19.3 17.9 10.5
2005 11.7 11.4 5.2 4.2 13.7 11.4 4.6 4.5 30.4 29.9 17.3 16.5
2004 14.2 10.5 5.6 6.1 14.6 11.0 3.1 3.8 38.3 30.9 22.9 14.6
2003 9.1 11.6 5.5 4.3 9.9 13.2 3.4 4.8 23.0 33.2 13.3 17.3
2002 11.4 12.0 4.9 5.1 11.6 12.2 3.9 5.1 32.0 30.0 17.6 16.6
2001 14.3 9.5 5.9 2.9 14.9 10.0 5.9 3.8 38.6 32.5 20.4 17.1
2000 11.4 9.3 5.6 4.2 12.0 9.8 5.6 2.5 38.1 29.7 17.8 16.5
1999 11.9 7.1 6.4 2.2 13.8 8.4 3.1 3.7 34.0 21.6 18.8 9.1
1998 10.7 5.7 3.8 1.7 10.7 5.9 3.6 3.0 31.8 16.3 16.8 7.2
1997 12.6 11.7 5.0 2.5 14.3 12.2 5.2 5.5 34.0 34.3 18.1 18.4
1996 16.2 9.7 6.2 4.2 17.6 11.0 4.8 3.7 50.4 31.5 27.6 15.5
1995 14.1 9.5 3.8 3.3 16.2 10.0 5.3 3.5 41.3 25.8 24.1 14.5
1994 13.8 10.5 5.8 3.5 15.0 11.0 5.8 4.8 37.0 28.8 18.9 14.5
1993 15.0 11.7 7.4 3.5 15.5 11.9 4.4 5.5 45.0 30.4 24.4 16.2
1992 15.7 12.9 7.0 6.2 18.0 13.4 6.7 5.2 46.9 35.7 22.7 19.1
1991 13.2 11.0 5.8 4.5 14.2 11.5 5.1 3.2 38.9 30.6 19.1 16.7
1990 16.8 12.6 7.2 4.5 17.3 12.8 0.0 0.0 50.3 30.6 25.5 17.1
1989 15.5 15.3 7.1 6.4 16.1 16.4 0.0 0.0 45.6 44.4 25.0 23.9
1988 17.1 19.7 8.0 8.3 17.4 21.4 0.0 0.0 48.3 51.3 25.6 28.2
1987 21.7 18.8 11.1 8.8 24.4 19.6 0.0 0.0 62.0 47.5 33.6 26.4
1986 22.0 15.7 9.3 7.2 22.3 17.2 0.0 0.0 61.0 39.5 30.8 24.1
1985 19.8 13.3 10.6 4.7 21.7 16.1 0.0 0.0 55.2 57.7 28.1 28.2
1984 17.2 16.9 9.3 7.7 20.1 17.9 0.0 0.0 49.2 37.0 25.4 23.6
1983 13.5 15.1 5.5 6.9 15.2 15.1 0.0 0.0 33.3 40.8 16.9 19.7
1982 11.1 13.2 8.2 5.8 13.4 13.9 0.0 0.0 27.1 32.6 13.4 18.3
1981 10.9 16.5 5.3 10.5 11.5 17.9 0.0 0.0 25.7 41.4 14.5 23.2
1980 14.7 20.3 6.9 9.8 14.7 21.4 0.0 0.0 33.6 52.2 20.4 25.0
1979 18.8 20.8 6.8 9.5 19.7 23.0 0.0 0.0 46.9 50.0 25.9 29.9
1978 28.2 19.9 11.7 8.5 30.1 20.2 0.0 0.0 71.7 51.5 39.0 30.5
1977 22.8 17.4 8.2 10.4 25.1 18.5 0.0 0.0 65.3 43.3 32.6 24.1
1976 17.5 14.5 0.0 4.8 19.5 14.5 0.0 0.0 50.7 30.6 25.9 18.3
1975 18.0 14.6 0.0 4.9 20.1 14.6 0.0 0.0 52.3 30.8 26.7 18.4

Fatal vehicle accidents
Type Total countDrunkFatal countPedestrian countPerson countVehicle count
Year AlbuquerqueSacramentoAlbuquerqueSacramentoAlbuquerqueSacramentoAlbuquerqueSacramentoAlbuquerqueSacramentoAlbuquerqueSacramento
1975 52 39 0 13 58 39 0 0 151 82 77 49
1976 52 39 0 13 58 39 0 0 151 82 77 49
1977 70 47 25 28 77 50 0 0 200 117 100 65
1978 89 54 37 23 95 55 0 0 226 140 123 83
1979 61 57 22 26 64 63 0 0 152 137 84 82
1980 49 56 23 27 49 59 0 0 112 144 68 69
1981 37 47 18 30 39 51 0 0 87 118 49 66
1982 38 39 28 17 46 41 0 0 93 96 46 54
1983 47 46 19 21 53 46 0 0 116 124 59 60
1984 61 53 33 24 71 56 0 0 174 116 90 74
1985 71 43 38 15 78 52 0 0 198 186 101 91
1986 80 52 34 24 81 57 0 0 222 131 112 80
1987 80 64 41 30 90 67 0 0 229 162 124 90
1988 64 69 30 29 65 75 0 0 181 180 96 99
1989 59 55 27 23 61 59 0 0 173 160 95 86
1990 65 50 28 18 67 51 0 0 195 122 99 68
1991 52 44 23 18 56 46 20 13 153 123 75 67
1992 63 52 28 25 72 54 27 21 188 144 91 77
1993 61 47 30 14 63 48 18 22 183 122 99 65
1994 57 42 24 14 62 44 24 19 153 115 78 58
1995 59 38 16 13 68 40 22 14 173 103 101 58
1996 68 39 26 17 74 44 20 15 212 126 116 62
1997 53 47 21 10 60 49 22 22 143 138 76 74
1998 45 23 16 7 45 24 15 12 134 66 71 29
1999 50 29 27 9 58 34 13 15 143 88 79 37
2000 51 38 25 17 54 40 25 10 171 121 80 67
2001 65 40 27 12 68 42 27 16 176 137 93 72
2002 53 52 23 22 54 53 18 22 149 130 82 72
2003 43 51 26 19 47 58 16 21 109 146 63 76
2004 69 47 27 27 71 49 15 17 186 138 111 65
2005 58 51 26 19 68 51 23 20 151 134 86 74
2006 62 32 28 17 65 33 23 12 157 87 91 47
2007 55 46 26 20 56 54 19 13 141 120 81 72
2008 48 30 18 13 50 32 16 11 123 81 71 41
2009 45 28 11 10 46 32 13 10 129 86 75 50
2010 37 50 14 19 43 53 12 26 83 109 59 69
2011 39 41 11 9 43 41 14 17 99 112 61 68
2012 54 26 13 3 55 28 23 9 114 60 83 41
2013 43 45 7 15 46 47 20 18 94 94 67 64
2014 55 43 12 9 58 45 29 18 102 97 75 64
2015 51 51 22 22 56 55 20 18 116 121 79 81
2016 90 52 31 14 94 54 34 25 216 117 129 88
2017 77 66 20 18 84 76 34 28 198 123 128 96
2018 80 55 14 15 85 55 44 34 190 93 126 79
2019 97 49 21 9 101 56 49 23 220 100 149 70
2020 101 50 22 12 105 51 35 28 196 96 151 81
2021 125 70 0 0 133 74 54 32 285 146 207 115
Police full-time law enforcement employees
Year AlbuquerqueSacramento
2021 1,474 997
2020 0 1,012
2019 1,464 993
2018 0 948
2017 0 925
2016 0 954
2015 0 949
2014 1,301 921
2013 0 880
2012 1,413 861
2011 1,416 947
2010 1,441 1,019
2009 1,473 1,027
2008 1,488 1,078
2007 1,384 1,026
2006 1,384 1,083
2005 1,349 1,013
2004 1,296 1,043
2003 1,190 1,045
Police full-time law enforcement employees (per 1,000 residents)
Year AlbuquerqueSacramento
2021 2.6 1.9
2020 0.0 2.0
2019 2.6 1.9
2018 0.0 1.9
2017 0.0 1.9
2016 0.0 1.9
2015 0.0 1.9
2014 2.3 1.9
2013 0.0 1.8
2012 2.6 1.8
2011 2.6 2.0
2010 2.6 2.2
2009 2.8 2.2
2008 2.8 2.3
2007 2.7 2.2
2006 2.8 2.4
2005 2.8 2.2
2004 2.7 2.3
2003 2.5 2.4
Local government: full-time employees
Job AlbuquerqueSacramento
Airports 241 0
Financial administration 233 272
Firefighters 444 613
Fire - other 231 39
Health 189 0
Judicial and legal 48 49
Local libraries 125 0
Natural resources 54 32
Other and unallocable 501 289
Other government administration 768 184
Parks and recreation 610 356
Police - other 562 329
Police protection - officers 850 667
Sewerage 199 138
Solid waste management 270 158
Streets and highways 42 237
Totals for government 6,080 3,892
Transit 408 0
Water supply 187 356
Welfare 33 0
Local government: part-time employees
Job AlbuquerqueSacramento
Financial administration 2 4
Health 2 0
Judicial and legal 2 1
Local libraries 22 0
Other and unallocable 29 4
Other government administration 10 14
Parks and recreation 655 568
Police - other 6 84
Police protection - officers 115 0
Sewerage 4 0
Solid waste management 2 0
Totals for government 869 685
Water supply 0 4
Welfare 20 0
Place of birth - Foreign born
Residents AlbuquerqueSacramento
All residents 9.9% 22.0%
American Indian / Alaska Native residents 5.2% 25.8%
Asian residents 54.5% 51.9%
Black or African American residents 12.7% 4.5%
Native Hawaiian / Pacific Islander residents 6.1% 64.2%
Other race residents 21.1% 30.9%
Two or more races residents 9.0% 11.0%
White residents 4.0% 7.8%
White alone, not Hispanic / Latino residents 3.7% 7.3%
Place of birth - Native, outside of US
Residents AlbuquerqueSacramento
All residents 1.5% 1.7%
Asian residents 0.8% 2.1%
Black or African American residents 0.0% 0.8%
Native Hawaiian / Pacific Islander residents 8.8% 1.9%
Other race residents 0.6% 1.7%
Two or more races residents 2.4% 2.7%
White residents 1.7% 1.4%
White alone, not Hispanic / Latino residents 1.5% 1.1%
Place of birth - Born in state of residence
Residents AlbuquerqueSacramento
All residents 51.9% 60.7%
American Indian / Alaska Native residents 75.0% 70.0%
Asian residents 26.2% 40.9%
Black or African American residents 31.4% 71.7%
Native Hawaiian / Pacific Islander residents 51.9% 30.0%
Other race residents 60.8% 62.6%
Two or more races residents 66.5% 74.0%
White residents 39.8% 63.3%
White alone, not Hispanic / Latino residents 33.6% 63.9%
Place of birth - Born in other state
Residents AlbuquerqueSacramento
All residents 36.7% 15.5%
American Indian / Alaska Native residents 19.8% 4.3%
Asian residents 18.5% 5.0%
Black or African American residents 55.9% 23.0%
Native Hawaiian / Pacific Islander residents 33.2% 4.0%
Other race residents 17.5% 4.8%
Two or more races residents 22.1% 12.3%
White residents 54.5% 27.5%
White alone, not Hispanic / Latino residents 61.2% 27.7%
English speakers (speaking English at home)
Type Albuquerque Sacramento
Born in the United States residents 87.4% 89.6%
Foreign born residents 12.9% 10.2%
Native, born elsewhere residents 70.7% 60.6%
Total residents 73.3% 64.7%
Mechanisms of homicide
Mechanism AlbuquerqueSacramento
Homicides from 2000 to 2006 350 609
Cut / Pierce 49 84
Firearm 200 408
Mechanisms of homicide per 1,000,000 residents
Mechanism AlbuquerqueSacramento
Homicides from 2000 to 2006 85.4 66.4
Cut / Pierce 12.0 9.2
Firearm 48.8 44.5
Mechanisms of suicide per 1,000,000 residents
Mechanism AlbuquerqueSacramento
Suicides from 2000 to 2006 181.8 115.0
Firearm 95.2 49.6
Poisoning 38.3 24.7
Suffocation 38.8 29.8

Infrastructure

Albuquerque's infrastructure is marked by wide roads and highways. It has made significant efforts to improve bicycle infrastructure. Sacramento, known for its tree-lined streets, has been investing heavily in its infrastructure, particularly in public transportation and green energy projects.
Infrastructure
Type Albuquerque Sacramento
Hospitals 36 17
TV stations 18 23
Arenas or stadiums 1 1
Bank branches located here 137 127
Bank institutions located here 24 31
Main business address for public companies 8 5
Drinking water stations with no reported violations in the past 7 26
Drinking water stations with reported violations in the past 30 20

Schools

School facilities
Type Albuquerque Sacramento
Private elementary/middle schools 27 26
Private high schools 19 19
Public elementary/middle schools 133 142
Public high schools 58 54
Colleges/Universities 18 22
HMDA - Conventional home purchase loans - Applications denied
Year AlbuquerqueSacramento
1999 2,651 1,003
2000 1,303 1,155
2001 752 983
2002 693 1,197
2003 1,022 2,258
2004 1,729 3,872
2005 2,199 4,610
2006 2,639 4,276
2007 1,575 2,386
2008 654 1,381
2009 368 647

Culture and Food

Albuquerque boasts a vibrant mixed heritage culture with native, Spanish, and Mexican influences. Its culinary scene is renowned for its delicious New Mexican cuisine, particularly green and red chile. Sacramento, "the Farm-to-Fork Capital," offers diverse cuisine showcasing local and fresh ingredients from surrounding farms. Both cities boast a thriving arts scene.

Sports Teams

Albuquerque has minor league sports, with popular teams like the Albuquerque Isotopes (baseball) and New Mexico United (soccer). Sacramento is home to the NBA team Sacramento Kings, AFL team Sacramento Republic FC, and several minor league teams.
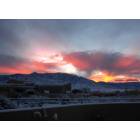
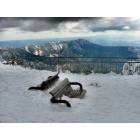